HAL Id: hal-00926221
https://hal.archives-ouvertes.fr/hal-00926221
Submitted on 17 Jul 2017HAL is a multi-disciplinary open access archive for the deposit and dissemination of sci-entific research documents, whether they are pub-lished or not. The documents may come from teaching and research institutions in France or abroad, or from public or private research centers.
L’archive ouverte pluridisciplinaire HAL, est destinée au dépôt et à la diffusion de documents scientifiques de niveau recherche, publiés ou non, émanant des établissements d’enseignement et de recherche français ou étrangers, des laboratoires publics ou privés.
(France) between 7600 and 4000 cal. BP: Reconstitution
from basal-peat deposits.
Jérôme Goslin, Brigitte van Vliet-Lanoë, Pierre Stéphan, Christophe
Delacourt, Assia Fernane, Emmanuel Gandouin, Alain Hénaff, Aurélie
Pénaud, Serge Suanez
To cite this version:
Jérôme Goslin, Brigitte van Vliet-Lanoë, Pierre Stéphan, Christophe Delacourt, Assia Fernane, et al.. Holocene relative sea-level changes in western Brittany (France) between 7600 and 4000 cal. BP: Reconstitution from basal-peat deposits.. Géomorphologie : relief, processus, environnement, Groupe français de géomorphologie (GFG), 2013, Systèmes géomorphologiques : renouveler les thématiques, les outils et les méthodes, 19 (4), pp.425-444. �10.4000/geomorphologie.10386�. �hal-00926221�
Holocene relative sea-level changes in western Brittany
(France) between 7600 and 4000 cal. BP: Reconstitution
from basal-peat deposits
Variations du niveau marin relatif holocène dans lʼouest de la
Bretagne (France) : reconstitution à partir des tourbes de
base entre 7600 et 4000 cal. BP
Jérôme Goslin*, Brigitte Van Vliet-Lanoë**, Pierre Stephan*, Christophe Delacourt**, Assia
Fernane**, Emmanuel Gandouin***, Alain Hénaff*, Aurélie Penaud**, Serge Suanez*
* UMR CNRS 6554 LETG – Geomer – IUEM/Université Bretagne Occidentale – 1 place Nicolas Copernic – 29280 Plouzané – France (jerome.gos-lin@univ-brest.fr).
** UMR CNRS 6538 Domaines océaniques – IUEM/Université Bretagne Occidentale – 1 place Nicolas Copernic – 29280 Plouzané – France. *** UMR CNRS 6116 IMEP – Université Paul Cézanne – Europole Méditerranéen de l’Arbois – 13545 Aix-en-Provence cedex 4 – France. Abstract
With respect to others European oceanic facades, the Holocene relative sea-level (RSL) changes along the French Atlantic coasts have received relatively little attention. Even if it received some attention for geophysical modelling (Van de Plassche, 1991; Lambeck, 1997; Leorri et al., 2012), only two field-based studies really dealt with this subject in Western Brittany, agreeing on an oscillatory RSL pat-tern with a conspicuous pluri-metre negative variation occurring around 3000 BP (Morzadec-Kerfourn, 1974; Stephan, 2011). This paper is the first step on the way to update Western Brittany Holocene RSL data. It presents a new long-term Holocene RSL recon-struction based on basal peat deposits, compaction-free deposits that have been accumulated on top of the Pleistocene formations dur-ing the early-Holocene stages of the post-glacial transgression. Data used for the sea-level reconstruction are both new data and previ-ously published datasets we have reassessed. New cores, extracted along the Finistère peninsula in the framework of a coastal risk as-sessment research program, allowed us to collect new stratigraphic data. Dates initially published on basal peat deposits in previous studies (Morzadec-Kerfourn, 1974) were re-assessed through the same process to allow their incorporation in a combined dataset. In the absence of microfossils in most of our deposits, an alternate approach was used to determine the salinity regime of the basal peat deposit environments through the use of stable carbon isotope ratios and the observation of macro-botanical remains: brackish peat de-posits were used as sea-level index points, while freshwater ones provided only high-limiting constraints. Eight new radiocarbon dat-ings were obtained. A total of six new sea-level index-points and six new limiting points allowed us to derivate the long-term (millen-nial) changes in RSL in Western Brittany. A comparison of these data with some foraminifera-based regional RSL data shows that both data sets closely match. Altogether, the combined data show the RSL bending ca. 7000 and 3000 cal. BP, indicating progressively de-creasing rising rates. Further work is needed to fill the centennial to pluri-centennial gaps that remain to ascertain potential periods of stability or strong decrease in the rising rates of the RSL ca. 6200 ± 500 and 3000 ± 500 BP.
Key words: Holocene, RSL, basal peats, Brittany, stable C isotopes.
Résumé
En comparaison des autres façades océaniques européennes ayant déjà fait l’objet de nombreux travaux sur le niveau marin relatif holo-cène, les côtes atlantiques françaises demeurent quelques peu ignorées. Malgré quelques travaux de modélisation géophysique ayant intégré (entre autres) l’ouest de la Bretagne (Van de Plassche, 1991 ; Lambeck, 1997 ; Leorri et al., 2012), seules deux études, se basant sur des données de terrain, se sont véritablement intéressées au sujet (Morzadec-Kerfourn, 1974 ; Stephan, 2011). Celles-ci s’accordent sur un niveau marin relatif connaissant des oscillations au cours de l’Holocène, la plus importante devant se situer autour de 3000 BP. Cet article présente la première étape d’un travail de remise à jour des données disponibles sur le niveau marin relatif holocène dans l’ouest de la Bretagne. Les tourbes de base sont des dépôts considérés comme incompressibles (car formés soit au-dessus des formations limono-graveleuses pléistocènes ou directement sur le substrat géologique) qui représentent les premières phases de la transgression post-glaciaire. Leur utilisation nous a permis de reconstituer l’évolution à long-terme du niveau marin relatif dans la région. Les données
mobilisées pour ce travail proviennent à la fois de nouvelles datations et de la recalibration de données précédemment publiées. Les nou-velles dates ont été obtenues à partir de carottages réalisés sur plusieurs sites autour de la pointe finistérienne, dans le cadre de l’ANR COCORISCO (Historique de la tempétuosité holocène pour l’étude des risques côtiers). En l’absence d’indicateurs micro-faunistiques dans la plupart des dépôts prélevés, les conditions de salinité du milieu de sédimentation originel ont été déterminées par l’utilisation de mesures des isotopes stables du carbone (δ13C) et par la détermination des macro-restes végétaux. Les tourbes de base, considérées comme s’étant formées en milieu saumâtre, ont été utilisées comme « points-index » du niveau marin tandis que celles relevant d’un milieu d’eau douce ont été utilisées comme points limitants. Huit nouvelles datations radiocarbone ont été obtenues. Un total de six nouveaux points-index et six points limitants a permis de reconstituer les évolutions à long-terme du niveau marin relatif dans l’ouest de la Bretagne. Les résultats ont été comparés avec une reconstitution des variations du niveau marin dans la région effectuée à partir de l’étude des forami-nifères. L’ensemble montre une très bonne cohérence et indique que le niveau marin relatif a connu des ralentissements de son rythme de remontée autour de 7000 et 3000 cal. BP. Des travaux supplémentaires demeurent néanmoins nécessaires dans la mesure où des doutes persistent dans les périodes autour de 6200 ± 500 et 3000 ± 500 cal. BP.
Mots clés : Holocène, niveau marin relatif, tourbes de base, Bretagne, isotopes stables du carbone.
Version abrégée en français
Utilisés dans des domaines variés, les études portant sur la reconstitution du niveau marin relatif (NMR) holocène ont connu un regain d’intérêt au cours des dernières années (Leorri et al., 2012), que ce soit pour la prédiction des futurs changements du niveau marin dans une optique de maîtrise des risques côtiers qu’en tant que jalon pour la calibration des modèles géophysiques. Les variations du NMR résultent d’un processus complexe, déterminées par une combinaison de fac-teurs variables dans le temps et l’espace. Bien qu’en premier lieu déterminée par le niveau marin « eustatique », découlant de la fonte des inlandsis continentaux après le Dernier maxi-mum glaciaire (DMG), l’histoire du niveau marin relatif d’une région est aussi le produit de facteurs plus locaux (Shennan et
al., 2012) ayant dicté le comportement vertical de la zone
d’étude durant l’Holocène (isostasie et tectonique). Les pro-cessus qui déterminent la qualité de l’enregistrement du NMR dans les séquences sédimentaires, tels que la compaction, les modifications éventuelles des régimes tidaux au cours de la période d’étude, les phénomènes d’érosion et/ou de troncatu-re des dépôts, jouent aussi un rôle majeur dans ces troncatu- reconstitu-tions. Considérés comme des facteurs clés nécessaires pour comprendre comment les systèmes sédimentaires côtiers ont autrefois réagi face aux changements de NMR, ces derniers ont fait l’objet de nombreux travaux récents (Shennan et Hor-ton, 2002 ; Edwards, 2006 ; Long et al., 2006 ; Massey et al., 2006b ; Behre, 2007 ; Vink et al., 2007 ; Horton et Shennan, 2009 ; Bungenstock et Weerts, 2010 ; Baeteman et al., 2011 ; Brain et al., 2011). Si les côtes du nord-ouest de l’Europe ont fait l’objet de nombreuses études portant sur le NMR holocè-ne, la façade atlantique française souffre quelque peu d’un manque d’attention. Dans le Finistère, seules deux études se sont réellement attardées sur le sujet (Morzadec-Kerfourn, 1974 ; Stephan, 2011). Celles-ci font état d’un NMR oscillant, notamment autour de 3000 BP où une baisse pluri-métrique du NMR est constatée par les auteurs. Cette période a été identifiée à l’échelle du nord-ouest de l’Europe comme une pé-riode de détérioration du climat (tempétuosité accrue, hiatus importants au sein des séquences sédimentaires ; e.g., Lamb, 1977 ; Long et Hughes, 1995 ; Van Geel et al., 1996 ; Moura
et al., 2007), posant ainsi la question de l’authenticité de
l’épi-sode régressif observé.
Dans le cadre d’un programme de recherche portant sur les risques côtiers (ANR COCORISCO), un important tra-vail de terrain a été mené au cours des trois dernières années autour de la péninsule finistérienne. Des dizaines de carottes ont été prélevées avec pour objectif principal l’étude des ef-fets de la paléo-tempétuosité holocène. Par ailleurs, ces don-nées ont pu être utilisées à des fins de reconstitution du NMR, permettant ainsi de densifier de manière significative les don-nées déjà disponibles sur la région. La Bretagne est un do-maine géologique n’ayant pas été directement concerné par les glaciations du DMG. Néanmoins, plusieurs études mettent en lumière le fait que cette région a pu être concernée par le dégonflement du rebond isostatique post-glaciaire lié à la fonte des calottes britanniques et scandinaves (Lambeck, 1997 ; Massey et al., 2008 ; Bradley et al., 2011 ; Leorri et al., 2012 ; Shennan et al., 2012). L’importance de la tempétuosi-té dans cette région ainsi que les marnages importants com-plexifient quelque peu la reconstitution des NMR passés. Les carottes ont été collectées en utilisant un carottier à percus-sion, une tarière à vis (instrumentation BRGM) ou une ta-rière manuelle. Leurs positions ont été relevées au GPS dif-férentiel et raccordées au système NGF. Les dépôts ont été datés par le radiocarbone (AMS). La moitié des datations a été réalisée sur l’ensemble du sédiment. Pour l’autre moitié, l’échantillonnage s’est attaché à réduire au maximum les possibilités de pollution potentiellement induites par les ap-ports de carbone allochtone, en sélectionnant des fragments végétaux à plus faible potentiel de resédimentation (Gehrels
et al., 1996 ; Törnqvist et al., 1998 ; Gehrels, 1999). Les
iso-topes stables du carbone ont été mesurés en routine lors des mesures du 14C. Toutes les dates sont présentées calibrées avec un intervalle de probabilité de 95 % (2 σ).
Une approche reposant sur les tourbes de base a été utili-sée au travers de cette étude, afin de reconstituer une enve-loppe générale des variations du NMR (de l’ordre du millé-naire ; Gehrels, 1999). Comme l’ont prouvé un grand nombre de travaux tant sur les côtes européennes (Jelgersma, 1961 ; Van de Plassche, 1982 ; Törnqvist, 1993 ; Denys et Baete-man, 1995 ; Van de Plassche, 1995 ; Beets et Van Der Spek, 2000 ; Shennan et Horton, 2002 ; Makaske et al., 2003 ; Be-rendsen et al., 2007) que sur d’autres façades océaniques (e.g., Redfield et Rubin, 1962 ; Pirazzoli et Pluet, 1991 ; Gehrels et Belknap, 1993 ; Gehrels et al., 1996 ; Long et al., 1998 ;
Törn-qvist et al., 2004, 2006), il est maintenant largement accepté que ce type de dépôt représente un témoin particulièrement adapté pour la reconstitution du NMR holocène sur les litto-raux de submersion (zones subsidentes). Les tourbes de base ont donc été utilisées comme indicateurs du NMR passé de la manière suivante : lorsque des indices ont permis d’identifier une influence marine à saumâtre dans les dépôts, il a été alors possible de leur appliquer un « indicative meaning », c’est-à-dire une relation altitudinale reliant leur milieu de sédimenta-tion au niveau de la mer au moment du dépôt (Shennan, 1986 ; Van de Plassche, 1986 ; Gehrels et al., 1996). Celui-ci a été fixé entre les plus hautes mers astronomiques et les pleines-mers de morte-eau, avec une erreur (nommée « indicative
range » ; Gehrels et al., 1996) fixée à la moitié de ce rapport.
Au contraire, lorsqu’aucun indice n’a permis de déceler une quelconque influence marine, il n’a pas été possible de déter-miner l’altitude à laquelle s’est formé le dépôt par rapport au niveau marin. Dans ce cas, l’altitude du dépôt a servi à fixer une limite supérieure maximale (« high limiting deposits » ou HL) au niveau marin de l’époque.
Du fait de la très faible présence, voire la totale absence de proxys micro-faunistiques dans les dépôts, la détermina-tion du régime de salinité de l’environnement originel de for-mation des niveaux datés s’est effectuée via l’utilisation conjointe de plusieurs indicateurs. Ceux-ci ont livré notam-ment des informations sur les formations végétales établies au moment de la mise en place du dépôt. Les isotopes stables du carbone (13C/12C) ont été utilisés sous la forme d’un indi-cateur nommé « δ13C ». Celui-ci permet de distinguer entre différentes catégories de plantes suivant le type de photosyn-thèse (C3ou C4) qu’elles effectuent. Par exemple, les valeurs du δ13C dans un environnement de slikke sont bien plus éle-vées que celles obtenues au sein d’une roselière à phrag-mites. Si cela permet parfois de distinguer clairement des dé-pôts saumâtres, le plus souvent, le recouvrement des valeurs du δ13C fait que cet indicateur doit être utilisé en association avec d’autres. Quelques fois, l’identification des macro-restes végétaux a pu fournir des informations utiles. Les don-nées de M.-T. Morzadec-Kerfourn (1974) ont été actualisées et utilisées de la même façon que nos propres données. Seules les tourbes identifiées comme basales ont été conser-vées. La détermination de l’environnement original de dépôt des tourbes de base décrites par cet auteur s’est fait sur la base des informations palynologiques telles que présentées dans le manuscrit original. Des marges d’erreurs ont été ajoutées aux données originales (± 50 cm pour le position-nement vertical du dépôt, recalibration des dates selon le standard utilisé pour nos propres datations).
Six points index et six points limitants ont permis d’obtenir les tendances à long-terme (millénaire) d’évolution du NMR dans le Finistère entre ~ 7500 et 4000 cal. BP. Une remontée globale du NMR de 9,5 ± 0,5 m est observée depuis 7500 cal. BP. La vitesse de relèvement semble s’infléchir aux environs de 7000 cal. BP, suivant un rythme d’environ 1,3 mm/a jusqu’à ~ 4500 cal. BP. La période entre 6500 et 5000 cal. BP demeu-re mal définie, aucune tourbe de base n’ayant été obtenue pour cette période. De la même façon, aucun point n’a pu être obtenu après 4500 cal. BP avec cette méthode. Nos données
montrent une très bonne cohérence avec les données obtenues par P. Stephan (2011) en rade de Brest à partir de l’étude des foraminifères, à l’exception d’un point bas identifié par cet au-teur autour de 2800 BP. Ce point fut obtenu à partir d’un dépôt potentiellement issu d’un épisode morphogène ayant pu artificiellement abaisser le niveau de sédimentation (e.g., re-prise de sédimentation après un épisode érosif). Nous avons donc considéré que ce point n’était pas représentatif du NMR de l’époque. L’ensemble des données disponibles, toutes marges d’erreur prises en compte, permet de dresser des tendances claires d’évolution du NMR pour les périodes entre 7500-7000 cal. BP et 7000-3000 cal. BP, avec des taux de remontée respectivement autour de 8 mm/a et 1,4 mm/a. Après 3400 cal. BP, les données de P. Stephan (2011) permet-tent d’évaluer le taux moyen de remontée à ~ 0,3 mm/a. Ces valeurs ne doivent être prises qu’à titre indicatif, des doutes demeurant autour de 6000 et 3000 cal. BP. En effet, à l’heure actuelle, il n’est pas possible d’affirmer que le NMR n’a pas connu des périodes de remontée très lente, voire de stabilisa-tion entre les phases de transgression bien marquées. Ces pé-riodes de fléchissement du rythme de remontée du NMR ont probablement eu des effets importants sur le fonctionnement des systèmes lagunaires et des marais d’arrière-cordon à par-tir desquels nos données ont été obtenues. Ainsi, nous suspec-tons que des problèmes de datation, liés par exemple à des re-maniements, ont pu venir complexifier la reconstitution du NMR à ces périodes avec ce type de données. Les travaux sont en cours afin d’apporter des données supplémentaires qui per-mettront sans doute d’arriver à une reconstitution fiable du NMR holocène pour l’ouest de la Bretagne.
Introduction
Recent years have seen a revival of interest in the use of relative sea-level (RSL) curves for a wide range of applica-tions (Leorri et al., 2012) from the prediction of future sea-level changes in coastal risk assessment issues to the fine-tuning of geophysical Earth rheology models. The be-haviour of coastal systems in reaction to Holocene sea-level rise is a complex process. To derive RSL (taken here as the relative altitude of past sea-level relative to a present refer-ence level) changes from observations is hrefer-ence a complex challenge. Though primarily determined by eustasy, RSL changes result from the combination of many interdepen-dent processes. As clearly stated by I. Shennan et al. (2012), sea-level changes for a precise geographical location and epoch result from the sum of the following factors: (A) Eu-static sea-level, which varies in time following the melting history of ice-caps (“ice-equivalent” eustasy), changes in the ocean-basin volume (“tectono-eustasy”), and changes in the ocean mass-water distribution. (B) Isostatic processes affecting the vertical behaviour of the lithosphere during the post-glacial period of study, dependent on the geographical position relative to the past extension of ice-caps (glacio-isostasy) and of the loading by the water-charge (hydro-isostasy) during transgression. The sum of (A) and (B) pro-duces the global trend in the RSL rise. Along with those major factors must be added: (C) Tectonic activity expressed
by vertical displacements that could have occurred during the considered period. These latter displacements can explain rapid jumps in the RSL signal and must be looked for in re-gions known as tectonically active during the Holocene (Fouache, 2006; Morhange et al., 2006; Gandouin et al., 2007). In addition to these factors are superimposed more local effects, which bear direct consequences on the way the sedimentary sequences record the RSL changes: (D) Local effects are likely to control the sedimentary record and, as a consequence, the preservation and the present-day restitu-tion of Holocene RSL. In fact, locally, sedimentary sequences undergo syn- and/or post-deposit processes: major local ef-fects are traditionally considered as being the compaction of the deposits (effect of post-depositional consolidation), lower-ing the original altitude of a considered unit, and thus the RSL corresponding points), and the changes in tidal regime (lead-ing to an alteration of the sea-level indicative mean(lead-ing, which is derived from the present day tidal regimes). (E) Finally, I. Shennan et al. (2012) consider an additional factor re-grouping other unspecified, random and hard-to-quantify factors influencing the RSL reconstruction at a given site. We propose here that erosion truncations of sedimentary se-quences must be considered as one of the major components of this additional factor of the RSL equation, considering the importance of its probable impacts on both the indicative meaning of the studied sedimentary sequences and on the compaction processes. Several recent works have attempted to sort out the relative importance and the timing of local pa-rameters (D) and (E), considering them as keys to a better understanding of the response of coastal systems to past sea-level rises (Shennan and Horton, 2002; Edwards, 2006; Long et al., 2006; Massey et al., 2006b; Behre, 2007; Vink
et al., 2007; Horton and Shennan, 2009; Bungenstock and
Weerts, 2010; Baeteman et al., 2011; Brain et al., 2011). Northwestern European coasts have been the subject of sev-eral works dealing with Holocene RSL variations (e.g., among many others: Fairbridge, 1961; Ters, 1973; Morzadec-Ker-fourn, 1974; Ters, 1986; Van de Plassche, 1991; Denys and Baeteman, 1995; Long et al., 1996; Lambeck, 1997; Shennan and Horton, 2002; Massey et al., 2006a; Edwards and Hor-ton, 2007; Massey et al., 2008; Bungenstock and Schäfer, 2009; Stephan, 2011; Leorri et al., 2012). In comparison with British coasts, French Western Atlantic and Channel coasts have been the subjects of fewer studies (Delibrias and Guillier, 1971; Ters, 1973; Morzadec-Kerfourn, 1974; Van de Plassche, 1991; Morzadec-Kerfourn, 1995; Lambeck, 1997; Clavé et al., 2001; Stephan, 2011; Leorri et al., 2012). In the Finistère region, only two authors really focused on this subject (Morzadec-Kerfourn, 1974, 1995; Stephan, 2011). Both authors proposed that plurimetric oscillations in RSL curves could have taken place ca. 3000 cal. BP. How-ever, these works were conducted in two areas of relatively limited extension and produced curves based on a limited number of sea-level index points (a total of around fifteen dates for each of the two studies). Such limitations make inter-comparisons between sites difficult and hence can im-pair the deciphering of local processes in the RSL signal. Fi-nally, the period ca. 3000 cal. BP was generally identified
around northwestern European coasts as a period of in-creased storminess, which has caused strong perturbations and large hiatuses in the sedimentary sequences (Lamb, 1977; Long and Hughes, 1995; Van Geel et al., 1996; Moura
et al., 2007). Hence, we consider that obtaining a reliable
and high-frequency sea-level curve for Western-Brittany is of prime interest, as it will contribute both to the under-standing of the coastal processes, which may be the conse-quences of the sea-level variations and, at a broader scale, the comprehension of post-glacial isostatic history of North-Western Europe.
Within the framework of a coastal risk assessment research program (ANR COCORISCO, French National Research Agency), an extensive fieldwork has been conducted during the last three years all around the Finistère peninsula (West-ern part of Brittany, France). Tens of cores and drillings have been carried out in sites of various sedimentary envi-ronments and expositions. Whilst the principal objective of this fieldwork was to obtain data that would allow the study of the palaeostorminess during the Holocene, the sampled sedimentary sequences could also be fruitfully interpreted to derive RSL data. This allowed us to densify significantly the Holocene RSL data available for this region and also to re-assess and update the results of M.-T. Morzadec-Kerfourn (1974) and P. Stephan (2011). This paper is the first step of an effort in updating Western Brittany RSL data. The first part will briefly outline the geological context of the study area, considering possible internal geodynamic controls on vertical crustal movements that could have occurred during the period of investigation. The methodology we used to reconstruct RSL changes will be described in a second part, with particular attention paid to possible errors that may occur at various stages of the reconstruction process. In order to allow comparisons between previously published interpretations and our own results, derived from an extend-ed new data set, the same methodology has been appliextend-ed to both to new and previously published data. Finally, the ongoing need for a better deciphering of both local and regional effects for the fine-tuning of the Holocene RSL his-tory is exemplified and the possible behaviour of coastal systems in reaction to the proposed Holocene RSL rise is briefly evaluated.
The study area
This paper presents new stratigraphic data and RSL data collected along the coast of the Finistère peninsula (Western Brittany, France). As stated above, the rationale for the choice of site locations primarily resulted from the objectives of the COCORISCO program, which privileged sites showing very different exposures to major forcing agents (large tidal ranges, storms swells), resulting in diverse sedimentation conditions (in terms of sediment supply, accumulation and preservation). This largely explains why the selected sites are not always the most favourable to derive a long and continuous RSL signal. Nevertheless, we believe that these widespread and diverse site locations and types can be profitable to improve the re-gional representation of reconstructed RSL. Moreover, such
a choice of the sites may, to a certain extent, avoid peculiar RSL biases that could result from working on a too local and geographically restricted dataset. New stratigraphic data were collected on eight sites distributed all along the Finistère peninsula: Kerlouan-Guissény and Landeda in the North Fin-istère, Porsmilin in the central part of the peninsula, and Tref-fiagat, Kermor-Tudy and Guidel in the southern part (fig. 1).
Geological and geodynamic setting
Geological and geodynamic factors, which control the possible vertical movements of any particular crustal area, are of prime importance in RSL reconstitutions and can be considered as the primary producers of RSL histories. They can be divided as follows: (i) Long-term geological evolu-tions, typically spanning over tens of thousands to millions years, (ii) Holocene glacio- and hydro-isostatic processes (from a few hundreds to a few thousands of years), and (iii) short-term tectonic events (a few days). As geological pro-cesses are concerned, the following will be considered as the basis of this study and be used for the comparison of our data with southern-UK works. On a long timescale, Brittany is considered to subside step-wise since the opening of the Bay of Biscay during Early Cretaceous (Evans, 1990), as a passive margin and as a flank of the Western Channel graben. Globally, long-term subsidence has been evaluated between 0.02 mm/a and 0.04 mm/a since the Eocene for the northern coasts and western/southern coasts of Brittany, respectively (Bonnet et al., 2000). The regional subsidence can be consid-ered as negligible at the timescale of the Holocene (~ 40 mm for the last 10,000 years), with respect to the amplitude of the RSL changes we consider.
As underlined in the introduction, estimations of the ampli-tude of potential isostatic adjustments undergone by Western Brittany, as a consequence of the melting of the North-western Europe and North hemisphere ice caps still lack precision,
awaiting specific numerical studies and geophysical models, well-constrained by local high-quality and dense RSL infor-mation. During the Last Glacial Maximum, Brittany occu-pied a peripheral position with respect to the British Ice Sheet (BIS). The maximum extent of the BIS reached the Scillies (Scourse et al., 1990; Scourse 1991) and had already retracted before 17 ka as evidenced from the dating of loess along the coasts of Wales (Wintle, 1981). Recent studies, con-ducted in South-Western UK (Massey et al., 2008; Bradley et
al., 2011; Shennan et al., 2012), consider that this latter region
must have been under the joint influence of both the BIS forebulge and long wavelength isostatic responses related to Fennoscandia ice-sheet. E. Leorri et al. (2012) performed modelling work from RSL datasets around the Bay of Bis-cay and conclude that a north-south increasing RSL gradient exists between Brittany and Portugal. As primarily proposed by K. Lambeck (1997), this would confirm that vertical land-motions induced by the subsidence of a peripheral bulge, as-sociated to the melting of Eurasian Ice-Sheets, have had (and maybe still have) noticeable effects at least as far south as the southern Bay of Biscay. While both (i) the position, size and migration timing of the forebulge apex remain uncertain and (ii) the role of the deep faults bordering the Channel and Western Approaches domains during the Holocene is still questionable, it appears that Brittany could have also been concerned by such glacio-isostatic vertical move-ments. Nonetheless, modelling work performed by E. Leor-ri et al. (2012) has to be taken with caution as BLeor-rittany RSL reconstruction on which are based these modelling are rather old and did not received proper error re-assessment. Fur-thermore, this study got RSL data from different regions confusedly mixed up from their original locations. In fact, a careful inspection of the datasets reveals that a site named
Fig. 1 – Location maps of the
study area. Numbers refer to
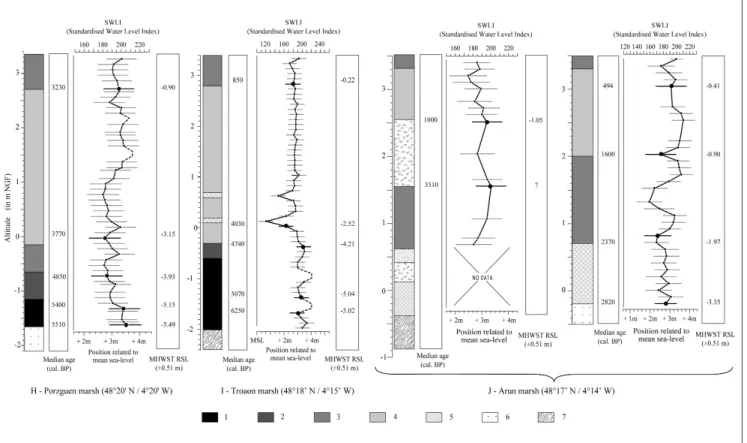
sites presented in the text. 1: Ker-louan-Guissény; 2: Landeda-Ta-riec; 3: Porsmilin; 4: Treffiagat; 5: Kermor-Tudy; 6 : Guidel. Letters A to D refer to sites from which se-dimentary sequences were re-as-sessed from M.-T. Morzadec-Ker-fourn (1974). A: Plouescat-Pors-guen. B: Ploudalmezeau-Treom-pan. C: Argenton. D: Trézien. Let-ters H to J refer to sites studied by P. Stephan (2011) in the Bay of Brest. H: Porzguen marsh. I: Troaon marsh. J: Arun marsh.
Fig. 1 – Cartes de localisation de la zone dʼétude. La numérotation renvoie aux sites tels que présentés dans le texte. 1 : Kerlouan- Guissény ; 2 : Lan-deda-Tariec ; 3 : Porsmilin ; 4 : Treffiagat ; 5 : Kermor-Tudy ; 6 : Guidel. Les lettres A à D désignent les sites pour lesquels les séquences étudiées par M.-T. Morzadec-Kerfourn (1974) ont été réactualisées. A : Plouescat-Porsguen ; B : Ploudalmezeau-Treompan ; C : Argenton ; D : Trézien. Les lettres H à J désignent les sites étudiés en rade de Brest par P. Stephan (2011). H : Ma-rais de Porsguen. I : MaMa-rais de Troaon. J : MaMa-rais dʼArun.
no. Location Latitude Longitude Tidal range (in m) HAT (in m NGF) MHWST (in m NGF) MHWNT (in m NGF) MTL (in m NGF) MLWST (in m NGF) A Plouescat 48°39' N 4°12' W 7.43 5.10 4.26 2.49 0.67 -3.17 1 Guisseny 48°38'14 N 4°23'56 W 7.52 4.74 4.06 2.36 0.62 -3.46 2 Landeda-Tariec 48°36'10 N 4°36'30 W 6.75 4.57 3.78 2.13 0.46 -2.97 B Ploudal.-Treompan 48°34' N 4°40' W 6.6 4.54 3.69 2.11 0.46 -2.91 C Argenton 48°31' N 4°45' W 6.47 4.48 3.68 2.08 0.47 -2.79 D Trezien 48°25' N 4°47' W 6.08 4.32 3.51 1.96 0.48 -2.57 3 Porsmilin 48°21'19 N 4°40'49 W 5.55 3.99 3.17 1.67 0.39 -2.38 4 Treffiagat 47°47'29 N 4°15'54 W 4.20 3.16 2.66 1.56 0.50 -1.54 5 Kermor-Tudy 47°51'54 N 4°07'37 W 4.20 3.09 2.45 1.35 0.41 -1.75 6 Guidel 47°45'44 N 3°30'10 W 4.15 2.78 2.23 1.18 0.17 -1.92
Tab. 1 – Present-day tidal ranges on studied sites. HAT (Highest Astronomical Tide), MHWST (Mean High Water Spring Tides), MHWNT (Mean High Water Neap Tides), MTL (Mean Tide Level), MLWST (Mean Low Water Spring Tides). Letters and Numbers in the first column refer to fig. 1.
Tab. 1 – Marnages actuels sur les sites dʼétude. HAT (plus hautes mers astronomiques), MHWST (pleines mers de vive-eau moyenne), MHWNT (pleines mers de morte-eau moyenne), MTL (marée moyenne), MLWST (basses mers de vive-eau). Les lettres et numéros figu-rant dans la première colonne renvoient aux sites tels que présentés dans la fig. 1.
“Saint-Marc” is taken by the authors to be in south-Brittany, while original data from M. Ters (1973) mention “Côtes-du-Nord” which is situated in north-Brittany. Hence, in absence of more precise work regarding this problem, the question of the Holocene vertical behaviour of the Brittany region to-wards the glacio-isostatic effects remains suspended.
The hydro-isostatic vertical movement induced by the load-ing of the Atlantic continental shelf and the Channel platform during the Holocene transgression can be considered as of comparable amplitude between South-Western UK and Brit-tany, considering the similar ages and, therefore, the compa-rable rigidities of the crust of the two regions. Finally, neo-tectonics is generally considered to have been inactive in Brit-tany over the study period.
Morphodynamic setting
Due to the direct opening of the region towards the At-lantic Ocean, the Finistère peninsula is the part of Brittany most exposed to dominant storm winds and swells. These exposure conditions result in (i) a majority of sand-domi-nated sedimentary environments and (ii) a rather limited num-ber of protected low-energy environments susceptible to have recorded continuously the RSL history. As revealed by the several erosion surfaces observed within our sequences, im-pacts of storminess during the Holocene have heavily dis-turbed and discontinued mid- to late-Holocene sedimentary sequences along the Finistère coasts. As this study principal-ly focuses on basal deposits, this will not bear consequences on the results presented in this paper. The possible role played by storminess and sedimentary hiatuses will be dis-cussed when comparing our results to other studies, which use non-basal deposits to derive RSLs.
Tidal setting
Tidal settings are of major importance in RSL studies. In fact, most RSL reconstructions are based on the study of the altitudinal zonation of intertidal indicators (whether biolog-ical or sedimentologbiolog-ical) with respect to a reference tidal level (such as the Mean High Water Spring Tide, MHWST, or the Mean Sea Level, MSL). Hence, by determining the vertical range in which an indicator could have been em-placed (the “indicative range”), the tidal range of a studied site will partially determinate the accuracy of past RSLs. While micro-tidal regions, such as the Mediterranean Sea, allow well-constrained and precise indicative ranges (pluri-centimetres to decimetre scale), macro-tidal conditions, such as the ones encountered along the coast of Brittany, can intro-duce larger errors in RSL reconstitutions (pluri-decimetres to metre-scale error terms). Moreover, potential changes in the tidal ranges during the Holocene could have resulted in sup-plementary errors in past RSL reconstitutions, by over- or under- estimating the indicative meaning. Indeed, as stated by W.R. Gehrels et al. (1995), many RSL studies are based on high-tide indicators. Thus, changes in tidal ranges through time may cause the reconstructed RSL curve to differ from the “true” MSL curve (as termed in Gehrels, 1999). The Fin-istère peninsula is concerned by macro- to meso-tidal condi-tions, with tidal ranges globally decreasing from north to south (tab. 1). Variability in the tidal ranges between the dif-ferent study sites will be taken into account in the determi-nation of the indicative ranges error terms (see methodolo-gy). Evaluation of possible changes in the tidal ranges and regimes during the study period is beyond the scope of this paper. Possible implications of these changes will be discussed in the quantification of the RSL reconstruction error-terms.
RSL reconstruction from Holocene
basal deposits: Methodological
background
Sea-level index points
RSL reconstitutions generally rely on the acquisition of Sea-Level Index Points (SLIPs), or Sea-level Indexes (SLIs), which characterise the altitudinal position of a cho-sen tide level (e.g., the Mean High Water Spring Tide, which will be the reference throughout this work) relative to its modern altitude, considered as the zero reference level. As stated by W.R. Gehrels (1999), the vertical determination of a SLIP at time (t) can be expressed as:
SLIP (t) = H – D – I (t) + T (t) - L+ A (t) (1) where H is the height of the coring station from which the in-dicator sample is taken relative to the modern tidal altitudinal reference, D is the depth of the sample in the core, I(t) is the “indicative meaning”, i.e. the relation between the altitude of the original deposition environment of a given sample and the palaeo-tidal reference level (e.g., MHWST) at the time of de-position (Shennan, 1986; Van de Plassche, 1986; Gehrels et
al., 1996), T(t) represents the potential changes in tidal
ampli-tude between time (t) and present, L stands for the compaction induced by the coring-process as evaluated in the field and A(t) is the auto-compaction undergone by the sample after de-position. If an “indicative meaning” cannot be properly as-sessed for a deposit, then a status of “limiting point” is gener-ally attributed to the sample. Limiting points can help to con-straint former RSL positions, and are defined as follow: “High-Limiting” (HL) or “Low-Limiting” (LL) whether the deposit is identified to have formed at an unquantified altitude above or below the reference tidal level, respectively. To reach some reliability and precision, RSL reconstructions must rely on a combination of methods, as no single method is consid-ered to be unequivocal. The methods used in this study, or in re-assessed previous works, are detailed below in some details. For a general view on RSL reconstruction methods, readers can refer to I. Shennan (2007), R.J. Edwards (2007), and to the publications of the UNESCO-IGCP projects (e.g., projects no. 61, 274, 588).
Holocene basal peats
Basal peats have been extensively used in Holocene sea-level studies, especially in northwestern Europe (e.g., Jelgers-ma, 1961; Van de Plassche, 1982; Törnqvist, 1993; Denys and Baeteman, 1995; Van de Plassche, 1995; Beets and Van Der Spek, 2000; Shennan et al., 2000; Shennan and Horton, 2002; Makaske et al., 2003; Berendsen et al., 2007), and also along other oceanic facades (e.g., Redfield and Rubin, 1962; Pirazzoli and Pluet, 1991; Gehrels and Belknap, 1993; Gehrels et al., 1996; Long et al., 1998; Törnqvist et al., 2004, 2006). As underlined by T.E. Törnqvist et al. (2004), this approach is particularly suitable for reconstructing RSL history along submerging coastlines and has widely proven its accuracy to provide consistent RSL records. Indeed, the submergence of the Pleistocene glacial plains by the coastal
Ground Water Level (GWL) wedge during post LGM sea-level rise provoked a decrease of the drainage and subse-quently the formation of freshwater to brackish marsh en-vironments belts enen-vironments, in which peat accumulated (Baeteman et al., 1999; Vink et al., 2007). A landward and upward progression of the peat layers marks the emplace-ment of the rising water level. Moreover, basal peats direct-ly overlay the geological substrate or, more often, Pleistocene silty-loess of fluvial deposits, traditionally considered as hav-ing experienced negligible compaction durhav-ing the Holocene. The altitude of the basal peats hence can be used as a reliable marker of RSL rise.
Nonetheless, the representativeness of basal peats as RSL indicators has been regularly discussed. Several limitation problems have been identified in their use as sea-level indi-cators. The unclear relations between the GWL and sea level may cause errors in RSL reconstructions. As identified by O. Van de Plassche (1982, 1995), distortions of the tidal wave in large deltaic plain environments (“flood-basin ef-fect”) or in estuarine settings (Fairbridge, 1961; Vink et al., 2007), can lead to under- or over-estimation of the RSL. The importance of local continental hydrological and drainage conditions can also be invoked. In order to avoid these er-rors, some authors recommended that only basal peats should be used as an upper RSL limit (Edwards, 2007; Vink et al., 2007). Others (Gehrels et al., 1996; Gehrels, 1999; Törnqvist
et al., 2004) advocated that basal peats remain usable as
SLIPs if a clear relationship between their original deposit en-vironment and sea level can be established (i.e., from the pres-ence of indicators undoubtedly attesting that peat formed in an environment submitted to brackish to saline conditions). Only in this case, basal peats can be considered to have formed be-tween MSL and HWST and can be used as SLIPs (Van de Plassche, 1982; Törnqvist et al., 2004).
The salinity regime of the original deposit environments can be assessed by several methods. Microfossils, such as di-atoms or foraminifera, are considered to be the most reliable method available to achieve such an aim. When present, mi-crofossils attest at least a minimal influence of marine condi-tions (Gehrels, 1999). The importance of this influence can be deduced by the determination of species assemblages. Unfor-tunately, foraminifera were absent or very scarce in the sam-ples we studied, probably due to their limited potential of conservation or to unfavourable living conditions (sand domi-nated deposits). Micro- and macro-faunal indicators can also provide useful information. Plant communities obey a vertical zonation with respect to ecological factors (among which the frequency of inundation is dominant) and thus can be used as indicators to determine the salinity regimes. Pollen assem-blages have been widely used in Holocene palaeo-environ-mental studies, as a proxy for reconstructing past landscapes and anthropogenic activity. It also revealed capacities to deci-pher between different sedimentary environments, especially in intertidal mud-dominated environments (such as mudflats and salt-marshes), where strong environmental gradients exist. Transitions between marine and freshwater dominated envi-ronments can be identified following the succession of dom-inating plant species.
Stable carbon isotope ratios (13C/12C) have been less often
used to recognise salt-marsh environments within organic sedimentary sequences (Chmura and Aharon, 1995; Gehrels
et al., 1996; Törnqvist et al., 2004; Wilson et al., 2005;
Lamb et al., 2006, 2007; Kemp et al., 2010). The stable car-bon isotope ratio 13C/12C is noted δ13C, and expressed in
parts per thousand PDB (‰ PDB) relative to the reference
13C value (standard determined from a Cretaceous marine
fossil named Pee Dee Belemnite, “PDB”). Mudflat/low-marsh and high-Mudflat/low-marsh/supratidal specific plant species were found to follow different photosynthetic pathways (termed “C3” and “C4”), inducing very different δ13C imprints in the
surface sediment on which those latter grow. Unfortunately, values in δ13C sometimes largely overlap and therefore
pre-clude using δ13C directly as a ‘true’ RSL proxy (Wilson et al., 2005). This ratio has nevertheless proved its ability to
clearly decipher between low-marsh and high-marsh envi-ronments. Thus, the δ13C stable carbon isotope ratio can
help to provide qualitative data about the depositional envi-ronment of radiocarbon-dated samples (Wilson et al., 2005; Lamb et al., 2006, 2007; Kemp et al., 2010), especially if associated with other indicators (foraminifera, diatoms, C/N ratio). T.E. Törnqvist et al. (2004) used δ13C, together with
the study of plant remains, to determine the salinity regime of basal peats found in the Mississippi delta, and conse-quently to determine if these basal peats could be used as reliable markers of past RSL values. The same approach has been followed in this study.
Methods
Corings and drillings
Field data were collected by three techniques: corings (using an Eijkelkamp 60 mm Ø, hand-held and motor-driv-en percussion corer), screw drillings (using BRGM vehicle, French Research Agency for Geology and Mines) and hand-auguring (3-cm diameter/1-m long Eijkelkamp gouge). Cores positions were surveyed using a Trimble Differential Global Positioning System (DGPS). All locations were tied to geo-referenced IGN (French National Geographic Insti-tute) benchmarks and levelled with
re-spect to the NGF datum (French level-ling datum, tied to the present MSL in Marseille, France). Possible deforma-tions of the sequences during the coring stage (e.g., compaction induced by per-cussion corings) were measured in the field and taken into account in the verti-cal positioning of the samples. Percus-sion cores (recovered in 1-m long plas-tic tubes) were cut in half cylinders and sealed by plastic film. Screw-drillings and auguring samples were kept in sealed plastic bags. All were stored at +4 °C to slow down desiccation and oxida-tion of the deposits.
Deposits were rapidly described by a litho-microstrati-graphic study, in terms of grain size, colour (Munsell color chart), organic content, and characterisation of macrofossils. Particular attention was paid to identify possible reworked levels or erosion surfaces, as these define morphogenic active periods and can give hints on subsequent potential problems in sample dating. Sampling was performed with a 5-cm mean spacing and adapted to the complexity of the sequences. Grain size was measured after destruction of organic material with a solution of hydrogen peroxide in each sample for the <1-mm fraction with the help of a Malvern Mastersizer 2000 laser analyser. The size of the grains coarser than 1 mm was analysed by sieving.
AMS radiocarbon dates were performed at the “Laboratoire
de Mesure du Carbone 14” (Gif-sur-Yvette) and at the Poznan
Radiocarbon Laboratory (Poland). Half of the new dates pre-sented here were dated from bulk deposits (Guisseny cores). Other dated material was sampled with care in order to min-imise sources of carbon pollution: in situ material was always preferred to potentially reworked material, such as charcoals or drifted wood. When present, plant remains were preferred as their fragility reduces the potential of re-deposition (Gehrels
et al., 1996; Törnqvist et al., 1998; Gehrels, 1999). Stable
car-bon isotope (δ13C) was routinely measured for all the samples dated at the Gif-sur-Yvette laboratory. Calibration was performed with the Calib 6.0 software, using IntCal09 calibration curve (Reimer et al., 2009). All dates in this study are presented in calibrated age BP, with a 2-δ (95%) probability confidence interval (tab. 3 and tab. 4).
Stratigraphy
Sampled basal peats, lying at the basis of the Holocene sedimentary sequences we sampled, were generally found lying on a thin Pleistocene silt layer resting either directly on the weathered basement or, more often, on a mixed silt and gravel formation. This layer could either consist of a periglacial loess formation (Monnier, 1973; Hallégouët and Van Vliet, 1986) or of an inter-bedded lacustrine mud layer formed by the hampered drainage during the RSL rise. Those units generally progressively evolve towards an organic rich silt layer, which is interpreted as the response to the
pro-This study Re-assessment of
M.-T. Morzadec-Kerfourn (1974)
Percussion coring Ø Ø
Screw-drilling ± 20 cm Ø
Hand-auguring -2 cm/m depth Ø
Levelling ±2 cm ±50 cm
Present tidal frames ±5 cm when estimated from distant tidal references
Indicative ranges (HAT-MHWNT)/2 (HAT-MHWNT)/2
Tab. 2 – Errors terms used in RSL reconstruction.
gressive flooding of coastal lowlands by the water table, as a primary response to sea-level rise. It generally ends up in a pluri-decametric to 1-m thick brown to black peat bed, often cut at its top by an erosional surface (fig. 2).
Sedimentary palaeoenvironments
determination
The determination of the salinity regime in which basal peats formed is of prime importance. This determination states whether a peat level can be used as a SLIP (this is the case if the peat level formed under saline or brackish influences) or must be only considered as a high-limiting point (if the peat formed in freshwater environments, without any saline influ-ences). In the absence of micro-faunal indicators in our basal deposits, the determination of the salinity regime was achieved using both stable carbon isotope ratios and the observation of macro-plants remains. As local δ13C study is still in progress
on present-day salt-marsh environments of our study zone, δ13C ratios obtained by T.E. Törnqvist et al. (2004), G.P.
Wil-son et al. (2005), H.H. Lamb et al. (2007), A.C. Kemp et al. (2010) and S. Engelhart et al. (2013) were used as references for discriminating between mud-flats, low-saltmarshes and high-marshes environments. The results of G.P. Wilson et al. (2005) and S. Engelhart et al. (2013) proved especially useful, as the environments they describe are quite similar to those we observed. This led us to consider average δ13C values over
-16‰, between -17‰ and -27‰ and under -28‰ as limits for saline, brackish to intermediate and strictly freshwater en-vironments, respectively. Nonetheless, the correlation be-tween δ13C values and foraminifera assemblages obtained
by P. Stephan (2011), led us to slightly reconsider the -28‰ δ13C value, fixed by these studies as the boundary between
brackish and freshwater environments. In fact, δ13C values as small as -28,8‰ were obtained by P. Stephan (2011) from de-posits identified as high saltmarsh by foraminifera analyses (dominated by Jadammina macrescens and Trochamina
infla-ta species). Nevertheless, infla-taking into account the difficulties to
unambiguously discriminate between high-marsh/supratidal environments solely on the basis of δ13C values alone (a
clear-er distinction would require C/N measurements as noted by G.P. Wilson et al., 2005 and H.H. Lamb et al., 2007), this in-dicator will be only used only to confirm brackish conditions and not a RSL proxy. Additional information was retrieved from examination of macro-plant remains if those were easily identifiable. Palynological data were also used when available on the studied deposits.
Palaeo-RSL elevation reconstruction
Accordingly to O. Van de Plassche (1982), when salt-water-influenced basal peats can be clearly identified, they can be Index no. Location Core/ Drilling Lab code Dated material Conv . Age BP Cal. Age BP Elevation Elevation δ13C value TYPE Indicative meaning Indicativ e range RSL Sediment (sample type) in years BP Min. (Mean) Max. in m NGF Relative to present HWST in ‰ PDB in m in m 1 Guisseny GUIS-S1 UBA-15461
Reed peat (bulk)
4309±38 4968 (4900) 4832 -1.15 -5.21 -28.1 SLIP -0.52 1.19 -4.69 ±1.31 2 Guisseny GUIS-C2 UBA-15686 Silty-Peat (bulk) 5563±31 6403 (6351) 6299 -1.52 -5.58 -28.8 SLIP -0.52 1.19 -5.06±1.26 3 Guisseny GUIS-S2 UBA-15460
Brackish peat (bulk)
6033±29 6952 (6872) 6792 -3.52 -7.58 -23.4 SLIP -0.52 1.19 -7.06±1.27 4 Landeda T A R-S2 UBA-15458
Reed peat (bulk)
6001±28 6914 (6845) 6776 -3.6 -7.38 -26.9 SLIP -0.43 1.22 -6.95±1.27 5 Porsmilin PORS-C5 SacA 2681 1
Peat (plant remains)
6015±50 6990 (6863) 6737 -2.45 -5.62 -21.1 HL -<-5.62±0.02 6 T ref fiagat TREF-2 Poz-45390 Silty-mud (roots remains) 4340±40 4978 (4909) 4840 -0.95 -3.61 -HL -<-3.61±0.07 7 Kermor K-X Poz-42854
Black peat (plant
remains) 4800±40 5606 (5536) 5466 -2.49 -4.94 -HL -<-4.94±0.22 8 Guidel GLG-1 Poz-47039
Clay (organic content)
6650±40 7572 (7537) 7502 -7.87 -10.1 -HL -<-10.1±0.22
Tab. 3 – New radiocarbon dates and Sea-Level Index Points
(SLIPs) and limiting dates. “HL” notation states for “High-Limiting”.
Tab. 3 – Nouvelles datations radiocarbones, Sea-Level Index Points (SLIPs) et dates limitantes. HL correspond à « High-limiting ».
Fig. 2 – Stratigraphic logs of studied cores and drillings. 1: clay; 2: silt; 3: mud; 4: high organic content; 5: humifying level; 6: peat; 7: fine-grained sand; 8: medium-grained sand; 9: coarse-grained sand; 10: gravels; 11: pebbles; 12: fluvial gravels and pebbles; 13: geological substrate/weathered basement (granite/shale); 14: soil; 15: charcoals; 16: roots in living position; 17: wood fragment; 18: wood in living position/tree stem remains; 19: shell fragments; 20: shell in living position; 21: erosion surface.
Fig. 2 – Logs stratigraphiques des carottes et forages étudiés. 1 : argiles ; 2 : limons ; 3 : vase ; 4 : importante fraction organique ; 5 : niveau humifère ; 6 : tourbe ; 7 : sables fins ; 8 : sables moyens ; 9 : sables grossiers ; 10 : graviers ; 11 : galets ; 12 : graviers et galets fluviatiles ; 13 : substrat géologique/régolithe (granite/schiste) ; 14 : sol ; 15 : charbons ; 16 : racines en position de vie ; 17 : fragment de bois ; 18 : bois en position de vie/restes de tronc ; 19 : fragments coquillers ; 20 : coquille en position de vie ; 21 : surface dʼérosion.
considered as having formed at an altitude between MSL and MHWST. We consider that this indicative range must be adapted on the basis of the δ13C data available for our study
zone. Indeed, a MSL deposition environment would have led to a very brackish environment characterised by very halophilous plant species, and hence to heavy δ13C values.
Stable carbon isotope measurements we obtained show that basal peat would rather have formed around the high-marsh / freshwater supratidal limit. Hence, we chose to change the indicative meaning associated to brackish peats and set it between high astronomical tides (HAT) and mean high-water neap tides (MHWNT). Freshhigh-water deposits are con-sidered as high-limiting deposits and form a very maximum for former MHWST levels. Tidal levels were obtained for each site from the data of the nearest tidal-gauge (or tidal reference) station.
Error terms
The evaluation of the error terms is of particular importance in RSL reconstructions. These error terms must be assessed before any RSL changes can be reliably proposed, and before any comparison between different studies can be attempted (Heyworth and Kidson, 1982; Shennan, 1982, 1986). Possible error sources are the following: (i) inaccurate altitude level of the borehole, (ii) imprecise position of the sampled horizon within the core, (iii) indicative meaning of the sample, (iv) contemporaneous differences of tidal ranges between sur-veyed site and reference tide-gauge, (v) potential tidal changes over the studied period, (vi) post-depositional compaction, (vii) effects induced by exceptional tides and storm surges, (viii) interferences induced by sedimentary processes (e.g., ac-cumulation rates, peat growth independent from water level,
hiatuses), and (ix) age errors inherent to the radiocarbon dat-ing process and potentially induced by the presence of al-lochtonous carbon in the sampled deposit. All these errors terms, considered for both our own and re-assessed dates, are detailed below and listed in table 2.
Both altitudinal and age error terms were quantified in this study. Altitudinal errors consist in the combination of errors associated to the fieldwork (coring, sampling, surveying) and of errors linked to the determination of the indicative mean-ings and indicative ranges (Shennan, 1986; Van de Plassche, 1986; Gehrels et al., 1996; Brook and Edwards, 2006). Hand-augurings are known to be prone to a potential underestima-tion of the altitude of sampled layers due to the flexion of the rods. Hence, an error of -2 cm/m depth was applied to sam-ples obtained by hand-augurings (Törnqvist et al., 2004). As it was consistently checked in the field, verticality of the percussion and screw-drillings was not taken into account as a possible source of altitudinal error. An error of ±20 cm was nonetheless assumed for the “twirl” effect potentially in-duced by the screw-drilling method. A total altitudinal error of ±2 cm was applied for the GPS-surveys (Suanez et al., 2008). In order to straddle the whole vertical range in which brackish basal peat may have formed, an error term (indica-tive range) was added to their altitude. Considering the in-dicative meaning we chose to apply to brackish-influenced basal deposits, this error was fixed to (HAT-MHWNT)/2 and at each site determined from the contemporaneous local tidal range. When tidal levels were obtained by interpolation between tide-gauges stations, an additional error of ±5 cm was assumed to account for a possible interpolation inaccu-racy. We assume the error associated with potential changes in the tidal ranges during the study period to be negligible over the last 7000 years cal. BP, even if no evidence unam-biguously supports such an assumption. Modelling work by K. Uheara et al. (2006), though conducted at the scale of northeast Atlantic and thus ignoring a possible influence of changes in local sedimentary environments, predicted that such changes must have been smaller than 0.5 m over the study period. Age errors were directly obtained from the ra-diocarbon dating and calibration processes (2-σ confidence interval).
New data
As only basal deposits are addressed in this study, only simplified stratigraphic sequences will be presented (fig. 2). Work on producing fully detailed sequences is still under-way and will be presented in a forthcoming paper. Study sites are presented from the north to the south of the study area (fig. 1). The coring sites coordinates are listed in table 1
as well as the tidal setting for each site. no.
Location T y pe of deposit Lab code Conv . Age BP Cal. Age BP
Indicators of salinity regime of
deposit environment Elevation Elevation Indicative meaning Indicativ e range TYPE RSL in years BP min (mean) max from M.-TH. Morzadec-Kerfourn (1974) in m NGF
in m relative to present local HWST
level
in m
in m
in m relative to present local HWST
level
9
T
rezien
30 cm thick arenaous peat layer with plant remains and
wood-fragment GIF- 714 3660±1 1 5 4299 (3994) 3689 T o
tal absence of salt-water influence indicators
1.5±0.5 -2 -HL <2±0.55 10 Argenton- Gwentrez
20 cm peat layer on grey silt
GIF- 816
3970±35
4525 (4453)
4382
Domination of Chenopodiaceae and gramineae in the pollen assemblage.
Presence of cruciferous (Cakile
maritima) plant species. Dynocysts and hystrichospherids are present.
-0.5±0.5 -4.01 -0.4 1.2 SLIP -3.61±1.75 11 Plouescat- Porsguen
10 cm thick peat layer on
loess deposit GIF- 71 1 4120±140 4976 (4605) 4234)
Absence of Halophilous pollen species within the peat layer
2.4±0.5 -1.86 -HL <-1.86±0.55 12 Ploudal.- Treompan
5 cm thick peat layer on
gery silt deposit
GIF- 766
5770±150
6933 (6610)
6288
Halophilous plant species (Chenopodiaceae, plantago
maritima, armeria). Presence of
hystrichospherids. -4.4±0.5 -8.1 -0.37 1.22 SLIP -7.73±1.77
Tab. 4 – Data re-assessed from M.-T. Morzadec-Kerfourn (1974). “HL” notation states for “High-Limiting”.
Tab. 4 – Données réévaluées depuis M.-T. Morzadec-Kerfourn (1974). La notation HL correspond à « High-limiting ».
Kerlouan – Guissény (1. North-Finistère)
The bay of Tressény is the northernmost site studied in this work. It is a N 315°-oriented narrow bay, terminated at its southernmost part by a relatively sheltered salt-mash cove, forming the mouth of the small “Quillimadec” River. The study of Kerlouan-Tressény site was conducted within the framework – and funded by – the Molène Archipelago archaeological research program of the Brittany Region Ar-chaeology Service (Pailler et al., 2011). The present local tidal levels (table 1) were estimated from the two nearest tidal-ref-erences stations (Aber-Wrac’h and Brignogan, ~10 km west and east of the site, HAT=4.74 m NGF, MHWST=4.06 m NGF, MHWNT=2.36 m NGF).Core Guis-C2
The base of the sedimentary record consists in 0.4 m of Pleistocene gravel rich clay of probable fluvial origin, pro-gressively topped with ~0.6 m of a highly-organic stratified peaty-mud, containing very scarce foraminifera and reed frag-ments. This basal-deposit then evolves into a 0.15 m layer of black-peat ending in an abrupt erosive contact (-0.8 m NGF). Above this contact rests a 0.6 m thick sand layer, turning pro-gressively finer from coarse to medium sand. Above, sedimen-tation alternates between more or less organic silty deposits. Some sand-enriched levels are observed that could be inter-preted as either storm deposits for the shell-rich ones or as emplaced by the shifting of river channels. Above 2.95 m NGF, the sequence becomes highly organic again to the top of the core, the topmost part being composed of the con-temporaneous salt-marsh soil (at 3.75 m NGF). The very base of the basal peat-mud layer (-1.52 m NGF) was dated 6351 ± 52 cal. BP. Used alone, the -28.8‰ δ13C value does
not allow to clearly discriminate between brackish or fresh-water supratidal environment but the presence of reeds leaves remains and foraminifera attests for brackish influ-ences. Former MHWST on the site ca. 6351±52 cal. BP can hence be positioned at -5.06±1.26 m below contemporane-ous MHWST level (Index no. 2).
Cores Guis-S1 and S2
Two hand-augurings were made at the bottom of the Vougot beach situated at the mouth of Tressény cove. The first core (Guis-S1) recovered 0.6 m of a brown reed peat resting on the Pleistocene loess layer. Overlying this peat deposit is ~1.6 m of white sand, progressively gaining in organic content to-wards its top, till it becomes a true sandy-peat layer at ~1.05 m NGF. The topmost 10 cm of the core correspond to the dark-massive brown peat layer today outcropping at the bottom of the beach. Base of the base peat layer (-1.15 m NGF) was dated to 4900±68 cal. B.P (UBA 15461). Reed fragments re-veal a brackish deposit environment, confirmed by the δ13C
value yielding -28‰. This deposit was considered to have formed between HAT and MHWNT and permitted to recon-struct a RSL position of -4.69±1.31 m below contemporane-ous ones for the 4900±68 cal. BP period (Index no. 1). The
second core (Guis-S2) permitted to retrieve 0.65 m of brown peat before reaching the underlying loess formation. Base of the peat was dated to 6872±80 cal. BP (UBA 15460) at -3.52 m NGF. Its brackish character is attested by a heavy δ13C value of -23.4‰. Hence, the palaeo-RSL at 6872±80
cal. BP can be positioned at -7.06±1.27 m under the present MHWST level (Index no. 3).
Landéda – Tariec (2. North-West Finistère)
An auguring was drilled on the foreshore of the Sainte Mar-guerite dunes, a N 315°-exposed site, located between the mouths of two large rivers (Aber-Benoît and Aber-Wrac’h). Local present tidal levels (table 1) were directly obtained from the Aber-Benoît tidal-reference situated ~3 km from the site (HAT=6.75 m NGF, MHWST=4.57 m NGF, MHWNT=2.13 m NGF). An approximately 0.6-m thick peat deposit was reached at -3 m NGF, under ~1 m of sand. This basal peat lies over a Pleistocene loessy silt level of un-known thickness. It consists of a highly fibrous peat, prin-cipally composed of embedded reed-leaves fragments, sug-gesting a brackish swamp sedimentation environment. Base of the peat layer yielded an age of 6845±69 cal. BP at -3.6 m NGF. This date is thus contemporaneous with that of the peat layer of the Curnic beach. As already revealed by the reeds remains embedded in the peat, the brackish con-ditions and a probable high-marsh environment of deposi-tion are confirmed by a δ13C value of -26.9‰. Palaeo-RSLposition on the site ~6845 cal. BP was -6.95±1.27 m under present MHWST (Index no. 4).
Porsmilin (3. Western end of the Finistère
peninsula)
Porsmilin is a cove situated in the Bertheaume Bay. The site comprises a small sandy beach limited landward by a small dune barrier which somewhat isolates a presently filled marsh. On the foreshore of the beach a large step of peat crops out, covered with fallen tree stems. The excep-tionally good state of conservation of the deposit in such a situation (S to SW-oriented beach, highly exposed to storm swells), was an incentive to retain Porsmilin as a study site in the framework of the COCORISCO project. Five piston-cores were carried out from the foreshore to the bottom of the back-barrier but only the lowermost core (Pors-C5) reached Holocene basal deposits. Local present tidal levels (table 1) were determined according to the Trez-Hir tidal reference situated at ~2 km west of the site (HAT=3.99 m NGF, MHWST=3.17 m NGF, MHWNT=1.67 m NGF). Core PorsC5 was made from a peat-step surface cropping out at the bottom of the beach. The weathered basement was reached at an approximate depth of 3.25 m below the sur-face. On top lies 25 cm of Pleistocene sandy silt, which be-comes progressively organic in its upper part before turning in a 0.15 m thick black peat deposit at around -3.5 m NGF. A complex high frequency layering of organic-mud and peat patterns makes up the rest of the sequence. The base of the basal peat deposit was dated on organic content to 6863±127
cal. BP at -2.45 m NGF. The high δ13C value (-21‰) seems
to clearly attest for a brackish-influenced intertidal environ-ment (e.g., lagoonal marsh). Poacea and Cyperacea pollen spores were found to dominate the plant palynological as-semblages (A. Fernane, pers. comm.). Whilst species were not differentiated, this could correspond to brackish adapted plant species such as Spartina altinerflora, Phragmitus
aus-tralis and Juncus roemarianus, respectively. If it appears that
this deposit may have formed in brackish conditions, we con-sider that we lack sufficiently reliable indicators to use it as a SLIP. It was therefore taken as a high-limiting deposit, con-straining the former MHWST level to lay at a maximum of 5.62 m below present one around 6863±127 cal. BP.
Treffiagat (4. South Finistère)
Treffiagat is a flat south-oriented site situated in the south of our study zone. A large dune-barrier isolates a back-bar-rier swamp today still awash with water. On the foreshore just in front of the dune an important peat body is cropping out, eroded seaward by a micro-cliff. Two piston-cores were taken near the swamp in the back-barrier zone, respectively at 2.2 m NGF and 1.75 m NGF. Local present tidal levels (table 1) were determined according to the tidal reference of Le Guilvinec harbour, situated directly to the west of the site (HAT = 4.20 m NGF, MHWST = 3.16 m NGF, MHWNT = 1.56 m NGF). The observed sequence begins at -1.25 m NGF with ~0.3 m of a probably Pleistocene silty-mud com-plex overlaying the weathered basement. This deposit con-tains many traces of oxidation and undated roots remains, attesting of its surface exposure. Above, lies a 30-cm thick organic silty-peat layer, progressively turning into a wooden black peat above ca. -0.7 m NGF. This peat layer is capped by ~1.80 m of sand-barrier medium to coarse sand. A date was ob-tained on organic contents at the transition between the Pleis-tocene silty-mud and the silty-peat (-0.95 m NGF), giving an age of 4909±69 cal. BP. No arguments exist to date in favour of a brackish or freshwater deposit environment. This deposit was hence considered as high-limiting, and led to assess that former mean MHWST level was at least -3.61 m below contempora-neous MHWST ca. 4900 cal. BP (Index no. 6).
Kermor – Tudy (5. South Finistère)
The site of Kermor/Tudy is situated in the Bénodet cove. The site is composed of a large dune barrier oriented N 135° that isolates a back-barrier lagoon nowadays polderized. Several drillings were taken in the polder in the back-barrier zone. Only one drilling taken at the eastern end of the site, near to the barrier root, permitted to reach basal peat deposits. Local con-temporaneous tidal levels (table 1) were determined accordingly to the tidal reference for the harbour of Loctudy situated directly northwest of the site (HAT=3.09 m NGF, MHWST=2.45 m NGF, MHWNT=1.35 m NGF). Core K-X reached the weathered geological substrate at a depth of 4 m, the top of the core being situated at 1.3 m NGF. The base of the sequence is composed by a 0.1-m thick sandy silt layer, pro-gressively evolving into a black peat until ca. -2.6 m NGF.
Superimposed on this peat level is 0.8 m of very organic strat-ified silt horizons. On top of a sharp sedimentary hiatus appears a Hydrobia ulvae-dominated marine mud layer. This layer becomes more and more organic to the top (grey to brown mud, with less shell fragments, implying a probable salt-marsh facies) until ca. -1 m NGF. The uppermost part of the core is composed of 1.3 m of brown to green clay, on which rests a dune sand level. The basal peat was dated on organic content to 5536±70 cal. BP. at -2.49±0.22 m NGF, ~10 cm above the contact between the sandy silt and the peat. No clear argument could help us to determine the original deposit envi-ronment. Hence, this sample was considered as a high-limiting point. It constrains the former MHWST level to a lay at a max-imum of -4.94±0.22 m under present one (Index no. 7). Due to the elevation uncertainties induced by the sampling method, it cannot be fully attested that this deposit is a “pure” com-paction-free basal peat. It must so be kept in mind that it could have undergone an unknown compaction-induced lowering.
Guidel (6. South Finistère)
Guidel-Loc’h is the southernmost site of this study. It con-sists in a south 225°-oriented ria, polderized since the 19th c. Two screw drillings were completed along a SW/NE tran-sect across the Guidel-Loc’h pond: GLG-1 was drilled in the middle of the pond, while GLG-2 was drilled about 500 m seaward. Only GLG-1 reached a basal peat deposit. Local contemporaneous tidal levels were determined according to the tidal reference of Le Pouldu situated at ~2 km north of the site (HAT=2.78 m NGF, MHWST=2.23 m NGF, MHWNT=1.18 m NGF). GLG-1 is an 11-m deep drilling, reaching the micaschist, weathered basement at -8.3 m NGF. The base of the sequence consists of ca. 0.2 meter of lacus-trine clay encroaching the weathered, micaschist basement. It may represent a lacustrine environment that was emplaced as a result of the hampered drainage in the RSL rise context or a Pleistocene floodplain deposit. The centre of this layer was dated to ca. 7900 cal. BP in GLG-2 drilling, but we also consider probable that this datation could have been reju-venated by roots penetration. The clay evolves upwards into a 20 cm silty peat layer, overlaid in unconformity by 2.5 m of silty sand. The sequence continues with a succes-sion of 7 m of a sand and muddy-silty layers interrupted by several organic-rich salt-marsh soils. The roof of the sequence is composed of 1 m of sandy marine deposits. The basal-peat and the underlying silt deposit was dated to 7523±64 cal. BP on organic fragments embedded in the peat matrix at -7.87±0.22 m NGF. In the absence of micro-biological or geochemical indicators, this layer could only be considered as a high-limiting deposit. It led to assess a former maximum MHWST level of -10.1±0.22 m below the present one (Index no. 8). As it cannot be ruled out that the underlying clay deposit is totally compaction-free and because the peat layer was not sampled at its very base, a potential shortcoming exists in the representativeness of this deposit as a basal-deposit. Thus, again, it cannot be consid-ered as a fully reliable upper-constraint of the RSL and must be only considered as indicative.