HAL Id: inserm-00406798
https://www.hal.inserm.fr/inserm-00406798 Submitted on 5 Jul 2010
HAL is a multi-disciplinary open access archive for the deposit and dissemination of sci-entific research documents, whether they are pub-lished or not. The documents may come from teaching and research institutions in France or abroad, or from public or private research centers.
L’archive ouverte pluridisciplinaire HAL, est destinée au dépôt et à la diffusion de documents scientifiques de niveau recherche, publiés ou non, émanant des établissements d’enseignement et de recherche français ou étrangers, des laboratoires publics ou privés.
Health behaviors from early to late midlife as predictors
of cognitive function: The Whitehall II study.
Séverine Sabia, Hermann Nabi, Mika Kivimaki, Martin Shipley, Michael Marmot, Archana Singh-Manoux
To cite this version:
Séverine Sabia, Hermann Nabi, Mika Kivimaki, Martin Shipley, Michael Marmot, et al.. Health behaviors from early to late midlife as predictors of cognitive function: The Whitehall II study.. American Journal of Epidemiology, Oxford University Press (OUP), 2009, 170 (4), pp.428-37. �10.1093/aje/kwp161�. �inserm-00406798�
Health Behaviors from Early to Late Midlife as Predictors of Cognitive Function: the Whitehall II Study. Séverine Sabia, MSc1* Hermann Nabi, PhD1 Mika Kivimaki, PhD 2 Martin J Shipley, MSc 2 Michael G Marmot, PhD, FFPHM, FRCP2 Archana Singh-Manoux, PhD1,2,3
*Corresponding author & address 1INSERM U687-IFR69
Hopital Paul Brousse,
16 avenue Paul Vaillant Couturier, Bâtiment 15/16, 94807 Villejuif Cedex
Tel: + 33 (0)1 77 74 74 06; Fax: + 33 (0)1 77 74 74 03 Email: Severine.Sabia@inserm.fr
2Department of Epidemiology and Public Health, University College London, UK 3Centre de Gérontologie, Hôpital Ste Perine, AP-HP, Paris, France
ACKNOWLEDGEMENTS
Author contributions:
S Sabia had full access to all of the data in the study and takes responsibility for the integrity of the data and the accuracy of the data analysis.SS was involved in study design, analysis and interpretation of data, writing the manuscript and is guarantor of the study. All authors designed the hypothesis, interpreted the data, suggested new analytical strategies, and made critical edits of the paper.
Funding/Support:
AS-M is supported by a “European Young Investigator Award” from the European Science Foundation. MK is supported by the Academy of Finland (grants 117604, 124332, 124327). MJS is supported by the British Heart Foundation. MM is supported by an MRC research professorship. The Whitehall II study has been supported by grants from the British Medical Research Council (MRC); the British Heart Foundation; the British Health and Safety Executive; the British Department of Health; the National Heart, Lung, and Blood Institute (grant HL36310); the National Institute on Aging (grant AG13196); the Agency for Health Care Policy and Research (grant S06516); and the John D. and Catherine T.MacArthur Foundation Research Networks on Successful Midlife Development and Socioeconomic Status and Health.
Role of sponsor:
The funding bodies did not participate in the study design, analysis or interpretation of data, or manuscript preparation.Acknowledgment:
We thank all of the participating civil service departments and their welfare, personnel, and establishment officers; the British Occupational Health and Safety Agency; the British Council of Civil Service Unions; all participating civil servants in the Whitehall II study; and all members of the Whitehall II study team.Abstract
The authors examined associations of health behaviors over a 17-year period, separately and in combination, with cognition in late midlife in 5123 men and women from the Whitehall II study (United Kingdom). Health behaviors were assessed in early midlife (mean age=44 years, Phase 1, 1985-1988), in midlife (mean age=56 years, Phase 5, 1997-1999) and in late midlife (mean age=61 years, Phase 7, 2002-2004). A score of the number of unhealthy behaviors (smoking, alcohol abstinence, low physical activity, and low fruit and vegetable consumption) was defined as ranging from 0 to 4. Poor (defined as scores in the worst sex-specific quintile) executive function and memory in late midlife (Phase 7) were analyzed as outcomes. Compared to those with no unhealthy behaviors, those with 3-4 unhealthy behaviors at Phase 1 (Odds Ratio (OR)=1.84; 95% Confidence Interval:1.27,2.65), Phase 5 (OR=2.38;1.76,3.22) and Phase 7 (OR=2.76;2.04,3.73) were more likely to have poor executive function. A similar association was observed for memory. Odds of poor executive function and memory were the greater the more times the participant reported unhealthy behaviors over the three phases. This study suggests that both the number of unhealthy behaviors and their duration is associated with subsequent cognitive function in later life. Keywords: cognition, health behaviors, longitudinal studies, middle aged.
In developed countries, dementia prevalence is around 1.5% at age 65, and it doubles every 4 years to reach more than 30% at 80 years of age (1). There is growing evidence of an association between health behaviors and cognitive ageing. Smoking (2, 3), alcohol
abstinence (4-9), lack of physical activity (10-13) and poor dietary behavior (14-16) have all been found to be associated with cognitive decline and dementia. The core hypothesis linking health behaviors to cognitive ageing involves cerebro- and cardiovascular diseases as
mediators (17, 18), and their association with cognitive impairment is well established (19). The extent to which health behaviors are related to cognitive outcomes is of substantial public health relevance especially since health behaviors are potentially modifiable.
Although prospective studies have shown individual health behaviors to be associated with cognition (2, 6, 11, 15), their combined impact on cognition remains unexplored. Risk factors for dementia are hypothesized to involve effects over many years, making the
investigation into cumulated exposures to ubhealthy behaviors crucial to understanding their associations with cognitive ageing (20, 21). Increasingly, midlife risk factors are seen to be important for dementia and poor cognitive status at older ages (19, 20, 22, 23). Research on the relationship between health behaviors and cognitive ageing among the elderly is
complicated as preclinical dementia itself modifies behaviors (24). This has lead to studies that examine risk factors for cognitive outcomes at earlier ages, knowing that mild cognitive impairment has been shown to progress to clinically diagnosed dementia at an accelerated rate (25-27).
The objective of the present study is to assess the association of individual health behaviors and their combination with poor cognition in late midlife. We used health behaviors assessed three times over a 17-year period to examine whether unhealthy behaviors,
memory and whether the risk associated with unhealthy behaviors accumulate over the adult lifecourse.
MATERIALS AND METHODS Study population
The target population for the Whitehall II study was all London-based office staff, aged 35–55 years, working in 20 civil service departments (28). The baseline examination (Phase 1) took place during 1985-1988 (N=10,308; 67% men), and involved a clinical examination and a self-administered questionnaire including sections on lifestyle factors. Subsequent phases of data collection have alternated between postal questionnaire alone (Phases 2 (1988-1990), 4 (1995-1996), 6 (2001) and 8 (2006)) and postal questionnaire accompanied by a clinical examination (Phases 3 (1991-1993), 5 (1997-1999) and 7 (2002-2004)). Phase 7 included cognitive testing for the entire cohort. Participants gave written consent to participate in the study and the University College London ethics committee approved the study.
Measures of health behaviors
Data on health behaviors were drawn from questionnaires in early midlife (Phase 1, mean age=44.1, Standard Deviation (SD)=6.0), midlife (Phase 5, mean age=55.6, SD=6.0) and late midlife (Phase 7, mean age=61.1, SD=6.0).
Smoking status at the three phases was assessed using questions on current smoking; high risk was defined as being a “current” smoker.
Alcohol consumption was assessed via questions on the number of alcoholic drinks (“measures” of spirits, “glasses” of wine, and “pints” of beer) consumed in the last seven days, converted to number of units of alcohol with each unit corresponding to 8 grams of
ethanol. (4) A standard measure of spirits and a glass of wine was considered to contain 8 g (one unit) of alcohol and a pint of beer 16 g (two units) of alcohol. Alcohol consumption was categorized as: no alcohol, 1-14 units, and 15 or more units of alcohol per week. After
preliminary analyses the high risk category was defined as “abstinence from alcohol” (4, 29). In this cohort, heavy alcohol use (≥42 units per week, corresponding to 6 or more drinks per day) was rare (n = 166 at Phase 1, 3.2%).
Physical activity. At Phase 1, participants were asked about the frequency and duration of their participation in mildly energetic (e.g., weeding, general housework, bicycle repair), moderately energetic (e.g., dancing, cycling, leisurely swimming), and vigorous physical activity (e.g., running, hard swimming, playing squash). Examples for each level of physical activity were provided in order to allow similar interpretation of the items by the participants. At Phases 5 and 7, the questionnaire was modified to include 20 items on frequency and duration of participation in different physical activities (eg walking, cycling, sports) that were used to compute hours per week of each intensity level. Low risk was defined at each of the three phases as more than 2.5 hours per week or more of moderate physical activity or 1 hour or more per week of vigorous physical activity (30).
Dietary behavior was assessed using a measure of frequency of fruit and vegetable consumption with the question “How often do you eat fresh fruit or vegetables?”; responses were on an eight-point scale, ranging from ‘seldom or never’ to ‘two or more times a day’. The low risk category was defined as eating fruit and vegetable two or more times a day. Cognitive function
Executive function was derived from three measures: a measure of reasoning and 2 measures of verbal fluency. The AH4-I (Alice Heim 4-I) was used to assess reasoning. This test is composed of a series of 65 verbal and mathematical reasoning items of increasing
difficulty (31). It tests inductive reasoning, measuring the ability to identify patterns and infer principles and rules. Participants had 10 minutes to do this section. We used two measures of verbal fluency: phonemic and semantic (32). Phonemic fluency was assessed via “S” words and semantic fluency via “animal” words. Subjects were asked to recall in writing as many words beginning with “S” and as many animal names as they could. One minute was allowed for each test.
Memory was assessed using a test of short-term verbal memory using a 20-word free recall test. Participants were presented a list of 20 one or two syllable words at two second intervals and then had two minutes to recall in writing as many of the words in any order. Covariates
Socio-demographic variables used were age, sex and socio-economic position (SEP). SEP was assessed using the 6-level civil service employment grade at Phases 1, 5 and 7. Employment grade in the Whitehall II study is a comprehensive marker of SEP and is related to salary, social status and level of responsibility (28).
Statistical methods
A composite score of executive function was created using the reasoning, phonemic and semantic fluency scores. In order to take into account the correlation between these scores, a principal component analysis was used and the first factor was retained to define score in executive function (33). This factor accounted for 70.6% of the variance; factor loadings were 0.57 for reasoning, 0.57 for phonemic fluency and 0.59 for semantic fluency.
As in previous studies of this cohort (3, 4, 12), poor cognition was defined as cognitive scores in the lowest sex-specific quintile. As the executive function score was a continuous variable, cut-offs for poor executive function in men and women were chosen to have exactly
20% of the population under these cut-offs. The memory score was a discrete variable; we defined poor memory as scores lower than 5 out of 20 corresponding to 15.1% of men and 17.1% of women. We examined the association between health behaviors and the
dichotomized measures of cognition using logistic regression. First, we analyzed individual health behaviors at Phase 1 (long-term association), then at Phase 5 (short-term association) and finally at Phase 7 (cross-sectional association) with poor executive function and memory at Phase 7. All analyses were adjusted for measures of age, sex and SEP drawn from the same phase as the health behaviors.
For the next step of the analyses we created a score of unhealthy behaviors at study Phases 1, 5 and 7. This score was the sum of unhealthy behaviors, ranging from 0 (all healthy behaviors) to 4 (current smoking, alcohol abstinence, low physical activity, and low fruit and vegetable consumption). We then examined the long-term, short-term and cross-sectional associations between these scores and poor executive function and memory using two models: one including the number of unhealthy behaviors and the other including all possible
combinations of unhealthy behaviors. In each case, the reference group was those with no unhealthy behavior. The second model was used to visually check the homogeneity of estimates of the impact of combinations of unhealthy behaviors on cognition, some of these combinations being too small for formal testing.
Finally, in order to examine whether the risk associated with unhealthy behaviors accumulated over the midlife, we created a score representing the number of times a person reported each unhealthy behavior throughout the follow-up, with scores ranging from 0 (no unhealthy behavior at Phase 1, 5 or 7) to 3 (reporting the unhealthy behavior at all three study phases). We then calculated a summary cumulative score of unhealthy behaviors by adding the individual cumulative scores for each of the four unhealthy behaviors. This score ranged from 0 (none of the four unhealthy behaviors at Phases 1, 5 or 7) to 12 (all four unhealthy
behaviors at the three study phases) and was categorized into four groups, 0-2, 3-5, 6-8, 9-12, to allow enough numbers in each group. All analyses were performed using SAS 9.1 software. RESULTS
Sample description and missing data
Of the 10,308 participants at Phase 1, 6,327 participated in cognitive testing at Phase 7. Data on health behaviors, cognitive function, and all covariates were available for 5,123 respondents. Compared to participants not included in the present study, this group was younger (61.1 years versus 61.7 years), composed of fewer women (27.9 percent versus 38.2 percent) and fewer participants from the low SEP group (12.8 percent versus 32.5 percent) (P<0.0001). Participants included in the analysis reported here were also more likely at Phase 1 to be non smokers (86.4 percent versus 76.7 percent), alcohol consumers (86.0 percent versus 77.3 percent), more physically active (53.1 percent versus 45.6 percent) and to eat more fruits and vegetables (19.0 percent versus 14.1 percent ate at fruits or vegetable at least two or more times per day) (P<0.0001).
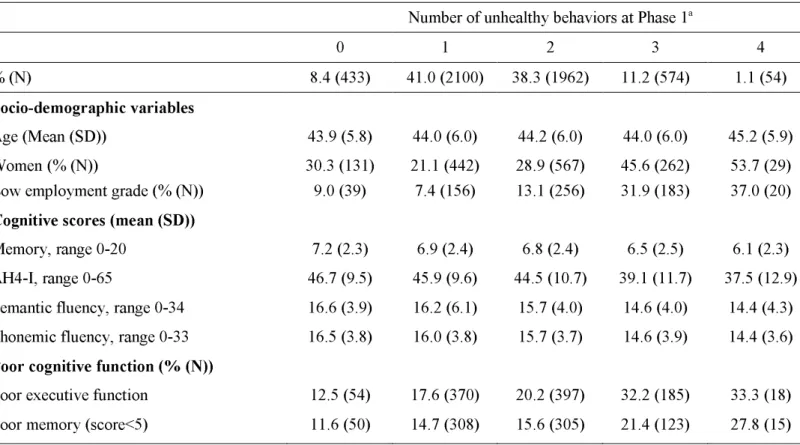
In table 1, baseline socio-economic characteristics and cognitive scores at Phase 7 are presented as a function of the number of unhealthy behaviors at Phase 1. There was no evidence that the association between the score of unhealthy behaviors at the three study phases and the two cognitive outcomes differed by sex (P for interaction > 0.22). Thus, all analyses combine men and women.
Association between each health behavior and poor cognition
Table 2 presents the association between each health behavior at Phase 1 (long-term association), Phase 5 (short-term association) and Phase 7 (cross-sectional association) and poor executive function and memory at Phase 7. At each phase, in analyses adjusted for age,
sex and SEP, current smokers were more likely to be in the lowest quintile of executive function and of memory (Odds Ratios (OR) between 1.21 and 1.34). Compared to moderate alcohol consumption (1-14 units/week), alcohol abstinence at the three study phases
(OR=1.33; 95 percent Confidence Interval (CI): 1.07, 1.64; OR=1.71; 95 percent CI: 1.39, 2.10; OR=1.65; 95 percent CI: 1.35, 2.02, respectively for alcohol abstinence at Phases 1, 5 and 7) was associated with a higher risk of poor executive function. Alcohol abstinence at Phases 5 and 7 was also associated with poor memory. As no increase in risk was found among participants who consumed more than 14 units per week, we have used alcohol abstinence rather than excessive alcohol consumption as the marker of unhealthy behavior in further analyses. Those reporting low levels of physical activity at Phases 5 and 7 were at higher risk of poor executive function (OR=1.19) compared to those undertaking high levels of physical activity. This association was also evident cross-sectionally for low physical activity and poor memory at Phase 7 (OR= 1.28; 95 percent CI: 1.09, 1.50). Finally, those consuming fruits and vegetables less than two times per day had a higher risk of poor executive function, with a stronger association seen with measures of behavior proximal to cognitive assessment (OR=1.32, 95 percent CI: 1.06, 1.64; OR=1.60, 95 percent CI: 1.36, 1.89; OR=1.85, 95 percent CI: 1.56, 2.19, respectively for fruit and vegetable consumption at Phases 1, 5 and 7). This measure of dietary behavior was also associated with poor memory, although these associations were weaker.
Combination of health behaviors and poor cognition
Results on the association between combination of health behaviors and poor
executive function and memory are presented in Tables 3 and 4 respectively. The proportion of the study population with no unhealthy behaviors was 8.4% at mean age 44 (Phase 1) and 22.0% at mean age 61 (Phase 7). Individuals with a greater number of unhealthy behaviors
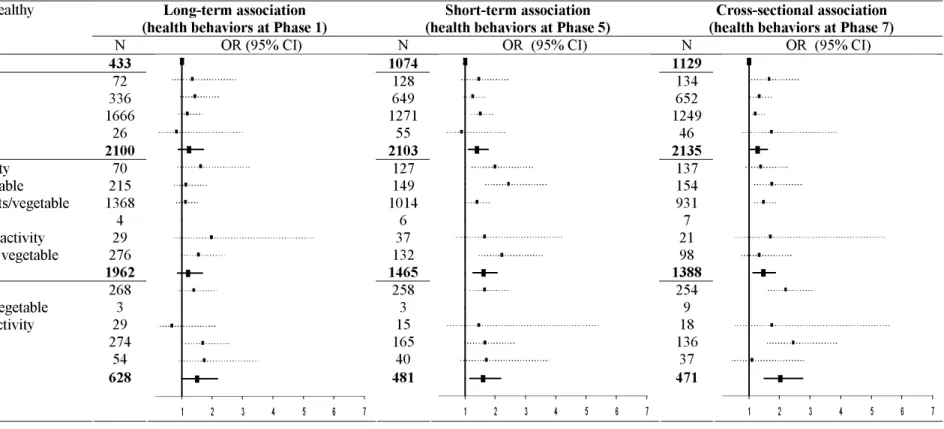
had a greater risk of poor executive function, irrespective of the phase at which health behaviors were assessed (all P for trend for poor executive function≤0.002). Compared to participants with no unhealthy behaviors, those with three or four unhealthy behaviors, whether at Phase 1 (OR=1.84; 95 percent CI: 1.27, 2.65), Phase 5 (OR=2.38; 95 percent CI: 1.76, 3.22) or Phase 7 (OR=2.76; 95 percent CI: 2.04, 3.73) were more likely to have poor executive function. The association with poor memory (Table 4) was evident particularly with the more recent measures of health behaviors (P for trend 0.07, 0.0004 and <0.0001 for Phases 1, 5 and 7). Those with 3-4 unhealthy behaviors at Phase 1 (OR=1.50; 95 percent CI: 1.04, 2.17), Phase 5 (OR=1.59; 95 percent CI: 1.16, 2.19) and Phase 7 (OR=2.03; 95 percent CI: 1.49, 2.76) had greater odds of poor memory.
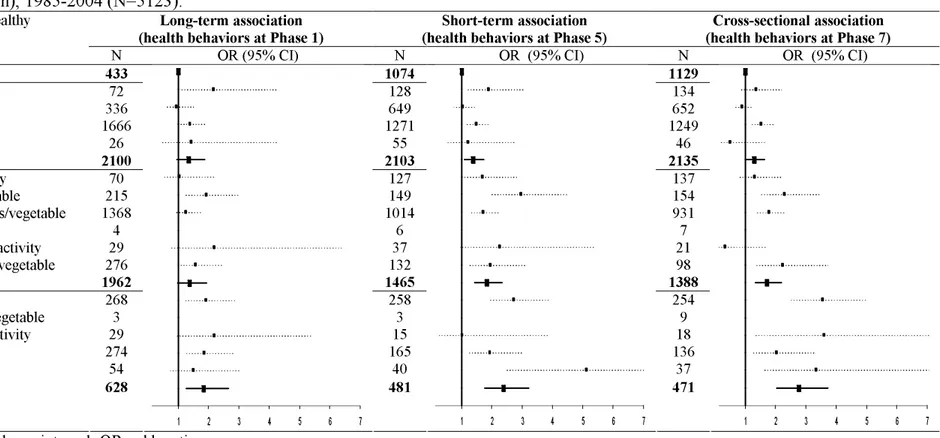
Tables 3 and 4 also show the results aimed at exploring whether the associations between the number of unhealthy behaviors (when they total 1, 2 or 3-4 out of the 4 unhealthy behaviors) and cognition are driven by specific combinations of unhealthy behaviors.
Participants with only one unhealthy behavior were essentially those with poor dietary
behavior, for example out of the 2100 participants with 1 unhealthy behavior at Phase 1, 1666 ate fruit or vegetables less that 2 times per day. The 2 out of 4 unhealthy behaviors category was composed essentially of those physically inactive and with poor dietary behavior. The graphical representations in Tables 3 and 4 appear to suggest that no particular combination of unhealthy behaviors drives the association between the number of unhealthy behaviors (when they total 1, 2 or 3-4 out of the 4 unhealthy behaviors) with poor executive function (Table 3) and memory (Table 4). Thus, despite greater prevalence of poor dietary behavior and physical inactivity the impact of all combinations of unhealthy behaviors is similar.
The association of cumulative exposure to unhealthy behaviors over time and poor cognition is presented in Table 5. Participants with greater exposure across midlife to
smoking had greater odds of poor executive function and memory (for both P=0.03). Similar associations were found for alcohol abstinence (P <0.0001 for executive function and p=0.01 for memory), low physical activity (P =0.06 and P=0.03), and poor dietary behavior (P
<0.0001 and P=0.02). The combined impact of unhealthy behaviors over time, reflected in the cumulative score, was strong: compared to those with 0-2 unhealthy behaviors over the follow-up, participants with a total of 9-12 unhealthy behaviors had greater odds of poor executive function (OR=2.87; 95 percent CI: 1.90, 4.32) and memory (OR=2.01; 95 percent CI: 1.32, 3.08).
Sensitivity analysis
A longitudinal cohort inevitably results in non-response over time. The analysis
reported here are on complete cases using behavioral data and covariates from Phases 1, 5 and 7 and cognitive data from Phase 7 (N=5123). We repeated the analysis on Phase 1 health behaviors using all available data (N=6161), these results showed slightly stronger
associations between individual and combined health behaviors and poor cognition (results not shown).
DISCUSSION
Data from a large British occupational cohort show that each of the four unhealthy behaviors examined - smoking, alcohol abstinence, low physical activity, poor dietary behavior - at any of the three measures over the 17-year follow-up was associated with poor executive function and memory in late midlife. Results suggest greater risk of poor executive function and memory with increase in the number of unhealthy behaviors. Furthermore,
greater exposure from early to late midlife to individual or a combination of unhealthy behaviors was found to be associated with a greater risk of poor cognitive function in a dose-response manner.
Although, there is some evidence showing that different health behaviors tend to cluster (34, 35), they have been studied for their combined impact on health only recently. Research suggests that the combined impact of unhealthy behaviors leads to a 3 to 4-fold increase in risk of mortality (29, 36-38), a 7-fold increase in risk of coronary heart disease in men (39) and a 3-fold increase in risk of ischemic stroke in women (40) compared to those with no unhealthy behaviors. Given these results, our findings are important because this is the first time the association between a combination of health behaviors and cognitive function has been demonstrated. These results are in agreement with previous research showing greater risk of poor cognition in current smokers (2, 3), alcohol abstainers (4-9), the physically inactive (10-13) and those with poor dietary behavior (14-16) when these have been examined separately. Our results suggest the importance of the combined impact of health behaviors for cognitive outcomes. In addition to the number of unhealthy behaviors, we examined their combinations, but there was no evidence to suggest that any particular
combination of unhealthy behaviors drives the association. Thus, a simple summary score of unhealthy behaviors might be enough to assess association with cognitive outcomes.
Our results add to the previous evidence showing that health behaviors across the adult lifecourse may influence cognitive function at older ages (2, 7, 10, 14). These findings
support the idea that midlife risk factors have a role in the development of cognitive
impairment in later life (19, 23). Moreover, repeated measures of health behaviors allowed us to assess the association of cumulative exposure to unhealthy behaviors, separately and in combination, over midlife with cognition in late midlife. A greater risk of poor cognition was found with greater exposure to each of the health behaviors as well as for combinations of
health behaviors, suggesting that, not only the number of unhealthy behaviors, but also the period of exposure should be taken into account in risk assessment.
It is increasingly clear that dementia has a long preclinical phase leading to increasing calls to examine the association between risk factors and cognitive outcomes many years before the clinical diagnosis of dementia (21, 22). Research suggests that individuals with mild cognitive impairment (MCI) progress to clinically diagnosed dementia at an accelerated rate (25-27), spurring research into cognition earlier in the lifecourse. In these studies, there is no clinical cut-off to define cognitive deficit and three methods are commonly used to denote poor performance, either scores below 1.5 standard deviation from the mean (41) or scores in the worst decile (42) or worst quintile (43). In the present study, we use the third definition with the objective of assessing the association with midlife poor cognition specific to the population studied.
In this study, two specific cognitive domains, executive function and memory, were found to be associated with health behaviors. Executive function, an umbrella term for various complex cognitive processes involved in achieving a particular goal (44), has been shown to be particularly strongly affected in vascular dementia (45). We assessed executive function using measures of reasoning and verbal fluency as these tasks require the combination of different cognitive abilities like memory, attention, and speed of information processing (31, 32). Health behaviors are important risk factors for vascular diseases (46) and could influence executive function via the vascular pathway. In our data, there was also an association
between health behaviors and memory, although it was less consistent. This difference could be explained by the fact that memory is likely to be less influenced by vascular risk factors (hypertension, cholesterol, diabetes) (47-49). Another explanation could be better
measurement precision for executive function as the score was made up of three tests compared to the single measure of memory.
The specific strengths of this study include a detailed prospective assessment of health behaviors over a 17-year period, and adjustments for SEP, an important confounder that is associated both with health behaviors and cognition. However, at least five limitations for this study are noteworthy. First, although the sample covered a wide socioeconomic range, with annual full-time salaries ranging from £4,995 to £150,000, data are from white-collar civil servants and cannot be assumed to be representative of the general population. Second, during the 17-year follow-up 50% of the baseline population was lost to follow-up and baseline data suggest that these were more likely to have unhealthy behaviors. Sensitivity analysis using Phase 1 health behaviors suggests that the association between health behaviors and cognition could be underestimated in this study. Third, a U-shape relationship between alcohol
consumption and cognition has been reported previously (50). In our study, no higher risk was found in those who consumed more than 14 units per week. However, few participants of the Whitehall II study are heavy drinkers and our data are not best to pursue this further (4). Fourth, the measure of physical activity changed between Phase 1 and Phase 5, which could explain the lack of association with physical activity at Phase 1. Finally, the World Health Organization diet recommendation advises to eat at least 400 g of fruit and vegetables per day (51), but we only had a measure of frequency of fruit and vegetable consumption and not the amount consumed.
In conclusion, our results show a prospective, cross-sectional and cumulative association of smoking, alcohol abstinence, low physical activity, and consumption of fruit and vegetables less than two times a day with poor cognitive function. Furthermore, we found that a greater number of these unhealthy behaviors was associated with a higher risk of poor cognition, particularly evident in executive function and this risk accumulated over the midlife. All these health behaviors are modifiable and our results suggest that the promotion of a healthy lifestyle at all ages is important for cognitive outcomes.
Reference List
1. Ritchie K, Lovestone S. The dementias. Lancet 2002; 360(9347): 1759-66
2. Anstey KJ, von SC, Salim A, et al. Smoking as a risk factor for dementia and cognitive decline: a meta-analysis of prospective studies. Am J Epidemiol 2007; 166(4): 367-78 3. Sabia S, Dufouil C, Marmot MG, et al. Smoking history and cognitive function in
middle-age in Whitehall II study. Arch Intern Med 2008; 168: 1165-73
4. Britton A, Singh-Manoux A, Marmot M. Alcohol consumption and cognitive function in the Whitehall II Study. Am J Epidemiol 2004; 160(3): 240-7
5. Espeland MA, Gu L, Masaki KH, et al. Association between reported alcohol intake and cognition: results from the Women's Health Initiative Memory Study. Am J Epidemiol 2005; 161(3): 228-38
6. Ganguli M, Vander BJ, Saxton JA, et al. Alcohol consumption and cognitive function in late life: a longitudinal community study. Neurology 2005; 65(8): 1210-7
7. Richards M, Hardy R, Wadsworth ME. Alcohol consumption and midlife cognitive change in the British 1946 birth cohort study. Alcohol Alcohol 2005; 40(2): 112-7 8. Ruitenberg A, van Swieten JC, Witteman JC, et al. Alcohol consumption and risk of
9. Peters R, Peters J, Warner J, et al. Alcohol, dementia and cognitive decline in the elderly: a systematic review. Age Ageing 2008; 37(5): 505-12
10. Jedrziewski MK, Lee VM, Trojanowski JQ. Physical Activity and Cognitive Health. Alzheimers Dement 2007; 3(2): 98-108
11. van Gelder BM, Tijhuis MA, Kalmijn S, et al. Physical activity in relation to cognitive decline in elderly men: the FINE Study. Neurology 2004; 63(12): 2316-21
12. Singh-Manoux A, Hillsdon M, Brunner E, et al. Effects of physical activity on cognitive functioning in middle age: evidence from the Whitehall II prospective cohort study. Am J Public Health 2005; 95(12): 2252-8
13. Larson EB, Wang L, Bowen JD, et al. Exercise is associated with reduced risk for incident dementia among persons 65 years of age and older. Ann Intern Med 2006; 144(2): 73-81
14. Kang JH, Ascherio A, Grodstein F. Fruit and vegetable consumption and cognitive decline in aging women. Ann Neurol 2005; 57(5): 713-20
15. Morris MC, Evans DA, Tangney CC, et al. Associations of vegetable and fruit consumption with age-related cognitive change. Neurology 2006; 67(8): 1370-6 16. Luchsinger JA, Mayeux R. Dietary factors and Alzheimer's disease. Lancet Neurol
17. Alagiakrishnan K, McCracken P, Feldman H. Treating vascular risk factors and maintaining vascular health: is this the way towards successful cognitive ageing and preventing cognitive decline? Postgrad Med J 2006; 82(964): 101-5
18. Pope SK, Shue VM, Beck C. Will a healthy lifestyle help prevent Alzheimer's disease? Annu Rev Public Health 2003; 24: 111-32
19. Kivipelto M, Helkala EL, Hanninen T, et al. Midlife vascular risk factors and late-life mild cognitive impairment: A population-based study. Neurology 2001; 56(12): 1683-9 20. Whalley LJ, Dick FD, McNeill G. A life-course approach to the aetiology of late-onset
dementias. Lancet Neurol 2006; 5(1): 87-96
21. Hachinski V. Shifts in thinking about dementia. JAMA 2008; 300(18): 2172-3 22. Brayne C. The elephant in the room - healthy brains in later life, epidemiology and
public health. Nat Rev Neurosci 2007; 8(3): 233-9
23. Kivipelto M, Helkala EL, Laakso MP, et al. Midlife vascular risk factors and Alzheimer's disease in later life: longitudinal, population based study. BMJ 2001; 322(7300): 1447-51
24. Ikeda M, Brown J, Holland AJ, et al. Changes in appetite, food preference, and eating habits in frontotemporal dementia and Alzheimer's disease. J Neurol Neurosurg Psychiatry 2002; 73(4): 371-6
25. Chertkow H. Mild cognitive impairment. Curr Opin Neurol 2002; 15(4): 401-7 26. Morris JC, Storandt M, Miller JP, et al. Mild cognitive impairment represents
early-stage Alzheimer disease. Arch Neurol 2001; 58(3): 397-405
27. Petersen RC, Doody R, Kurz A, et al. Current concepts in mild cognitive impairment. Arch Neurol 2001; 58(12): 1985-92
28. Marmot MG, Smith GD, Stansfeld S, et al. Health inequalities among British civil servants: the Whitehall II study. Lancet 1991; 337(8754): 1387-93
29. Knoops KT, de Groot LC, Kromhout D, et al. Mediterranean diet, lifestyle factors, and 10-year mortality in elderly European men and women: the HALE project. JAMA 2004; 292(12): 1433-9
30. WHO. Physical Inactivity: A Global Public Health Problem. [electronic article].
http://www who int/dietphysicalactivity/factsheet_inactivity/en/index html 2008. 31. Heim AW. AH 4 group test of general Intelligence. Windsor, UK: NFER-Nelson
Publishing Company Ltd.; 1970
32. Borkowski JG, Benton AL, Spreen O. Word fluency and brain damage. Neuropsychologica 1967; 5: 135-40
33. Knecht S, Wersching H, Lohmann H, et al. High-normal blood pressure is associated with poor cognitive performance. Hypertension 2008; 51(3): 663-8
34. Poortinga W. The prevalence and clustering of four major lifestyle risk factors in an English adult population. Prev Med 2007; 44(2): 124-8
35. Pronk NP, Anderson LH, Crain AL, et al. Meeting recommendations for multiple healthy lifestyle factors. Prevalence, clustering, and predictors among adolescent, adult, and senior health plan members. Am J Prev Med 2004; 27(2 Suppl): 25-33
36. Khaw KT, Wareham N, Bingham S, et al. Combined impact of health behaviours and mortality in men and women: the EPIC-Norfolk prospective population study. PLoS Med 2008; 5(1): e12
37. Yates LB, Djousse L, Kurth T, et al. Exceptional longevity in men: modifiable factors associated with survival and function to age 90 years. Arch Intern Med 2008; 168(3): 284-90
38. van Dam RM, Li T, Spiegelman D, et al. Combined impact of lifestyle factors on mortality: prospective cohort study in US women. BMJ 2008; 337: a1440
39. Chiuve SE, McCullough ML, Sacks FM, et al. Healthy lifestyle factors in the primary prevention of coronary heart disease among men: benefits among users and nonusers of lipid-lowering and antihypertensive medications. Circulation 2006; 114(2): 160-7 40. Kurth T, Moore SC, Gaziano JM, et al. Healthy lifestyle and the risk of stroke in
41. Portin R, Muuriaisniemi ML, Joukamaa M, et al. Cognitive impairment and the 10-year survival probability of a normal 62-year-old population. Scand J Psychol 2001; 42(4): 359-66
42. Stampfer MJ, Kang JH, Chen J, et al. Effects of moderate alcohol consumption on cognitive function in women. N Engl J Med 2005; 352(3): 245-53
43. Anstey KJ, Luszcz MA, Giles LC, et al. Demographic, health, cognitive, and sensory variables as predictors of mortality in very old adults. Psychol Aging 2001; 16(1): 3-11 44. Elliott R. Executive functions and their disorders. Br Med Bull 2003; 65: 49-59
45. Desmond DW. The neuropsychology of vascular cognitive impairment: is there a specific cognitive deficit? J Neurol Sci 2004; 226(1-2): 3-7
46. WHO. Cardiovascular diseases. [electronic article]. http://www who int/mediacentre/factsheets/fs317/en/print html 2007.
47. Elias PK, Elias MF, D'Agostino RB, et al. Serum cholesterol and cognitive performance in the Framingham Heart Study. Psychosom Med 2005; 67(1): 24-30
48. Knopman D, Boland LL, Mosley T, et al. Cardiovascular risk factors and cognitive decline in middle-aged adults. Neurology 2001; 56(1): 42-8
49. Singh-Manoux A, Marmot M. High blood pressure was associated with cognitive function in middle-age in the Whitehall II study. J Clin Epidemiol 2005; 58(12): 1308-15
50. Mukamal KJ, Kuller LH, Fitzpatrick AL, et al. Prospective study of alcohol consumption and risk of dementia in older adults. JAMA 2003; 289(11): 1405-13 51. WHO. Fruit and vegetables for health. Report of a joint FAO/WHO workshop.
[electronic article]. http://www who
Table 1. Socio-demographic characteristics of participants at baseline as a function of score of unhealthy behaviors, the Whitehall II study (United-Kingdom), 1985-1988 (N=5123).
a Unhealthy behaviors correspond to: current smoking, alcohol abstinence, low physical activity and
eating fruits or vegetables less than two times a day.
Number of unhealthy behaviors at Phase 1a
0 1 2 3 4
% (N) 8.4 (433) 41.0 (2100) 38.3 (1962) 11.2 (574) 1.1 (54)
Socio-demographic variables
Age (Mean (SD)) 43.9 (5.8) 44.0 (6.0) 44.2 (6.0) 44.0 (6.0) 45.2 (5.9) Women (% (N)) 30.3 (131) 21.1 (442) 28.9 (567) 45.6 (262) 53.7 (29) Low employment grade (% (N)) 9.0 (39) 7.4 (156) 13.1 (256) 31.9 (183) 37.0 (20)
Cognitive scores (mean (SD))
Memory, range 0-20 7.2 (2.3) 6.9 (2.4) 6.8 (2.4) 6.5 (2.5) 6.1 (2.3) AH4-I, range 0-65 46.7 (9.5) 45.9 (9.6) 44.5 (10.7) 39.1 (11.7) 37.5 (12.9) Semantic fluency, range 0-34 16.6 (3.9) 16.2 (6.1) 15.7 (4.0) 14.6 (4.0) 14.4 (4.3) Phonemic fluency, range 0-33 16.5 (3.8) 16.0 (3.8) 15.7 (3.7) 14.6 (3.9) 14.4 (3.6)
Poor cognitive function (% (N))
Poor executive function 12.5 (54) 17.6 (370) 20.2 (397) 32.2 (185) 33.3 (18) Poor memory (score<5) 11.6 (50) 14.7 (308) 15.6 (305) 21.4 (123) 27.8 (15)
Table 2. Association between individual health behaviors through the follow-up with poor executive function and memory at Phase 7, the Whitehall II study (United-Kingdom), 1985-2004 (N=5123). b
Long-term association
(health behaviors at Phase 1) (health behaviors at Phase 5) Short-term association (health behaviors at Phase 7) Cross-sectional association
N % OR 95% CI N % OR 95% CI N % OR 95% CI EXECUTIVE FUNCTION Current smoking No Yes 4428 695 86.413.6 1.27 1 1.03, 1.56a 4670 453 91.28.9 1.30 1 1.01, 1.67a 4742 381 92.6 7.4 1.29 1 0.98, 1.69
Alcohol consumption in unit/week
0 1-14 15+ 715 3081 1327 14.0 60.1 25.9 1.33 1 0.85 1.07, 1.64a 0.70, 1.04 726 2608 1789 14.2 50.9 34.9 1. 71 1 0.92 1.39, 2.10a 0.76, 1.10 774 2738 1611 15.1 53.4 31.5 1.65 1 0.88 1.35, 2.02a 0.73, 1.06 Physical activity c Low High 2721 2402 46.9 53.1 0.95 1 0.81, 1.11 2293 2830 44.855.2 1.19 1 1.01, 1.39a 2242 2881 43.8 56.2 1.19 1 1.02, 1.39a
Consumption of fruits and vegetable
Less than 2 times a day
2+ a day 4150 973 81.0 19.0 1.32 1 1.06, 1.64 a 3044 2079 59.4 40.6 1.60 1 1.36, 1.89 a 2964 2159 57.9 42.1 1.85 1 1.56, 2.19 a MEMORY Current smoking No Yes 4428 695 86.4 13.6 1.29 1 1.04, 1.60a 4670 453 91.2 8.9 1.21 1 0.93, 1.57 4742 381 92.6 7.4 1.34 1 1.01, 1.78a
Alcohol consumption in unit/week
0 1-14 15+ 715 3081 1327 14.0 60.1 25.9 1.06 1 1.02 0.85, 1.33 0.83, 1.23 726 2608 1789 14.2 50.9 4.9 1.34 1 0.96 1.08, 1.66a 0.80, 1.16 7742 738 1611 15.1 53.4 31.5 1.40 1 1.02 1.13, 1.73a 0.85, 1.24 Physical activity c Low High 2721 2402 46.9 53.1 1.09 1 0.93, 1.28 2293 2830 44.8 55.2 1.04 1 0.89, 1.23 2242 2881 43.8 56.2 1.28 1 1.09, 1.50a
Consumption of fruits and vegetable
ap<0.05
bEach model is adjusted for age, sex and SEP at the corresponding phase.
Table 3. Association between combination of health behaviors through the follow-up and poor executive function at Phase 7, the Whitehall II study (United-Kingdom), 1985-2004 (N=5123).a
Long-term association
(health behaviors at Phase 1) (health behaviors at Phase 5) Short-term association (health behaviors at Phase 7) Cross-sectional association Number and combinations of unhealthy
behaviors†
N OR (95% CI) N OR (95% CI) N OR (95% CI)
0 No unhealthy behavior 433 1074 1129
1 No alcohol
1 Low physical activity 1 <2 fruits/vegetable 1 Current smoking 1 unhealthy behavior 72 336 1666 26 2100 128 649 1271 55 2103 134 652 1249 46 2135 2 No alcohol & no physical activity
2 No alcohol & no fruit and vegetable 2 Low physical activity & <2 fruits/vegetable 2 Current smoking & no alcohol
2 Current smoking & no physical activity 2 Current smoking & no fruit and vegetable 2 unhealthy behaviors 70 215 1368 4 29 276 1962 127 149 1014 6 37 132 1465 137 154 931 7 21 98 1388 3 All unhealthy except smoking
3 All unhealthy except fruit and vegetable 3 All unhealthy except physical activity 3 All unhealthy except alcohol
4 unhealthy behaviors 268 3 29 274 54 258 3 15 165 40 254 9 18 136 37 3-4 unhealthy behaviors 628 1 2 3 4 5 6 7 481 1 2 3 4 5 6 7 471 1 2 3 4 5 6 7
Abbreviations: CI, confidence interval; OR, odds ratio.
a Results from 2 models: one with all combinations included in the model (blue squares); the other one with number of unhealthy behaviors included in the
model (black bold squares). All analyses were adjusted for age, sex and SEP (at the corresponding phase). The reference group was those with no unhealthy behaviors. Higher limits of confident interval were cut at 7.
Table 4. Association between combination of health behaviors through the follow-up and poor memory at Phase 7, the Whitehall II study (United-Kingdom), 1985-2004 (N=5123). a
Abbreviations: CI, confidence interval; OR, odds ratio.
a Results from 2 models: one with all combinations included in the model (blue squares); the other one with number of unhealthy behaviors included in the
model (black bold squares). All analyses were adjusted for age, sex and SEP (at the corresponding phase). The reference group was those with no unhealthy behaviors.
b Unhealthy behaviors correspond to: current smoking, alcohol abstinence, low physical activity and eating fruits or vegetables less than two times a day.
Long-term association
(health behaviors at Phase 1) (health behaviors at Phase 5) Short-term association (health behaviors at Phase 7) Cross-sectional association Number and combinations of unhealthy
behaviorsb
N OR (95% CI) N OR (95% CI) N OR (95% CI)
0 No unhealthy behavior 433 1074 1129
1 No alcohol
1 Low physical activity 1 <2 fruits/vegetable 1 Current smoking 1 unhealthy behavior 72 336 1666 26 2100 128 649 1271 55 2103 134 652 1249 46 2135 2 No alcohol & no physical activity
2 No alcohol & no fruit and vegetable 2 Low physical activity & <2 fruits/vegetable 2 Current smoking & no alcohol
2 Current smoking & no physical activity 2 Current smoking & no fruit and vegetable 2 unhealthy behaviors 70 215 1368 4 29 276 1962 127 149 1014 6 37 132 1465 137 154 931 7 21 98 1388 3 All unhealthy except smoking
3 All unhealthy except fruit and vegetable 3 All unhealthy except physical activity 3 All unhealthy except alcohol
4 unhealthy behaviors 268 3 29 274 54 258 3 15 165 40 254 9 18 136 37 3-4 unhealthy behaviors 628 1 2 3 4 5 6 7 481 1 2 3 4 5 6 7 471 1 2 3 4 5 6 7
Table 5. Cumulative effect of health behaviors over midlife (from Phase 1 to Phase 7) and poor executive function and memory at phase 7, the Whitehall II study (United-Kingdom), 1985-2004 (N=5123).b
Abbreviations: CI, confidence interval; OR, odds ratio.
a p<0.05.
b Number of times a participant reported an unhealthy behavior out of the time points (Phases 1, 5, and
7).
c Each model is adjusted for age, sex & SEP at Phase 1.
EXECUTIVE FUNCTION MEMORY N % OR 95% CI OR 95% CI Current smoking c 0 4337 84.7 1 1 1 339 6.6 1.08 0.81, 1.46 1.28 0.96, 1.71 2 151 2.9 1.42 0.95, 2.14 0.99 0.63, 1.56 3 296 5.8 1.29 0.94, 1.75 1.39 1.02, 1.90a p for trend 0.03 0.03 Alcohol abstinence c 0 3839 74.9 1 1 1 645 12.6 1.44 1.16, 1.80a 1.21 0.96, 1.53 2 347 6.8 1.57 1.19, 2.08a 1.36 1.02, 1.81a 3 292 5.7 2.02 1.51, 2.71a 1.32 0.97, 1.80 p for trend <0.0001 0.01
Low physical activity c
0 1380 26.9 1 1
1 1484 29.0 0.94 0.76, 1.16 1.14 0.92, 1.42 2 1324 25.8 1.09 0.86, 1.38 1.23 0.98, 1.55 3 935 18.3 1.19 0.96, 1.48 1.29 1.01, 1.65a
p for trend 0.06 0.03
Eating fruits & vegetables less than 2 times a day c 0 609 11.9 1 1 1 1125 22.0 1.42 1.00, 2.03a 1.17 0.85, 1.61 2 1134 22.1 2.02 1.43, 2.84a 1.35 0.99, 1.85 3 2255 44.0 2.38 1.72, 3.29a 1.38 1.03, 1.86 a p for trend <0.0001 0.02
Cumulative score of unhealthy behaviors c 0-2 1222 23,9 1 1 3-5 2708 52.9 1.58 1.27, 1.98a 1.51 1.21, 1.88a 6-8 1022 19,9 2.52 1.96, 3.24a 1.64 1.27, 2.13a 9-12 171 3,3 2.87 1.90, 4.32a 2.01 1.32, 3.08a p for trend <0.0001 <0.0001