HAL Id: hal-02372119
https://hal.archives-ouvertes.fr/hal-02372119
Submitted on 20 Nov 2019HAL is a multi-disciplinary open access archive for the deposit and dissemination of sci-entific research documents, whether they are pub-lished or not. The documents may come from teaching and research institutions in France or abroad, or from public or private research centers.
L’archive ouverte pluridisciplinaire HAL, est destinée au dépôt et à la diffusion de documents scientifiques de niveau recherche, publiés ou non, émanant des établissements d’enseignement et de recherche français ou étrangers, des laboratoires publics ou privés.
Jean-Claude Pineau, Mustapha Bouslah
To cite this version:
Jean-Claude Pineau, Mustapha Bouslah. Prediction of body fat in male athletes from ultrasound and anthropometric measurements versus DXA. Journal of Sports Medicine and Physical Fitness, Edizione Minerva Medica, 2019, �10.23736/S0022-4707.19.09985-7�. �hal-02372119�
1 Prediction of body fat in male athletes from ultrasound and anthropometric measurements versus DXA
Short title : Prediction of body fat
*PINEAU Jean-Claude (corresponding author)
CNRS - Babel- FRE 2029- Faculté de Chirurgie Dentaire, 1 rue Maurice Arnoux 92120 Montrouge, France.
jean-claude.pineau@parisdescartes.fr
BOUSLAH Mustapha
University Paris-Descartes, Faculté de Chirurgie Dentaire, 1 rue Maurice Arnoux 92120
2 Prediction of body fat in male athletes from ultrasound and anthropometric measurements versus DXA
Original article
Abstract
Background: To compare the accuracy of body fat percentage (BF%) measured by an
ultrasound portable device and anthropometric measurements with a Dual Energy X-ray Absorptiometry (DXA) as the reference technique in male athletes.
Methods: A total of 100 athletes: 16 boxers, 4 rowers, 5 gymnasts, 6 base ball players, 19
judo players, 10 taekwondo players, 7 basket-ball players, 21 wrestlers, 6 cyclists on track and 6 karate expert aged from 18 to 30 years participated. All athletes were selected from the French National Institute of Sports and Physical Education . Ultrasound measurements were made with a sonographic US BOX at the mid-thigh level. We developed a multi -linear model of body fat estimation from ultrasound and anthropometric dimensions (height, weight, waist circumference) using the DXA reference method. A cross-validation study was then performed with this linear regression on 62 males athletes proportionally stratified across the sports.
Results: The best accuracy of BF was obtained using a multi-linear model from ultrasonic
and anthropometric measurements with a concordance correlation ρc = 0.941. This model
was then used to estimate BF on the 62 males athletes. The concordance correlation ρc=
0.931 and SEE =1.60. The 95% limits of agreement for individual BF% were [-4.1;3.6%] with symmetrically distributed deviations.
Conclusions: Comparing to DXA, ultrasonic and anthropometric measurements are both
accurate techniques to estimates BF%. Our results suggest that this regression model is practical to apply to different sports.
3 Key-words: Body fat mass, ultrasound, anthropometry, DXA, male athletes.
Introduction
In sport disciplines with weight categories assessment of body composition will help to optimize competitive performance and therefore is of considerable interest [1,2]. Excess BF may negatively affect performance [3]. The weight loss is difficult to regulate for many athletes because it often results in poorer performances [4]. Therefore the knowledge of body composition in relation to total body fat (BF) is required. Body composition is usually evaluated by measuring fat mass and fat free mass then using these values to compute the body fat percentage (%BF) [5]. The body composition giving body size and configuration is described by anthropometric measures such as body weight, body mass index (BMI), circumferences, skinfold thicknesses [6,7]. Dual energy X-ray absportiometry (DXA) which measures three components (fat mass, lean mass and bone mass) in the full body is considered as a reference technique for measuring body composition due to its high precision and accuracy compared with other body composition assessments [8]. Indeed, DXA provide precise and reliable measurement of body composition and has low radiation emission. Other indirect prediction methods such as bioelectrical impedance analysis and air displacement plethysmography are commonly used to assess body composition. However, BF% estimates from these techniques versus DXA presents a skew of the mean values higher than 2% and a large standard error of estimate [9,10].
Pritchard [11] indicated that total body fat mass values obtained by DXA are very well correlated with the 4-C reference model described by Wang [12]. Ultrasound technique can also be used to estimates the body fat mass with a high accuracy. [13-15]. In a previous study [16], we have developed a new model to predict fat mass in 93 athletes from a
4
combination of anthropometric dimensions and ultrasound measurements at the abdomen and mid-thigh with higher correlation to the BF% DXA .
In this study, we aimed to determine the whole body fat with high accuracy in young male athletes by using different anthropometric and ultrasonic equations. Here, we use a A-mode ultrasound to measure the subcutaneous adipose tissue thickness of the thigh and umbilical level and anthropometric variables as the main predictors according to the reference method DXA. A cross-validation study between ultrasound technique with anthropometry dimensions and DXA was then performed using the multiple regression linear model.
Materials and methods
Study participants
This study was conducted at the National Institute of Sports and Physical Education (INSEP), Paris, France. We studied 100 males of national level recruited at INSEP with 16 boxer, 4 rowers, 5 gymnasts, 6 base ball players, 19 judokas, 10 taekwondo players, 7 basket-ball players, 21 wrestlers, 6 cyclists on track and 6 karate experts aged from 18 to 30 years. We only included well-trained athletes and all weight categories from super-light to heavy were represented. After being informed about the purpose of this study, all athletes signed a written consent form in accordance with the Declaration of Helsinki as revised in 2008. The study protocol was approved by the regional ethics committee for healthy volunteers. For each athlete examined, ultrasonic and anthropometric measurements as well as BF DXA (kg) were simultaneously recorded on the same day.
A Cross-validation between the ultrasound technique with anthropometry and DXA was performed on 62 males of national level recruited at INSEP with 10 boxer, 2 rower, 3 gymnast, 4 base ball players, 11 judokas, 6 taekwondo players, 5 basket-ball players, 14
5
wrestlers, 3 cyclists on track and 4 karate expert aged from 18 to 30 years proportionally stratified across the sports.
Anthropometric measurements
Anthropometric variables were recorded by the same operator using standard techniques [17]. Body weight was measured to the nearest 0.1 kg using a calibrated scale (HD-372, Tanita Neuilly sur-Seine, SA , France and height to the nearest 0.5 cm using a stadiometer (Holtain, Crosswell, UK). Body Mass Index (BMI) in kg/m² was calculated as weight (kg)/height² (m). Waist circumference (WC) in cm was measured at umbilical level. BMI and WC are often associated with metabolism risk factors [7]. Sun et al. [18] also indicated that the validity of simple anthropometric measures such as BMI and waist circumference is comparable to DXA measurements of BF% as assessed by their correlation with obesity -related risk factors for cardiovascular disease.
Ultrasound device
Ultrasound measurements were taken using a sonographic US BOX in A-mode (Lecoeur Electronique, Chuelles, France) [19]. The ultrasonic technique can be used to measure the thickness of fat between the skin and the muscle. A transducer probe emits through the skin, an ultrasonic wave, part of which is reflected in the fat-muscle interface. MRI was used to determine the repartition of the subcutaneous adipose tissue on a single side transverse slice at the umbilical level and at mid-thigh. We selected two anatomical areas: the intra-abdominal area and the mid-thigh area (Figure 1) which gives the better correlation ship with the body fat mass DXA. Subcutaneous fat was located in a horizontal plane with an approximately 45° vertebral axis at the umbilical level, in the middle of the knee, and at the top of the thigh interiorly. Mid-thigh subcutaneous fat thickness is the mean fat thickness of right and left side Abdominal and mid-thigh subcutaneous fat was measured using a
5.0-6
MHz linear array probe. A probe diameter of 0.75 in (1.90 cm) is the most suitable in terms of positioning, location, orientation, contact, and pressure. We obtained highly reliable, repeated measurements of fat thickness with 2 examiners with an intra-class correlation above 0.97.
Figure 1: Measurement points at umbilical level (right and left back) and at mid-thigh level using a 5.0 MHz linear array probe.
Dual energy X-ray absorptiometry
Total body fat (BF, kg) was measured using a whole-body DXA (Hologic QDR 4500, Waltham Massachusetts, USA). The DXA method uses an X-ray tube with a filter to 40 kV and high-energy (100 kV). The DXA machine was calibrated daily to a lumbar spine phantom for bone density and to a tissue bar for Fat-free-mass. Scan time for a total body measurement is approximately 7 minutes. DXA machine produces highly accurate BF and BF% values according to the 4-C model [11]. The body weight of each athlete can also be calculated.
Statistical analysis
Means and standard deviations were calculated for each variable of interest. We developed a series of multi-linear regressions to predict BF of the DXA measured fat mass as a
7
dependent variable in relation to the anthropometric and ultrasonic measures as predictor variables. The relationships between BF% DXA and BF% estimate according to the techniques used (anthropometry and ultrasound) were examined using paired t-tests. The accuracy of BF prediction was evaluating from the concordance correlation using the formula ρc = ρ Cb with Cb = ( [(v+1/v)+u²]/2 )1/2 ; v=SD1 /SD2 ; u =(μ1 -μ2 )√SD1 SD2 were
ρc is the Pearson correlation. We used the variance inflation factors VIF= 1/(1-R²) to test the
co-linearity. Agreement between BF% estimate and BF% DXA of the 62 males athletes was examined by calculating the 95% limits of agreement as described by Bland and Altman [20]. For all analyses, P value smaller than 0.05 were considered significant. All statistical analyses were carried out with the Statistical software (Stat soft, Tulsa, OK, USA).
Results
Anthropometric and ultrasonic prediction equations for body fat mass
The descriptive statistics is given in Table 1. All variables showed a great variability and range.
Variables Mean (n=100) ± SD Range CV% Body mass (kg) 75.1 ± 14.8 41 - 137 Height (cm) 177.8 ± 9.6 155 -206 BMI (kg/m²) 23.6 ± 3.1 16.6 - 35.7 Waist (cm) 80.3 ± 8.5 66 - 121 Umbilical thickness of fat(mm) 11.3 ± 5.6 2.2 - 42 Mid-thigh thickness of 7.1 ± 2.5 2.0 - 14.5 fat (mm) BF DXA (kg) 7.0 ± 4.3 3.3 - 31.7 61.4 BF % DXA 9.0 ± 3.4 4.7 - 23.2 37.7
8
The proposed anthropometric and/or ultrasonic equations to predict BF are shown in Table 2. For all equations from 1 to 7, the variance inflation factors (VIF) is less than 10 and the tolerance is greater than 0.1. So, we consider that we have no problem of co-linearity between the variables.
The simplest model including BMI explained only 46% of the variation of BF. Adding BMI² and waist circumference in the model significantly increased the R² from 46 to 89 % and decreased SEE from 3.18 to 1.47. Moreover addition of ultrasonic measurement as mid-thigh area significantly increased the R² from 0.46 to 0.89 (p<0.01). The concordance correlation calculated with the equation 6 is ρc = 0.941. We observed that the thickness of fat at umbilical level does not make a significant contribution in the equation 5.
Moreover the introduction of the specific sport variable does not provide additional precision in body fat estimate (equation 7).
intercept BMI BMI² Waist UT 1 UT 2 Spec. R² SEE VIF kg/m² (cm) (Cm) (cm) Sport Anthropometry Equation 1 -15.3 0.946 0.46 3.18 1.9 Equation 2 63.7 -5.56 0.132 0.73 2.28 3.7 Equation 3 32.64 -4.29 0.093 0.288 0.80 1.97 5.0 Ultrasound Equation 4 -2.32 0.633 0.63 2.64 2.7 Ultrasound and anthropometry Equation 5 47.32 5.09 0.111 0.156 0.638 -0.017 0.89 1.48 9.1 Equation 6 46.19 -4.99 0.109 0.154 0.627 0.89 1.47 9.1 Equation 7 46.12 -4.95 0.108 0.151 0.627 -0.03 0.89 1.48 9.1
Table 2 : Anthropometric and ultrasonic prediction equations for body fat mass in the 100 male athletes (UT1 is mid-thigh thickness of fat; UT2 is umbilical thickness of fat).
The multiple linear regression equation to produce BF estimate with anthropometry and ultrasonic measurement is:
9
with a concordance correlation ρc= 0.941. Pearson correlation R²=0.89 and SEE =1.47.
Predict BF% = 100 BF(kg) estimated /Body mass (kg).
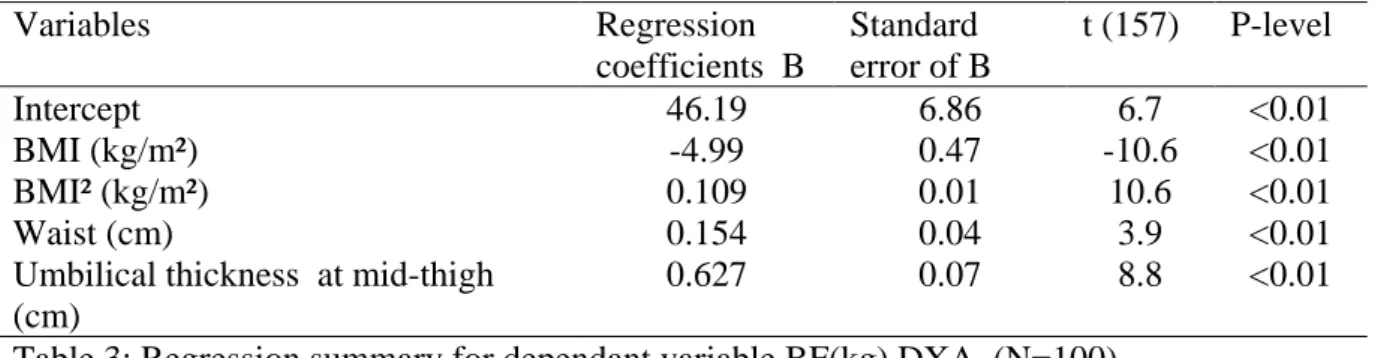
The regression coefficients of the BF(kg) estimated by anthropometric and ultrasonic measurements versus BF DXA (kg) are all significant with p-level <0.01 (Table 3).
Variables Regression coefficients B Standard error of B t (157) P-level Intercept 46.19 6.86 6.7 <0.01 BMI (kg/m²) -4.99 0.47 -10.6 <0.01 BMI² (kg/m²) 0.109 0.01 10.6 <0.01 Waist (cm) 0.154 0.04 3.9 <0.01
Umbilical thickness at mid-thigh (cm)
0.627 0.07 8.8 <0.01 Table 3: Regression summary for dependant variable BF(kg) DXA (N=100)
When comparing the remaining athletes, BF% determined by the equation 6 showed using the Paired t-test a non significant difference compared with DXA.
Mean bias for BF% = -0.004 ± 1.8 (P= 0.98).
Cross-validation study
The characteristic of the 62 males athletes is given in Table 4.
Variables Mean (n=62) ± SD Range CV% Body mass (kg) 75.3 ± 16.5 47 - 130 Height (cm) 177.1 ± 11.4 155 -216 BMI (kg/m²) 23.8± 3.0 18.2 - 34.0 Mid-thigh thickness of 7.7 ± 3.0 2.5 - 18.0 fat (mm) BF DXA (kg) 7.3 ± 4.5 3.0 - 29.7 61.6 BF % DXA 9.4 ± 3.3 4.8 - 24.8 35.1
10
BF and BF% estimate from the equation 6 gives us the relation: BF DXA estimate = 7.2 ± 4.8 kg and BF % DXA = 9.1 ± 3.6
The concordance correlation ρc= 0.931. Pearson correlation R²=0.87 and SEE =1.60.
Individual BF% differences between BF% estimate and BF% DXA from the equation 6 are illustrated by the figure 2. The Bland and Altman plot (Figure 2) demonstrated small limits of agreement, ranging from [-4.1;3.6]BF%. This plot showed a high level of accuracy for the BF% with a symmetric dispersion around the mean difference (BF%=-0.26 ± 1.97; P=0.29). Figure 2 also indicates that no bias was present (P=0.18).
Figure 2: Residual comparisons plotting differences between BF% DXA and BF% UT and AP (equation 6) Spe 1: rower ; Spe 2: baseball; Spe 3: basket-ball; Spe 4: boxer Spe 5: cyclists; Spe 6: gymnast; Spe 7: judo; Spe 8: karate; Spe 9: wrestlers; Spe 10: taekwondo.
11 Discussion
Body composition analysis is currently used in clinics and in sports medicine. Reference methods such as DXA can provide accurate results. However this method is costly and largely inaccessible to coaches in routine. For this reason, we developed anthropometric and/or ultrasonic prediction equations to estimate body fat mass percent fat mass using a sample of 100 males of national level ranging widely in BMI (16.6-35.7 kg/m²) and BF DXA (3.3-31.7 kg).
BMI and waist circumference are simple anthropometric measures with an inter operator accuracy lower than 1%. The use of BMI is largely inaccurate method for estimating BF% in weight-class male athletes with a R²=0.46 and SEE=3.18. The anthropometric equation 3 with BMI, BMI² and waist which is the most practical equation showed valid results with high predictive ability (R²=0.80, SEE=1.97). Moreover, the addition of anthropometric measurements with ultrasonic measurement at mid-thigh (equation 6) gives us a better prediction of body fat mass versus DXA (ρc =0.942, P<0.05 and SEE=1.52).
A cross-validation was performed on 62 males athletes proportionally stratified across the specific sports. The predicted value of BF% estimate from the equation 6 was accuracy with a concordance correlation of ρ =0.931 (P<0.05) and the SEE =1.6 is ideal according to the Lohman classification [21] . This author indicated that the SEE must be less than 3% for a new method to be accepted as accurate.
The 95% limits of agreement as described by Bland and Altman are relatively small [-3.8;+3.5%] with a mean difference of -0.26%. (P=0.29). We observed that our model of
12
Heyward & Wagner [22] recommended that the correlation coefficient for body fat predictions equations should excess 0.8 and the limits of agreement should within 5% when compared the reference method.
Anthropometric measurements as skinfold thicknesses have currently used for predicting body density and %BF. Novack et al. [23] developed novel mathematical models to predict BF% in 31 male professional soccer players using skinfold thicknesses measurements versus DXA as a reference method with a R²=0.86 and SEE=1.6. Oliver et al. [24] have developed multiple regression equations using standard anthropometric measurements as skinfold thicknesses and abdominal circumference to estimate %fat in 157 collegiate football players because equations developed to predict BF% have been shown to be population specific and might not be accurate for football athletes. Silva et al. [25] indicated that the skinfold equations developed by Jackson and Pollock did not accurately track body composition changes in elite male judo athletes. Shakeryan et al. [26] compared the BF% through skinfold thickness using Lohman's method and BIA using hydrostatic as a standard method. Theirs results showed that Lohman's skinfold-thickness method is not valid because there is a significant difference between averages of Lohman's three-point method in wrestlers.
Several studies have compared anthropometric equations with bioelectrical impedance analysis (BIA) in the estimation of body fat. Martin Moreno et al. [27] observed that anthropometric equations provided different body fat estimates than those derived from skin-fold measurements and BIA. Aristizabal et al. [28] compared anthropometric methods with BIA in estimating percent body fat. They observed that the anthropometric methods showed higher values. Porta et al. [29] observed that in males, the level of agreement between the anthropometric method and the four BIA device was poor to moderate. Stewart et al. [30] established a prediction of fat and fat free mass in male athletes using DXA as reference method. The equation of Ball et al. [31] using seven skin-folds showed the highest
13
level of agreement. However, BIA and anthropometric techniques are not interchangeable in ultra-endurance athletes.
Wagner et al. [32] evaluated the validity and reliability of the BodyMetrixTM BX2000 A- mode ultrasound for estimating percent body fat (%BF) in 45 athletes by comparing it to skinfolds and the BOD POD. Linear regression using the BF% estimate from ultrasound to predict %BF from BOD POD resulted in R²=0.849, SEE=2.6BF%. As observed by the authors and despite a very homogeneous BMI (24.1 ±2.4), the validity of the this method is questionable, particularly for female athletes. Bielemann et al. [33] developed equations to estimate body fat based on anthropometric measurements of subcutaneous fat thickness and muscle thickness measured by A-mode ultrasound (BodyMetrix) in Brazilian adults. Lower and upper 95% limits of agreement were [-6.5%-6.7%]. Leahy et al. [15] found UT to accurately predict BF% in 83 sedentary young men with an SEE=1.9% and 95% limits of agreement of [-3.6;+3.8%]. Ultrasound has been also used to predict the body density of sumo wrestlers [34] and the body fat mass of prepubertal Japanese children [35]. Utter and Hagger [36] showed that the ultrasound estimates of fat-free mass was significantly correlated with the estimate from hydrostatic weighing (r=0.97). Ripka et al. [37] showed that ultrasound applied in a specific regression for BF% prediction in 71 adolescents has a strong correlation (r=0.848) with DXA.
Conclusions
The multiple regression linear model established in the present study from simple anthropometric measurements (height, weight and waist circumference) accurately predicts BF% according to the reference DXA method. The use of the ultrasonic technique giving a non invasive measurement of the thickness at mid-thigh makes a significant improvement of the prediction of the BF% with a concordance correlation of ρc=0.931 and SEE=1.60.
14
Our results suggest that our anthropometric and ultrasonic model should be easy use in different sports with weight categories. It should be validated on different samples of athletes.
References
1 Ackland TR, Lohman TG, Sundgot-Borgen J, Maughan RJ, Meyer NL, et al. Current status of body composition assessment in sport: review and position statement on behalf of the ad hoc research working group on body composition health and performance, under the auspices of the I.O.C. Medical Commission. Sports Med. 2012;42:227-249.
2 Malina RM. Body composition in athletes: assessment and estimated fatness. Clin Sports Med. 2007;26:37-68.
3 Manore MM. Weight measurement for athletes and active individuals: a brief review. Sports Med 2015; 45(suppl 1) S83-S92.
4 Turocy PS, DePalma BF, Horswill CA, Laquale KM, Martin TJ, Perry AC, Somova MJ, Utter AC. National athletic trainers'association position statement safe weight loss and maintenance practices in sport and exercice. J Ath Train. 2011;46:322-336.
5 Andreoli A, Garaci F, Cafarelli FP, Guglielmi G. Body composition in clinical practice. Eur. J. of Radiol. 2016;85:1461-1468.
6 Jackson AS, Ellis KJ, Mc FarlinBK, Sailors MH, Bray MS. Cross-validation of generalised body composition equations with diverse young men and women: the training intervention and genetics of exercice response (TIGER) study. Br J Nutr 2009; 101:871-878.
15
7 Cui Z, Truesdale KP, Cai J, Koontz MB, Stevens J. Anthropometric indices as measures of body fat assessed by DXA in relation to cardiovascular risk factors in children and adolescents: NHANES 1999-2004. Int J Body Composition Research. 2013; 11:85-96.
8 Imboten MT, Welch WA, Swartz AN, Montoye AHK, Finch HW, Harber MP, Kaminsky LA. Reference standards for body fat measures using GE dual energy x-ray absorptiometry in Caucasian adults. Plos One 2017; 12: e0175110.
9 Ferri-Morales A, Nascimento-Ferreira MV, Vlachopoulos D, Ubago-Guisado E, Torres-Costoso A, De Moraes ACF, Barker AR , Moreno LA, Martinez-Vizcaino V, Gracia-Marco L. Agreement between standard body composition methods to estimate percentage of body fat in young male athletes. Ped.Exerc. Sci. https://doi.org/10.1123/pes 2017-0171.
10 Svantesson U, Zander M, Klingber S, Slinde F. Body composition in male elite athletes, comparison of bioelectrical impedance spectroscopy with dual energy X-ray absorptiometry. Journal of Negative Result in Biomedicine. 2008; 7:1-5.
11 Pritchard JE, Nowson CA, Strauss BJ, Carlson JS, Kaymakci B, WarkJD. Evaluation of dual energy X-ray absorptiometry as a method of measurement of body fat. Eur J Clin Nutr 1993 ; 47 : 216-28.
12 Wang Z, Pi-Sunyer FX, Kotler DP, Wielopolski L, Withers RT, Pierson RN Jr, et al. Multicomponent methods: evaluation of new and traditional soft tissue mineral models by in vivo neutron activation analysis. The American journal of clinical nutrition 2002; 76:968– 74.
13 Wagner DR, Cain DL, Clark W. Validity and reliability of A-mode ultrasound for body composition assessment of NCAA division I athletes. Plos One. 2016;11:e0153146.
16
14 Hyde P. Utilization of B-mode ultrasound as a body fat estimate in collegiate football players 2015. Electronic these & dissertations. 1282. https://digitalcommons.georgiasouthern.edu/etd/1282.
15 Leahy S, Toomey C, Mc Creesh K, O'Neill C, Jakeman P: Ultrasound measurement of subcutaneous adipose tissue thickness accurately predicts total and segmental body fat of young adults. Ultrasound Med Bio 2012; 38: 28-34.
16 Pineau JC, Gilliard JR, Bocquet M. Validation of ultrasound techniques applied to body fat measurement in male and female athletes. J Atheltic Train. 2009;44: 142-147.
17 Marfell-Jones M, Olds T, Stewart A, Carter L: International Standards for Anthropometric Assessment. Potchefstroom, SA: The International Society for the Advancement of Kinanthropometry (ISAK) Potchefsroom, South Africa 2006.
18 Sun Q, van Dam RM, Spiegelman D, Heymsfield SB, Willett WC, Hu B: Comparison of dual-energy X-ray absorptiometric and anthropometric measures of adiposity in relation to adiposity-related biologic factors. Am J Epidemiol 2010;172: 1442–1454.
19 Pineau JC, Guihard-Costa AM, Bocquet M: Validation of ultrasound techniques applied to body fat measurement. Ann Nutr Metab 2007; 51:421-427.
20 Bland JM, Altman DG. Statistical methods for assessing agreement between two methods of clinical measurement. Lancet. 1986;1:307-310.
21 Lohman TG, Roche AF, Martorell R. Anthropometric Standardization Reference Manual. Champaign, IL: Human Kinetics; 1988:56–68.
22 Heyward VH, Wagner DR. Applied body composition assessment. Champaign, IL: Human Kinetics; 2004.
17
23 Novack LF, Ferreira GA, Coelho RL, Osiecki R. Novel equations to predict body fat percentage of Brasilian professional soccer players: a case study. Motriz, Rio Claro 2014; 20: 402-407.
24 Oliver JM, Lambert BS, Martin SE, Green JS, Crouse SF. Predicting collegiate football player DEXA body composition using standard measures. Journal of Athletic Training. 2012;47: 257-263.
25 Silva AM, Fields DA, Heymsfield SB, Sardinha LB. Body composition and power changes in elite judo athletes. Int J Sports Med. 2010;31:737-741.
26 Shakeryan S, Nikbakht M, Bayat-Kashkoli H. Validation of percent body fat using skinfold-thickness, bioelectrical impedance analysis and standard hydrostatic method in male wrestlers. J Pub Health Epidem. 2013;51:15-9
27 Martin Moreno V, Gomez Gandoy JB, Antoranz Gonzales MJ. Measurement of body fat with bioelectric impedance, skinfold thickness, and equations based on anthropometric measurements. Comparative analysis. Rev Esp Salud Publica. 2001;75:221-236.
28 Aristizabal JC, Restrepo MT, Estrada A. Body composition assessment by anthropometry and bioelectrical impedance. Biomedica. 2007;27:216-224.
29 Porta J, Bescos R, Irurtia A, Cacciatori E, Vallejo L. Assessment of body fat in physically active young people: anthropometry vs bioimpedance. Nutr Hosp. 2009;24:529-534.
30 Stewart AD, Hannan WJ. Prediction of fat and fat-free mass in male athletes using dual X-ray absorptiometry as a reference method. J Sports Sci. 2000;18: 263-274.
18
31 Ball SD, Altena TS, Swan PD. Comparison of anthropometry to DXA: a new prediction equation for men. Eur J Clin Nutr. 2004;58:1525-1531.
32 Wagner DR, Cain DL, Clark W. Validity and reliability of A-mode ultrasound for body composition assessment of NCAA division I athletes. Plos One. 2016;11:e0153146
33 Bielemann RM1, Gonzalez MC2, Barbosa-Silva TG3, Orlandi SP4, Xavier MO3, Bergmann RB5, Assunção MC3; Grupo de Estudos em Composição Corporal e Nutrição-CoCoNut. Nutrition. 2016;32(4):441-446.
34 Saito K, Nakaji S, Umeda T, Shimoyama T, Sugawara K, Yamamoto Y: Development of predictive equations for body density of sumo wrestlers using B-mode ultrasound for the determination of subcutaneous fat thickness, British Journal of Sports Medicine 2003; 37: 144–148.
35 Midorikawa T, Ohta M, Hikihara Y, Torii S, Bemben MG, Sakamoto S: Prediction and validation of total and regional fat mass by B-mode ultrasound in Japanese pre-pubertal children. British Journal of Nutrition 2011;106:944–950.
36 Utter AC, Hager ME. Evaluation of ultrasound in assessing body composition of high school wrestlers. Med Sci Sports Exerc 2008;40: 943-948.
37 Ripka WL, Ulbricht L, Eng Dr, Menghin L, Gewehr PM: Portable A-mode ultrasound for body composition assessment in adolescents. J Ultrasound Med. 2016;35:755-760.