HAL Id: hal-03051741
https://hal.archives-ouvertes.fr/hal-03051741
Submitted on 10 Dec 2020
HAL is a multi-disciplinary open access
archive for the deposit and dissemination of
sci-entific research documents, whether they are
pub-lished or not. The documents may come from
teaching and research institutions in France or
abroad, or from public or private research centers.
L’archive ouverte pluridisciplinaire HAL, est
destinée au dépôt et à la diffusion de documents
scientifiques de niveau recherche, publiés ou non,
émanant des établissements d’enseignement et de
recherche français ou étrangers, des laboratoires
publics ou privés.
Whooping cough dynamics in Chile (1932–2010): disease
temporal fluctuations across a north-south gradient
Mauricio Lima, Sergio Estay, Rodrigo Fuentes, Paola Rubilar, H. Broutin,
Gerardo Chowell-Puente
To cite this version:
Mauricio Lima, Sergio Estay, Rodrigo Fuentes, Paola Rubilar, H. Broutin, et al.. Whooping cough
dynamics in Chile (1932–2010): disease temporal fluctuations across a north-south gradient. BMC
Infectious Diseases, BioMed Central, 2015, 15 (1), �10.1186/s12879-015-1292-2�. �hal-03051741�
R E S E A R C H A R T I C L E
Open Access
Whooping cough dynamics in Chile
(1932
–2010): disease temporal fluctuations
across a north-south gradient
Mauricio Lima
1,2*, Sergio A. Estay
2,3, Rodrigo Fuentes
4, Paola Rubilar
4, Hélène Broutin
5and Gerardo Chowell-Puente
6Abstract
Background: The spatial-temporal dynamics of Bordetella pertussis remains as a highly interesting case in infectious disease epidemiology. Despite large-scale vaccination programs in place for over 50 years around the world, frequent outbreaks are still reported in many countries.
Methods: Here, we use annual time series of pertussis incidence from the thirteen different regions of Chile (1952–2010) to study the spatial-temporal dynamics of Pertussis. The period 1975–1995 was characterized by a strong 4 year cycle, while the last two decades of the study period (1990–2010) were characterized by disease resurgence without significant periodic patterns.
Results: During the first decades, differences in periodic patterns across regions can be explained by the differences in susceptible recruitment. The observed shift in periodicity from the period 1952–1974 to the period 1975–1995 across regions was relatively well predicted by the susceptible recruitment and population size. However, data on vaccination rates was not taken into account in this study.
Conclusions: Our findings highlight how demography and population size have interacted with the immunization program in shaping periodicity along a unique latitudinal gradient. Widespread B. pertussis vaccination appears to lead to longer periodic dynamics, which is line with a reduction in B. pertussis transmission, but our findings indicate that regions characterized by both low birth rate and population size decreased in periodicity following immunization efforts.
Keywords: Pertussis, Latitudinal gradient, Susceptible recruitment, Cycles, Vaccination Background
Whooping cough, mainly due to Bordetella pertussis, remains an important public health problem worldwide although large-scale vaccination campaigns have been carried out for over 50 years. For this purpose, it is cru-cial to increase our understanding of the interplay of changing susceptibility and demographic factors [1, 2]. Despite long-term vaccination efforts around the world, vaccination rates varied within and between countries, hence, pertussis remains endemic, and frequent outbreaks
are still reported in many countries [3]. For instance, the United States experienced in 2012 one of the largest out-breaks of reported pertussis in 50 years [4]. Moreover, per-tussis has been resurging in several countries with a long history of high levels of vaccination [5–7]. In particular, this increase has been associated with a shift in the average age of cases toward older age groups [7–10].
From a dynamical systems point of view, pertussis is characterized by a dominant cyclic pattern with a period ranging from ~3.5 to 5 years [11] during the vaccination period [1, 11]. This pattern is largely driven by variability in population immunity resulting from natural infection or vaccination campaigns as well as other factors including the rate of recruitment of new susceptible individuals in the population and the social contact network structure
* Correspondence:mlima@bio.puc.cl
1Departamento de Ecología, Pontificia Universidad Católica de Chile, Casilla
114-D, Santiago 6513677, Chile
2Center of Applied Ecology and Sustainability (CAPES), Santiago, Chile
Full list of author information is available at the end of the article
© 2015 Lima et al. Open Access This article is distributed under the terms of the Creative Commons Attribution 4.0 International License (http://creativecommons.org/licenses/by/4.0/), which permits unrestricted use, distribution, and reproduction in any medium, provided you give appropriate credit to the original author(s) and the source, provide a link to the Creative Commons license, and indicate if changes were made. The Creative Commons Public Domain Dedication waiver (http://creativecommons.org/publicdomain/zero/1.0/) applies to the data made available in this article, unless otherwise stated.
[2, 10, 11]. Importantly, the cyclic signature of pertussis dynamics has been reported in countries with different climatological conditions, socio-demographic charac-teristics and vaccination history [10]. This suggests that the determinants of pertussis dynamics such as the interplay of vaccination and demographic factors re-mains poorly understood. In this vein, most of the com-parative analyses of pertussis dynamics come from time series data of particular countries [3, 11]. Furthermore, incidence data are typically analyzed at the national scale despite large geographic differences in socio-demographic conditions and spatial distribution of the population within the country’s borders [8, 12]. For example, the spatial dynamics of pertussis in Senegal are characterized by a transmission wave from urban centers toward rural areas, which suggests the import-ance of population size and density in epidemic timing [13]. This pattern is reminiscent of the traveling waves that exemplify measles in England and Wales [14, 15].
In this paper, we use long-term epidemiological time series data of pertussis incidence covering thirteen geographic regions of Chile together with statistical methods in order to analyze and disentangle the population dynamic patterns in Chile, a unique coun-try spanning an extensive latitudinal gradient with a var-iety of climatic zones. Specifically, we explore the spatial and temporal dynamics of pertussis across this large lati-tudinal gradient and explore the influence of demographic factors, population size and vaccination on the observed dynamic patterns. The particular geographic features of Chile provide a unique opportunity to shed light on the transmission dynamics of pertussis in South America des-pite of the potential biases due to changes in notification rates and vaccination coverage along time and space.
Methods
Data
We obtained annual whooping cough mandatory notifica-tions from the National Epidemiological Surveillance System (Department of Epidemiology, Ministry of Health, Chile) and from Epidemiological Statistics Yearbooks (Department of Statistics and Health Information, Ministry of Health, Chile). These data are freely avail-able at the Ministry Web Site (http://www.deis.cl/). Definitions of cases are as followed; i) suspected case: a cough case having at least two weeks, with one of the following symptoms: paroxysms of coughing, inspiratory whoop, post tussive vomiting without other apparent cause, or cough of shorter duration if the features of the clinical case are depicted. In neonates and infants under 6 months, respiratory infection that causes apneas; ii) con-firmed case: a suspected case that is laboratory concon-firmed or epidemiologically linked by the laboratory and iii) com-patible or clinical case: suspected case which could not be
demonstrated or confirmed by epidemiological association or confirmed at the laboratory. We obtained the annual time series of pertussis incidence at national scale for the period 1932–2010 and annual age-specific incidence at country level for the period 1952–2008. In addition, we obtained annual time series of pertussis incidence for each political region of Chile during the period 1952–2010 (Fig. 1). Demographic information were obtained from the Statistics National Institute of Chile (INE) including annual population size, birth rate (per 1.000) and infant mortality (deaths in infants per 1.000 live births) for each of the thirteen regions of the country (Fig. 1). Birth rates were corrected by infant mortality, for each political re-gion of Chile. Vaccination in Chile started in 1955 using a whole-Cell DP (diphtheria/pertussis) vaccine during the period 1955–1974 and a whole cell DTP (diphtheria, tet-anus and pertussis) vaccine during the period 1975–2006, and a whole cell pentavalent vaccine started to be used in 2007. The research reported in this manuscript was approved by the respective Committee of Bioethics and Biosecurity from the Faculty of Biological Sciences at Pontifical Catholic University of Chile (23/09/2013; CBB-196/2013).
Change in variance
The algorithm of Inclán & Tiao [16] was used to detect changes in the temporal variance of pertussis incidence. This algorithm uses the cumulative sums of squares (Dk) of a time series to identify retrospectively a change of variance. The central idea of this algorithm is that Dk (centred and normalized) has a Brownian bridge as an asymptotic null model. If the realized value of Dkexceeds the 95 % confidence interval for the expected maximum of the null model then this point is considered a true change of variance. However, to use this algorithm with ecological time series it is necessary to keep in mind some considerations. First, it is necessary to remove trends and autocorrelation from the time series. To remove trends, we replaced the original incidence data with the residual of the linear regression between the year and the incidence data plus the mean of the incidence series. To remove autocorrelation we used the residuals of an autoregressive model fitted to the detrended incidence data. Finally, because the ecological time are relatively short to use the asymptotic confidence intervals of the null model, the observed Dkvalues were multiplied by
ffiffiffiffiffiffiffiffiffi T =2 p
, where T is the length of the time series, for comparison with the asymptotic boundaries [16].
Periodicity estimates
We used wavelet time series analysis for detecting the pertussis incidence periodicity [17]. This statistical methodology is well suited for extracting the relative
weights of the different periodic components of a time series and their variation over time. Prior to conducting wavelet analyses, the time series data were loge trans-formed and differenced in order to use the per capita rate of change of incidence as the response variable. We employed a continuous Morlet wavelet transform to the time series implemented in the dplR library in the R program (R Development Core Team 2008). In addition, we analyzed particular periods using a simple spectral density estimation implemented in the stat li-brary in the R program (R Development Core Team 2008). More technical details on wavelet analysis are given in the Technical Appendix. The relationships between periodicity, change in periodicity, population size and the corrected birth rates were tested using linear regression models for the period 1952–1974 and 1975–1995.
Results
Changes in pertussis variability
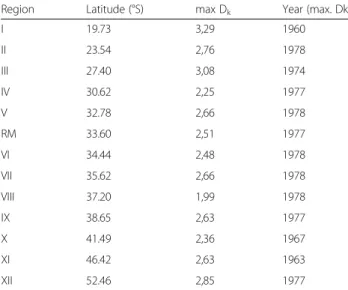
Region-specific incidence time series showed reductions of variability (Dkvalues above confidence limits, Table 1). Maximum values of Dk statistics occurred in most re-gional time series (77 %) during the period 1974–1978 (Table 1). The only exceptions were region I (north
region, latitude 19.73° S) and regions X and XI (41.49° and 46.42° S).
Periodicity
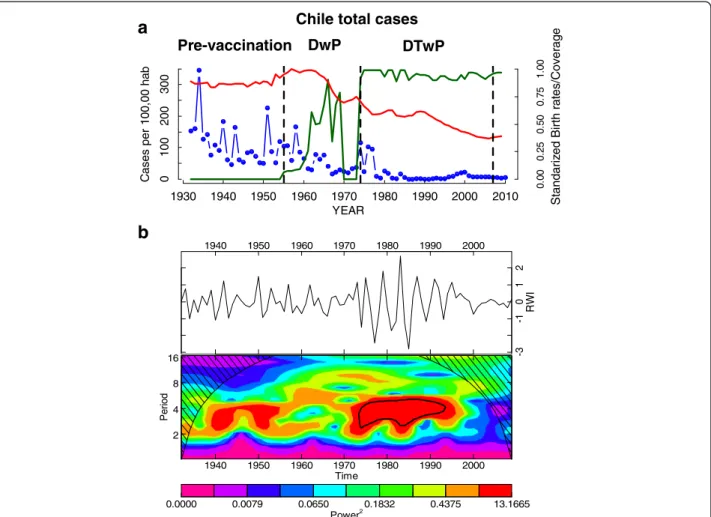
The time series at the national level is shown in Fig. 2a. The wavelet analysis of the aggregated annual time series showed clear changes in periodicity over time (Fig. 2b). During the pre-vaccination period (1932–1955) a 3–4 year cycle is observed. After the start of vaccination campaigns in 1955 no significant periodicity was de-tected until the 1970s, concomitant with an increase in birth rates (Fig. 2b). During the period 1975–1995, a 4-year cycle is detected and corresponding with a drop in birth rates and the start of mass vaccination campaigns in 1974 (Fig. 2a, b). From 1995, the incidence shows a positive trend (Fig. 2a, b).
The annual time series of pertussis incidence across geographic regions are presented in the left panel of Additional file 1: Figure S1. We found spatial and temporal variation in the periodicity of pertussis inci-dence across geographic regions of Chile (Additional file 1: Figure S1). In particular, the dominant dynamic signa-ture was a strong 4-year cycle characterizing most of the incidence time series during the period 1975–1995 as in-dicated by wavelets analysis (Additional file 1: Figure S1). I II III IV V M VI VII VIII IX X XI XII I II III IV V M VI VII VIII IX X XI XII
Fig. 1 Map of Chile showing the distribution of the political regions and the demographic and urbanization characteristics of the country. Romans numbers are the different regional divisions (see Table 1). This map is made by one of the authors of the paper (Sergio A. Estay)
There were important differences across geographic re-gions. For example, regions (I, II, and III) localized at north in the Atacama desert showed some differences with the national pattern, the region II (the most urban-ized and populated of the north) showed a clear 4-yr cycles since 1970 to nowadays. On the other hand, the region III (the least populated from the north) appears to cycle before the 70s and the cycles ended before the 90s (Additional file 1: Figure S1). These three northern regions did not show the positive trend in incidence observed at national level. Regions from central Chile (IV–VIII) showed the same pattern as the national time series, a strong 4-year periodic pattern since the start of mass vac-cinations in 1974 until the middle 1990s (Additional file 1: Figure S1). In addition, all these regions showed a positive increasing trend in incidence during the last two decades and a sudden increase during 2011, which was particularly strong in regions VII and VIII (Additional file 1: Figure S1). Regions from southern Chile (IX, X, XI and XII) showed a different pattern of periodicity compared with the country (Additional file 1: Figure S1). There was a strong trend to show cyclic dynamics during the first two decades of the time series (1952–1975). In contrast with the general pattern, the southernmost two regions (XI and XII) did not show cyclic dynamics after the onset of mass vaccination in 1974. In particular, the region IX showed a different pattern characterized by a strong periodicity and a continuous negative trend of inci-dence (Additional file 1: Figure S1). During the period 1974–1995, the great majority of regions (10/13) showed a strong 4-year cycle (Additional file 1: Figure S1; Table 2) while nine regions showed a clear resurgent pattern
during the last 20 years of our study period (Additional file 1: Figure S1; Table 2).
During the first two decades of the study period, the ob-served differences in periodicity between regions were sig-nificantly associated with differences in corrected birth rates (R2= 0.53; p =0.0029). On the other hand, the ob-served changes in periodicity between the periods (1952– 1974) and (1975–1995) across the country were relatively well predicted by population size (R2= 0.51; p =0.0036). Population size showed positive effects on the change in periodicity between periods. Regions characterized by rela-tively high population sizes exhibited the higher increases in epidemic periodicity while those regions characterized by low population size displayed decreased periodicity after the onset of immunization efforts (Table 2).
Age-specific incidence
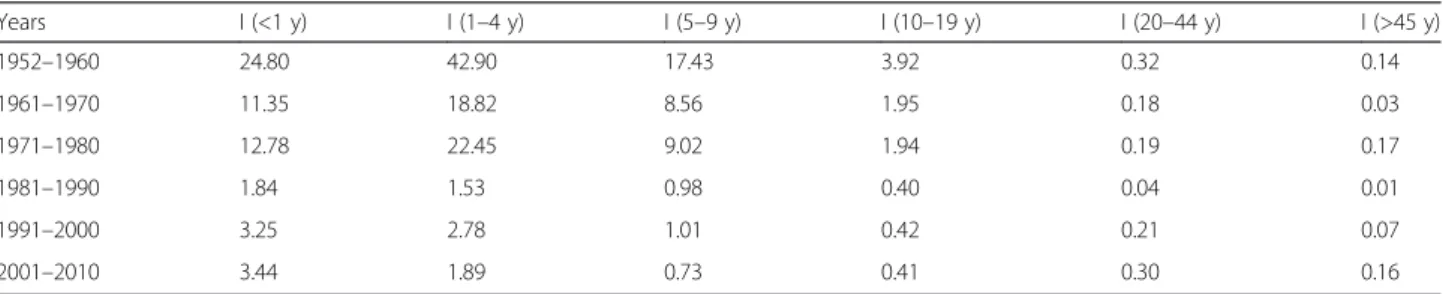
Age-specific changes in the composition of pertussis in-cidence in Chile during years 1952–2008 are depicted in Fig. 3. During the first vaccination period (DP cellular vaccine; 1955–1974) there was little variation in the dis-tribution of cases across age groups despite large annual variation in prevalence and vaccination coverage (Fig. 3a). During this period, 28.7 % of the cases occurred among infants, 45 % among children 1–4 years, and 20.3 % among children 5–9 years, which is the typical pattern of age-specific incidence of pertussis (Fig. 3a). The onset of immunization with the DTP vaccine took place in 1975 and continued until 2006. In the mid-1980s a large change in the age-specific incidence occurred (Fig. 3b). Specifically, there was a change in the age-specific inci-dence pattern toward children < 1 year and young and older adults (Fig. 3a, b, Table 3). During the last two de-cades incidence rates increased across age groups in par-ticular among infants (<1 year), adults aged 20–44 years, and adults >45 years (Table 3).
Discussion
We have analyzed the dynamics and periodicity patterns of pertussis incidence in Chile by making use of almost 60 years of data along a unique latitudinal gradient in Chile. In fact, to the best of our knowledge, this is the first large-scale comparative analysis based on a latitu-dinal gradient of pertussis incidence. The same com-parative approach has been applied to understand the global patterns of pertussis dynamics across different countries [3, 11]. One interesting component of our ana-lysis is the relatively homogeneity of the epidemiological data originating from a consistent source of information and methodology. However, we are aware that despite having a single source of information (Chilean Ministry of Health), the great temporal and spatial extent of the data are sources of error and bias in aspects of notifica-tion, diagnostic tools and vaccination coverage.
Table 1 Timing (years) in changes in the variance of the time series of Pertussis incidence across geographic regions of Chile
Region Latitude (°S) max Dk Year (max. Dk)
I 19.73 3,29 1960 II 23.54 2,76 1978 III 27.40 3,08 1974 IV 30.62 2,25 1977 V 32.78 2,66 1978 RM 33.60 2,51 1977 VI 34.44 2,48 1978 VII 35.62 2,66 1978 VIII 37.20 1,99 1978 IX 38.65 2,63 1977 X 41.49 2,36 1967 XI 46.42 2,63 1963 XII 52.46 2,85 1977
Latitude denotes the latitude of the centroid of each region, max Dkis the
maximum value observed for the Dkstatistic and Year (max Dk) corresponding
to the year when the maximum is observed
Our findings underscore transient dynamic changes observed in time and space across an extensive latitudinal gradient. Specifically, three different dynamic behaviors can be distinguished at the national and regional scales namely high frequency dynamics, 4–5 year cycles and a resurgent pattern occurring during the last 20 years. During the pre-vaccination period (1932–1955) pertussis dynamics showed a weak cyclic behavior with a 2–3 years period, as predicted by theory the increase in birth rates observed among 1955–1965 produced a decrease in the inter-epidemic periods [18, 19] due to the increase of the susceptible pool. This dynamic change occurred despite the onset of vaccination in 1955. However, the first vaccination period in Chile (1955–1974) was charac-terized by a low coverage rate of two doses of a DP whole cell vaccine [20]. Not surprisingly, during this period the reduction in mean incidence rates was weak and pertussis dynamics seems to be driven by birth rates. The most important change in the variance oc-curred at the beginning of the 1970s, which is the
result of a dramatic and synchronized reduction in the mean incidence across the country. During this period there were changes in the type of pertussis vaccine, the corresponding coverage levels and demographic charac-teristics in Chile. For example, in 1974, the vaccination program was initiated with three doses of the DTwP type vaccine and a vaccination program at national level that increased coverage [20]. A previous study based on eight countries with long epidemiological re-cords showed that vaccination increased the periodicity of pertussis outbreaks [3, 11], which supports the idea that immunization plays an important role in decreasing transmission [21]. Nevertheless, Chile experienced im-portant reductions in birth rates during this period; birth rates peaked in 1960 and declined by almost 40 % during the first half of the 1970s. Therefore, it is difficult to assess the effect of the relative contribution of immunization and demographic factors on the dramatic change in mean incidence rates and triggering 4-year periodic cycles. 0.0000 0.0079 0.0650 0.1832 0.4375 13.1665 Power2 1940 1950 1960 1970 1980 1990 2000 2 4 8 16 Time Pe ri o d 1940 1950 1960 1970 1980 1990 2000 -3 -1 0 1 2 RW I
a
1930 1940 1950 1960 1970 1980 1990 2000 2010 YEAR 0 100 200 300 C as es per 100, 00 hab 0. 00 0. 25 0. 50 0. 75 1. 00 Pre-vaccination DwP DTwPChile total cases
b
St andariz ed Birth r a tes/Cover a g eFig. 2 The annual temporal dynamics of pertussis at national level in Chile for the period 1932–2010. a The time series of incidence rate (cases/100000 hab.) for Chile (blue), the annual birth rates (normalized red line) and the annual vaccine coverage (green line); b The wavelet power spectrum of logepertussis
incidence (differenced; top panel), the increasing spectrum intensity is from violet to red color; the dotted black curves show the statistically significant area (threshold 5 % confidence interval) the stripped area delimits the cone of influence (region not influenced by edge effects)
The differences in pertussis dynamics observed along the regions appear to reflect the large climatic, social and demographic differences of the country and potentially also the vaccination coverage differences (data not available). For example, central Chile (regions IV–VIII) comprises about 70 % of the total population including the largest cities (Santiago, Viña del Mar, Valparaiso and Concepcion). These regions exhibited very similar dynamics; the strong 4-years cycles observed during the period 1974–1995 are associated with an important re-duction in transmission rates caused by the increase in vaccination coverage, the addition of a third dose [20] and the decrease in birth rates. On the other hand, the extreme northern and southern regions characterized by lower population sizes and lower birth rates showed cyclic dynamics. The theory of infectious diseases pre-dicts that outbreak periodicity is mainly driven by birth rates and vaccine coverage [18, 19, 22]. Consequently, outbreak periodicity appears to be driven by the suscep-tible recruitment dynamics (birth rates and vaccination coverage). Nevertheless, other studies have emphasized the role of waning immunity as the main driver of sus-ceptible recruitment dynamics and outbreak periodicity in pertussis [23, 24]. In Chile, during the first period of vaccination (1955–1974) the periodicity of the out-breaks appears to be clearly influenced by demography (birth and infant mortality rates). In particular, the regions characterized by low birth rates exhibited lon-ger periodic patterns, which is in line with theoretical results [18] and the observed patterns [3, 11]. However, the interaction between the different factors generating the dynamics of pertussis is still not clearly understood. For example, the immunization program in Chile
increased the periodicity of the outbreaks in those re-gions characterized by high population size, while de-creased the periodicity, especially in southern regions with low population sizes. This result is intriguing and poses some interesting questions about the complex dy-namics of this infectious disease. The 3–to 4-year period-icity trend in pertussis dynamics has been observed in countries with very different vaccination levels and socio-demographic conditions [3], suggesting that other factors are operating beyond the role of susceptible recruitment and vaccination coverage [3], such as, population density, urbanization and the degree of biases in the notification of the disease. In fact, we found that in northern and southern Chile the periodicity of pertussis decreased following vaccination efforts. These particular regions were characterized by low population size and low birth rates, but because we have no information about vac-cination rates among regions the causal factors are only speculative. Importantly, despite the existence of major demographic and social differences between regions, no effects were observed in the magnitude of the incidence rates associated with these factors.
During the last decade the resurgence of pertussis has been the subject of considerable attention, especially in countries with a long history of vaccination [5, 8, 25–29]. In general, the resurgence has been characterized by an increase in the mean age of infection [8, 11, 25–29]. Our analysis determined that the increase of pertussis inci-dence in Chile started around twenty years ago and dis-plays differences with other countries. For example, in Canada, Sweden and USA, pertussis resurgence was driven by an increase in the number of preteens and teens [8, 25–27]. In Chile, the corresponding increase is in
Table 2 Regional estimates of periodicity, susceptible recruitment rates (SR), population size, change in periodicity (Δ Periodicity), change in susceptible recruitment rates (Δ SR) and evidence for resurgence during the last 20 years
Region Periodicity (1952–1974) SR (1952–1974) Population size (1952–1974) SR (1975–1995) Population size (1975–1995) Periodicity (1975–1995) ΔSR ΔPeriodicity Resurgence I 2 25.96 163517.8 19.23 411448.6 4.00 6.7 2 N II 4 25.59 271331.9 19.80 502683.1 4.00 5.8 0 N III 2 27.76 162502.6 19.20 258547.6 2.50 8.6 0.5 N IV 2.7 26.23 370382.1 17.75 623274.8 4.00 8.5 1.3 Y V 2.5 23.89 923194.1 15.85 1570163.6 4.00 8.0 1.5 Y RM 2 25.83 3205838.7 17.10 6146877.5 4.00 8.7 2 Y VI 2 25.78 494354.9 17.08 803304.7 4.00 8.7 2 Y VII 3.3 25.86 659515.4 16.34 928979.4 4.00 9.5 0.7 Y VIII 2.5 26.96 1309030.7 16.28 1900525.4 4.00 10.7 1.5 Y IX 5 20.86 640086.6 16.15 885620.9 4.00 4.7 -1 N X 4.5 23.08 787471.2 17.23 1064571.9 4.00 5.9 -0.5 Y XI 3.5 25.03 50443.3 17.64 93718.0 1.00 7.4 -2.5 Y XII 4 21.46 89211.4 15.08 151265.6 1.00 6.4 -3 Y
infants (<1 year old) and adults (20–44 and >45). The introduction of the DTPw vaccine in 1974 caused a dra-matic reduction in incidence in the age-group 1–9, but the effects were less marked on the infants. This shift to-ward infants was also reported in Sweden [7], but the
resurgent era in USA and Canada was characterized by about half of the cases reported in children > 10 year old [4, 8, 25, 26]. Different plausible hypotheses have been proposed for explaining this resurgent pattern and age dis-tribution shift in highly immunized populations; evolution
y52 y60 y68 y76 y84 y92 y00 y08
% Cases
0
20
40
60
80
100
1990 1995 2000 2005 2010 08 Cases per 100,000 1990 1995 2000 2005 2010 08 1990 1995 2000 2005 2010 08 Cases per 100,000 1990 1995 2000 2005 2010 0.0 1990 1995 2000 2005 2010 0.0 YEAR Cases per 100,000 1990 1995 2000 2005 2010 0.0 YEAR 20-44 5-9 1-4 < 1 > 45 10-19b
a
Fig. 3 a Case percentage among age groups; infants (<1 year; green); preschool children (aged 1– 4; red); primary school children (aged 5 – 9; cyan); adolescents (ages 10–19; blue), young adults (aged 20–44; magenta); older adults (>45; dark green). The onsets of the different vaccination programs are marked with the arrows. b Age specific pertussis incidence in Chile during the period of resurgence (1990–2010)
Table 3 Age-specific incidence rates of pertussis for different time periods at the national level in Chile
Years I (<1 y) I (1–4 y) I (5–9 y) I (10–19 y) I (20–44 y) I (>45 y) 1952–1960 24.80 42.90 17.43 3.92 0.32 0.14 1961–1970 11.35 18.82 8.56 1.95 0.18 0.03 1971–1980 12.78 22.45 9.02 1.94 0.19 0.17 1981–1990 1.84 1.53 0.98 0.40 0.04 0.01 1991–2000 3.25 2.78 1.01 0.42 0.21 0.07 2001–2010 3.44 1.89 0.73 0.41 0.30 0.16
of Bordetella pertussis [30], improvements in the recogni-tion of the disease in adolescents and adults [26, 27], wan-ing of vaccine-induced immunity [8, 25–29], and the role of contact networks in highly immunized countries [7]. Moreover, the study by Rohani et al. [7] suggested that the social contact network can be the key piece for understanding the epidemiology of B. pertussis. The number of daily contacts among the different age clas-ses could be an important factor for determining the epidemiology of B. pertussis [7, 31]. On the other hand, the increase of pertussis incidence was closely related with the regional geographic structure of Chile. North-ern regions did not show any evidence of increases dur-ing the last 20 years, which is in contrast to the observed pattern in central and southern regions of Chile. In fact, the most important increases in pertussis were observed in the southern regions (VIII, X and XI).
Conclusion
This comparative study of B. pertussis along a latitudinal gradient from Chile illustrates the regional dynamic pat-terns of this important disease. We related changes in pertussis periodicity and incidence trends along a latitu-dinal gradient with interactions between demography and population size. Widespread B. pertussis vaccination appears to lead to longer periodic dynamics, which is congruent with a reduction in B. pertussis transmission and herd immunity effect, but we detected that regions characterized by low birth rates and population size de-creased in periodicity after immunization campaigns. This finding underscores the complex transmission dy-namics of pertussis and the need for further studies to disentangle the links between transmission variables, susceptible recruitment and vaccination. In summary, we have characterized the geographical variation in per-tussis dynamics along a latitudinal gradient with regional demographic variability. More studies based on high resolution spatial-temporal data including demographic, vaccination cover, good clinical and microbiological data covering extensive geographic areas are warranted to in-crease our understanding of the complex epidemio-logical dynamics of pertussis in Chile.
Additional file
Additional file 1: The annual temporal dynamics of pertussis at regional level in Chile for the period 1952–2010. Left panel) The log transformed time series of incidence rate (cases/100000 hab.) for each region of Chile; Right panel) The wavelet power spectrum of loge pertussis incidence (differenced; top panel), the increasing spectrum intensity is from violet to red color; the dotted black curves show the statistically significant area (threshold 5 % confidence interval); the stripped area delimits the cone of influence (region not influenced by edge effects) (PPTX 1519 kb) Competing interests
The authors declare that they have no competing interests.
Author’s contributions
ML and SAE conceived and designed the time series analyses. RF and PR analyzed the historical epidemiological data. HB and GC-P participated in the design of the study and discussed the results. ML and SAE performed the time series analyses. ML, SAE, RF, PR, HB and GC-P collaborated to write the paper. All authors read and approved the final manuscript.
Acknowledgments
We thank to the Chilean Ministry of Health and all the people of the Department of Epidemiology of the mentioned Ministry and T. Q. Tan, C. H. Wirsing von Koenig and J Gaillat for their helpful comments and criticisms to the manuscript. This study was supported by Fondo Basal-CONICYT grant FB-0002 and Proyecto Fondecyt Regular 1141164.
Author details
1Departamento de Ecología, Pontificia Universidad Católica de Chile, Casilla
114-D, Santiago 6513677, Chile.2Center of Applied Ecology and Sustainability
(CAPES), Santiago, Chile.3Inst. de Ecología y Evolución, Facultad de Ciencias.
Univ. Austral de Chile, Casilla 567, Valdivia, Chile.4Departamento de
Epidemiologia, Ministerio de Salud, Santiago, Chile.5MIVEGEC, UMR CNRS
5290-IRD 224-UM1-UM2, 911, Avenue Agropolis BP 64501, 34394 Montpellier Cédex 5, France.6School Public Health, Georgia State University, Atlanta, GA,
USA.
Received: 11 January 2015 Accepted: 24 November 2015 References
1. Rohani P, Keeling MJ, Grenfell BT. The interplay between determinism and stochasticity in childhood diseases. Am Nat. 2002;159:469–81.
2. Nguyen HT, Rohani P. Noise, nonlinearity and seasonality: the epidemics of whooping cough revisited. J R Soc Interf. 2008;5:403–13.
3. Broutin H, Guégan J-F, Elguero E, Simondon F, Cazelles B. Large-scale comparative analysis of pertussis population dynamics: periodicity, synchrony, and impact of vaccination. Am J Epidemiol. 2005;161:1159–67. 4. Cherry JD. Epidemic Pertussis in 2012-resurgence of a vaccine-preventable
disease. The New Engl J Med. 2012;367:785–7.
5. de Melker HE, Conyn-van Spaendock MAE, Rümke HC, van Wijngaarden JK, Mooi FR, Schellekens JFP. Pertussis in The Netherlands: an outbreak despite high levels of immunization with whole-cell vaccine. Emerg Infect Dis. 1997;3:175–8.
6. Crowcroft NS, Pebody R. G. Recent developments in pertussis. The Lancet. 2006;367:1926–36.
7. Rohani P, Zhong X, King AA. Contact network structure explains the changing epidemiology of pertussis. Science. 2010;330:982–5.
8. Skowronski DM, De Serres G, MacDonald D, Wu W, Shaw C, Macnabb J, et al. The changing age and seasonal profile of pertussis in Canada. J Infect Dis. 2002;185:1448–53.
9. de Melker HE, Schellekens JF, Neppelenbroeck SE, Mooi FR, Rümke HC, Conyn-van Spaendonck MA. Reemergence of pertussis in the highly vaccinated population of the Netherlands: observations on surveillance data. Emerg Infect Dis. 2000;6:348–57.
10. Hellenbrand W, Beier D, Jensen E, Littmann M, Meyer Chr, Oppermann H, et al. The epidemiology of pertussis in Germany: past and present. BMC Infect Dis. 2009;9:22. doi:10.1186/1471-2334-9-22.
11. Broutin H, Viboud C, Grenfell BT, Miller MA, Rohani P. Impact of vaccination and birth rate on the epidemiology of pertussis: a comparative study in 64 countries. Proc R Soc B. 2010;277:3239–45. doi:10.1098/rspb.2010.0994. 12. Luz PM, Codeço CT, Werneck GJ, Struchiner CJ. A modelling analysis of
pertussis transmission and vaccination in Rio de Janeiro. Brazil Epidemiol Infec. 2006;134:850–62.
13. Broutin H, Elguero E, Simondon F, Guégan J. Spatial dynamics of pertussis in a small region of Senegal. Proc R Soc B. 2004;271:2091–8. doi:10.1098/rspb. 2004.2847.
14. Bjørnstad O, Finkenstädt B, Grenfell B. Dynamics of measles epidemics: estimating scaling of transmission rates using a time series sir model. Ecol Monogr. 2002;72:169–84.
15. Grenfell B, Bjørnstad O, Finkenstädt B. Dynamics of measles epidemics: scaling noise, determinism, and predictability with the tsir model. Ecol Monogr. 2002;72:185–202.
16. Inclán C, Tiao GC. Use of cumulative sums of squares for retrospective detection of changes of variance. J Am Stat Ass. 1994;89:913–23. 17. Torrence C, Compo GP. A practical guide to wavelet analysis. Bull Am
Meteorol Soc. 1998;79:61–78.
18. Anderson RM, May RM. Infectious diseases of humans: dynamics and control. Oxford, UK: Oxford Science Publications/Oxford University Press; 1991. 19. Earn D, Rohani P, Bolker B, et al. A simple model for complex dynamical
transitions in epidemics. Science. 2000;287:667–70.
20. Sanchez ID, Repetto GD, Saenger AL. Epidemiología de la tos ferina en Chile (1930-1990). ¿El adulto, nuevo reservorio de infección? Rev Med Chile. 1994;122:339–45.
21. Carlsson RM, Trollfors B. Control of pertussis—Lessons learnt from a 10-year surveillance programme in Sweden. Vaccine. 2009;27:5709–18.
22. Keeling MJ, Rohani P. Modeling infectious diseases in humans and animals. Princeton, NJ: Princeton University Press; 2008.
23. Tan T, Trindade E, Skowronski D. Epidemiology of pertussis. Pediatr Infect Dis J. 2005;24:S10–8.
24. Wood N, McIntyre P. Pertussis: review of epidemiology, diagnosis, management and prevention. Pediatr Resp Rev. 2008;9:201–12. 25. Ntezayabo B, De Serres G, Duval B. Pertussis resurgence in Canada largely
caused by a cohort effect. Pediatr Infect Dis J. 2003;22:22–7. 26. Cherry JD. The epidemiology of pertussis: a comparison of the
epidemiology of the disease pertussis with the epidemiology of Bordetella pertussis infection. Pediatr. 2005;115:1422–7.
27. Cherry JD. The science and fiction of the“resurgence” of pertussis. Pediatr. 2003;112:405–6.
28. Zepp F, Heininger U, Mertsola J, Bernatowska E, Guiso N, Roord J, et al. Rationale for pertussis booster vaccination throughout life in Europe. Lancet Infect Dis. 2011;11:557–70.
29. Clarck TA. Changing pertussis epidemiology: Everything old is new again. J Infect Dis. 2014;209:978–81.
30. Weber C, Boursaux-Eude C, Coralie G, Caro V, Guiso N. Polymorphism of Bordetella pertussis isolates circulating for the Last 10 years in France, where a single effective whole-cell vaccine has been used for more than 30 years. J Clin Micribiol. 2001;39:4396–403.
31. Mossong J, Hens N, Jit M, Beutels P, Auranen K, Mikolajczyk R, et al. Social contacts and mixing patterns relevant to the spread of infectious diseases. PLoS Med. 2008;5:e74. doi:10.1371/journal.pmed.0050074.sg001.
• We accept pre-submission inquiries
• Our selector tool helps you to find the most relevant journal
• We provide round the clock customer support
• Convenient online submission
• Thorough peer review
• Inclusion in PubMed and all major indexing services • Maximum visibility for your research
Submit your manuscript at www.biomedcentral.com/submit