Biological Journal of the Linnean Society, 2005, 85, 53–63. With 3 figures
Blackwell Science, LtdOxford, UKBIJBiological Journal of the Linnean Society0024-4066The Linnean Society of London, 2005*** 2005 85••
5363 Original Article
BIOGEOGRAPHY OF THE BROAD-TOOTHED FIELD MOUSE M. JOHAN
ET AL
.
*Corresponding author. E-mail: Johan.Michaux@ulg.ac.be
Taxonomy, evolutionary history and biogeography of the
broad-toothed field mouse (
Apodemus mystacinus
) in the
eastern Mediterranean area based on mitochondrial and
nuclear genes
JOHAN MICHAUX
1,2*, ERICA BELLINVIA
3and PETROS LYMBERAKIS
41
Unité de Recherches Zoogéographiques, Institut de Zoologie, Quai Van Beneden 22, 4020 Liège, Belgium
2
Centre de Biologie et de Gestion des Populations (CBGP) UMR 1062, Campus International de
Baillarguet, CS 30016, 34988, Montferrier/Lez (Montpellier) Cedex, France
3
Department of Zoology, Charles University, Vinièna 7, Praha 2, CZ 128 44, Czech Republic
4
Natural History Museum of Crete, University of Crete, Knosou Avenue, Irakleio, Greece
Received 16 January 2004; accepted for publication 1 August 2004
The broad-toothed field mouse (Apodemus mystacinus) is distributed throughout the Balkan Peninsula, Asia Minor and the Middle East. It is generally split into two different specific entities: Apodemus epimelas occurs on the Balkan Peninsula and A. mystacinus inhabits Asia Minor and the Middle East. This analysis, based on two mitochondrial regions (cytochrome b and the D-loop) and the interstitial retinol binding protein (IRBP) nuclear gene, confirms an important level of genetic divergence between the animals from these regions and their separation from each other at least 4.2–5.1 Mya, which is in favour of a distinct specific status. Finally, the broad-toothed field mice from south-western Turkey appear to be closely related to the animals from Crete but highly distinct from the populations of the other Oriental regions. This supports a distinct subspecific level (A. m. rhodius) for the insular animals and also for those from south-western Turkey. From a biogeographical point of view, it can be assumed that either late Pliocene or early Pleistocene cooling led to the isolation of two main groups of A. mystacinus, one in the Balkan region and the other one in Turkey and the Near East (Syria and Israel). In this region, it is suggested that a more recent event appeared during the Quaternary period, isolating broad-toothed field mice in Crete and leading to the appearance of two well-differentiated genetic groups: one in Crete and south-western Turkey, and the other widespread in north-ern and eastnorth-ern Turkey as well as in the Near East. © 2005 The Linnean Society of London, Biological Journal of the Linnean Society, 2005, 85, 53–63.
ADDITIONAL KEYWORDS:
eastern Mediterranean region – IRBP nuclear gene – mitochondrial control region – mitochondrial cytochrome b gene.INTRODUCTION
The broad-toothed field mouse, Apodemus mystacinus (Danford & Alston, 1877), is a small rodent of the Murinae subfamily distributed throughout the east-ern Mediterranean region. It lives in rocky and stony habitats in various environments such as cultivated areas, woodlands or ruins. It is clearly distinguishable from the other European Apodemus species by differ-ent morphological characters such as a greater body
size and a dark-grey coloration of the fur. Its range extends from the Balkan region (Albania, the former Yugoslavia, Bulgaria and Greece) (Mitchell-Jones et al., 1999) to the Near East (Turkey, Georgia, Jor-dan, Lebanon, Israel and Iraq) (Kock, Malec & Storch, 1972). It is also present in Corfu, Rhodes, Karphatos and Crete, as well as in several Aegean islands (Niethammer, 1978).
The taxonomic status of this species is still unclear. Two subspecies were firstly described within A. mystacinus: A. m. epimelas (Nehring, 1902) occur-ring on the Balkan peninsula (Terra typica: Parnas
54
M. JOHAN ET AL.Mountains, Greece) and A. m. mystacinus (Danford & Alston, 1877) inhabiting Asia Minor and the Middle east (Terra typica: Bolkar Daglari Mountains, Asia Minor). This classification is supported by Spitzen-berger (1973) on the basis of morphological studies. Another subspecies has also been described in the islands of Crete, Karpathos and Rhodes, namely A. m. rhodius (Ondrias, 1966).
On the basis of palaeontological data, however,
Storch (1977) considers that A. epimelas and
A. mystacinus are two distinct species, an opinion also shared by Mezhzherin (1997), in his systematic revi-sion of the Apodemus species of northern Eurasia.
To date only a single genetic study based on allozyme data (Filippucci, Macholán & Michaux, 2002) has been performed on this species and tends to confirm a specific status for A. epimelas and A. mystacinus. Nevertheless, a new molecular study based on DNA sequences and carried out on different specimens from European and oriental regions would be extremely useful to highlight the taxonomic debate.
From a biogeographical point of view, the existence of these various taxa raises many interesting questions:
1. How old are the morphologic differences between the European and oriental populations? Are they resulting from an ancient allopatric isolation asso-ciated to a previous geological phenomenon or cli-mate change (e.g. the Quaternary ice ages)? 2. As the Marmara Sea was frequently replaced by
dry lands during the Quaternary ice ages, why is the European form absent from Turkey and vice-versa?
3. As suggested by the description of several subspe-cies within the oriental group (Spitzenberger, 1973), is it possible to distinguish different genetic lineages in this region. How and when did they eventually appear?
4. What is the origin of the A. mystacinus populations
in Crete? As Apodemus sylvaticus (J. Michaux,
unpubl. data), did it invade this island from Greece, or did it come from oriental regions, similar to another rodent, Acomys minous (Barome et al., 2001)?
5. When did it invade the oriental Mediterranean islands? Is it, like A. sylvaticus (J. Michaux, unpubl. data) and Acomys minous (Barome et al., 2001), a recent colonist associated with anthropo-genic introductions?
The aims of this study are to address these ques-tions and to better determine the taxonomic status of A. mystacinus. Several well-distributed populations
are analysed using sequences of the nuclear IRBP
gene and two mitochondrial regions, the cytochrome b gene and the D-loop region.
MATERIAL AND METHODS
BIOLOGICALMATERIAL
A total of 21 Apodemus mystacinus from 15 localities widespread throughout a large part of the species dis-tribution area were analysed (Table 1, Fig. 1). One Apodemus agrarius and one Apodemus peninsulae were also analysed to sequence their D-loop region.
LABORATORYMETHODS
DNA was extracted from ethanol-preserved tissue fol-lowing Sambrook, Fritsch & Maniatis (1989) or Bahl & Pfenninger (1996). Tissues were taken from the Apodemus tissue collection of J. R. Michaux (JRM numbers) and those of E. Bellinvia (EB numbers).
A large portion of the cytochrome b gene (972 bp) was amplified using the universal PCR primers L7
(5¢-ACCAATGACATGAAAAATCATCGTT-3¢) and H16
(5¢-ACATGAATYGGAGGYCAACCWG-3¢) (Kocher
et al., 1989). Moreover, 782 bp of the IRBP gene were amplified using the PCR primers I1 and J2 (Stanhope et al., 1992). Finally, the whole D-loop and flanking tRNA genes (about 1000 bp) were amplified in two overlapping segments of about 600 bp each. Primers
1 (5¢-ATAAACATTACTCTGGTCTTGTAAAC-3¢) and
2 bi (5¢-CACAGTTATGGAAGTCTTGG-3¢) were used
to obtain a PCR product including the whole tRNAThr and tRNAPro genes and about 460 bp of the D-loop up to about half of the central domain. The second segment, extending from about one half of the D-loop central domain to the beginning of the 12S tRNA region, including the tRNAPhe gene, was produced
with primers 3 (5¢-CGTTCCCCTAAATAAGACA-3¢)
and 4 (5¢-TAATTATAAGGCCAGGACCA-3¢).
Amplification reactions were carried out in 2 ¥ 50 mL volumes including 25 mL of each 2 mM primer, 20 mL of 1 mM dNTP, 10 mL of 10¥ reaction
Figure 1. Geographic distribution of the Apodemus
myst-acinus samples. The shaded zones correspond to the distri-bution area of this species (as described by Mitchell-Jones et al., 1999 and Kock et al., 1972). White circles, black circles and triangles correspond to clades A, B1 and B2, respectively. See Table 1 for sample symbols.
Bu 1-2 Cr 1-5 Tur2 Tur4Tur3 GEO Sy2 Sy1 Sy3 Gr1 Tur1 Gr2
BIOGEOGRAPHY OF THE BROAD-TOOTHED FIELD MOUSE
55
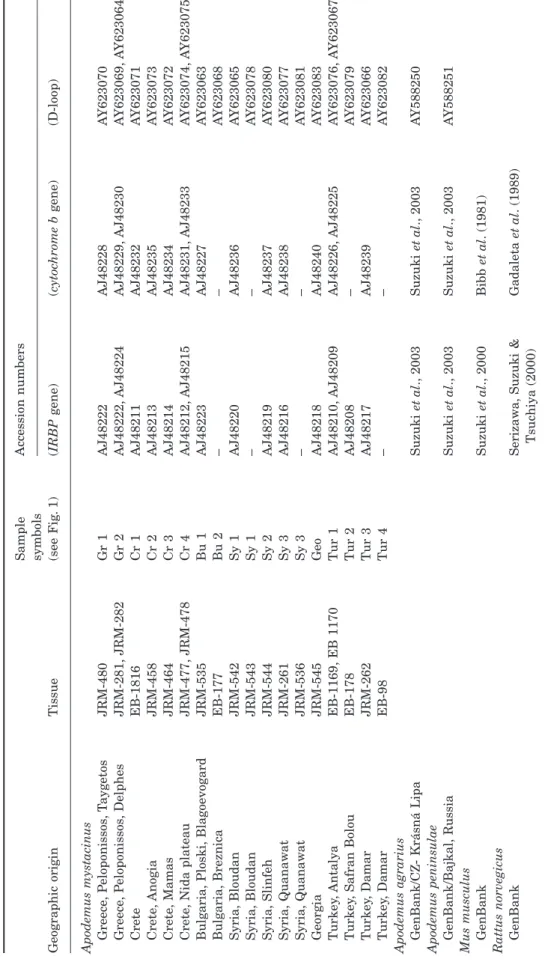
T
able 1.
Geographic distribution and references of
Apodemus
and other rodent tissues used for the experiments
Geographic origin
Tissue
Sample symbols (see F
ig
.
1)
Accession numbers (IRBP
gene) ( cytoc hrome b gene) (D-loop) Apodemus mystacinus Greece , P eloponissos , T a ygetos JRM-480 Gr 1 AJ48222 AJ48228 A Y623070 Greece , P eloponissos , Delphes JRM-281, JRM-282 Gr 2 AJ48222, AJ48224 AJ48229, AJ48230 A Y623069, A Y623064 Crete EB-1816 Cr 1 AJ48211 AJ48232 A Y623071 Crete , Anogia JRM-458 Cr 2 AJ48213 AJ48235 A Y623073 Crete , Mamas JRM-464 Cr 3 AJ48214 AJ48234 A Y623072 Crete , Nida plateau JRM-477, JRM-478 Cr 4 AJ48212, AJ48215 AJ48231, AJ48233 A Y623074, A Y623075 Bulgaria, Ploski, Blagoevogard JRM-535 Bu 1 AJ48223 AJ48227 A Y623063 Bulgaria, Breznica EB-177 Bu 2 – – A Y623068 Syria, Bloudan JRM-542 Sy 1 AJ48220 AJ48236 A Y623065 Syria, Bloudan JRM-543 Sy 1 – – A Y623078 Syria, Slinfeh JRM-544 Sy 2 AJ48219 AJ48237 A Y623080 Syria, Quanaw a t JRM-261 Sy 3 AJ48216 AJ48238 A Y623077 Syria, Quanaw a t JRM-536 Sy 3 – – A Y623081 Georgia JRM-545 Geo AJ48218 AJ48240 A Y623083 Turkey , Antalya EB-1169, EB 1170 Tur 1 AJ48210, AJ48209 AJ48226, AJ48225 A Y623076, A Y623067 Turkey , Safran Bolou EB-178 Tur 2 AJ48208 – A Y623079 Turkey , Damar JRM-262 Tur 3 AJ48217 AJ48239 A Y623066 Turkey , Damar EB-98 Tur 4 – – A Y623082 Apodemus agrarius GenBank/CZ- Krásná Lipa Suzuki et al ., 2003 Suzuki et al ., 2003 A Y588250 Apodemus peninsulae GenBank/Bajkal, Russia Suzuki et al ., 2003 Suzuki et al ., 2003 A Y588251 Mus musculus GenBank Suzuki et al ., 2000 Bibb et al . (1981) Rattus norvegicus GenBank Serizaw a , Suzuki & Tsuchiya (2000) Gadaleta et al . (1989)
56
M. JOHAN ET AL.buffer, 10 mL of purified water and 0.2 mL of 5 U mL-1
Promega Taq DNA polymerase. Approximately 200 ng of DNA extract were used per PCR amplification. Amplifications were carried out in a Labover PTC100 thermal cycler using 33 cycles (20 s at 94 ∞C, 30 s at 50 ∞C and 1 min 30 s at 68 ∞C) with a final extension cycle of 10 min at 68 ∞C. PCR products were purified using the Ultra-free DA Amicon kit (Millipore) and directly sequenced. Both strands were sequenced using a Bigdye terminator (Applied Biosystems) sequencing kit and run on an ABI 310 (Applied Bio-systems) automated sequencer.
SEQUENCEALIGNMENTANDSATURATIONANALYSIS
Published sequences for cytochrome b and IRBP of A. agrarius, A. peninsulae, Mus musculus and Rattus norvegicus were downloaded from GenBank (Table 1) and aligned to our new sequences using the ED editor (MUST package; Philippe, 1993). The program AFAS (MUST package; Philippe, 1993) was used to combine the aligned matrices of IRBP, D-loop and cytochrome b.
Following Philippe & Douzery (1994) and Hassanin, Lecointre & Tillier (1998), we examined the IRBP, D-loop and cytochrome b data sets for saturation. Using the matrices of patristic and inferred substitutions calculated by PAUP v. 4b8 (Swofford, 2000), the pair-wise numbers of observed differences was plotted against the corresponding values for inferred substi-tutions (Philippe & Douzery, 1994). The slope of the linear regression (S) was used to evaluate the level of saturation (Hassanin et al., 1998). When no saturation is observed in the data set, the slope equals one whereas the slope tends towards zero as the level of saturation increases.
PHYLOGENETICRECONSTRUCTIONS
Firstly, each gene was studied separately, then the combined matrix for IRBP (736 bp), cytochrome b (976 bp) and D-loop (1063 bp) sequences was used to determine more precisely the phylogenetic position of the different A. mystacinus lineages.
Before combining these different genes into single matrices, the level of incongruence between genes was tested using PAUP v. 4b5 (option Hompart). This approach uses the incongruence length difference (ILD) test with the parsimony criterion; 1000 random-izations were performed on variable sites only (Farris, 1985).
After alignment of the sequences, the general time reversible model (GTR) and the Kimura’s 2 parame-ters (K2P) estimator were used for the calculation of genetic distances. The GTR analyses were performed assuming a gamma distribution for substitution rates
across sites, where the parameter alpha (Yang, 1996) and the proportion of invariant sites (I) were esti-mated with the maximum-likelihood method assum-ing the GTR phylogeny usassum-ing PAUP v. 4.0b8. Maximum parsimony (MP; heuristic search, tree bisection reconnection (TBR) branch swapping option) and maximum likelihood (ML; GTR model of sequence evolution) analyses were also conducted using PAUP 4.0b8 (Swofford, 2000).
The robustness of inferences was assessed by boot-strap resampling (BP) using 1000 random repetitions for MP and distance analyses, and 100 for ML.
DIVERGENCETIME
Firstly, to identify whether there are differences in rates of cytochrome b, D-loop and IRBP changes between the different A. mystacinus lineages, relative rate tests were conducted with each lineage against the remaining ones. The relative-rate tests were done with RRTree, version 1.0 (Robinson et al., 1998) which improves the test of Wu & Li (1985) by taking into account taxonomic sampling and phylogenetic rela-tionships. The three DNA regions were analysed sep-arately. The ML tree for each region was chosen as the reference topology and A. peninsulae and A. agrarius were used as outgroups. For non-coding regions (D-loop), relative-rate tests were performed on the pro-portion of all the substitutions types (K). For coding sequences (cytochrome b), relative-rate tests were
per-formed on the proportions of synonymous (Ks) and
non-synonymous (Ka) substitutions.
Secondly, to apply a molecular clock and to estimate times of divergence, we estimated the ML (the search was constrained to clock-like evolution) tree based on the cytochrome b data set with M. musculus and R. norvegicus as outgroups. The D-loop and IRBP data matrices were not used for this analysis as explained in the Results. The inferred maximum likelihood distances were used to estimate separation times (Michaux et al., 2001). Two calibration points derived from palaeontological data were used. Firstly, the Mus/Rattus dichotomy at 12 Mya (Jaeger, Tong & Denys, 1986; Jacobs, Winkler & Murry 1989, Jacobs et al., 1990; Jacobs & Downs, 1994) and secondly, the divergence time between the Apodemus and Sylvae-mus subgenera estimated at 7.9 Myr (Michaux et al., 1997, 2002).
RESULTS
NEW SEQUENCES
All of the sequences generated in this study were deposited in GenBank under accession numbers AY623063 to AY623083, AY588250 and AY588251 (D-loop), AJ748225 to AJ748240 (cytochrome b) and AJ748208 to AJ748224 (IRBP) (Table 1).
BIOGEOGRAPHY OF THE BROAD-TOOTHED FIELD MOUSE
57
For methodological reasons, 17 A. mystacinus sequences were obtained for IRBP, 16 for cytochrome b and 21 for the D-loop. The D-loop of one A. agrarius and one A. peninsulae was also sequenced.
The alignment of the IRBP sequences of 19 indi-viduals comprises 736 nucleotides of which 71 (9.6%) are variable and 25 (3.4%) are parsimony informa-tive. No heterozygotic sites were found on the sequences studied. The average ratio of transitions to transversions (TS/TV) is 2.39, ranging from 1.2 to 5.1. The alignment of the cytochrome b gene consists of 976 nucleotides for 18 specimens, 266 (27%) of which are variable and 215 (22%) parsimony infor-mative. The average ratio of TS/TV is 1.79, ranging from 0.80 to 5.34. The complete alignment of the D-loop mitochondrial region comprises 1063 sites for 23 individuals. Of these, 272 (25.6%) are variable and 173 (16.3%) are parsimony informative. The average ratio of TS/TV is 1.56, ranging from 0.8 to 6.7. The concatenated sequence data matrix for the 16 A. mystacinus and the two outgroups comprises 2775 nucleotide sites, 606 (21.8%) variable and 368 (13.3%) parsimony informative.
SATURATIONANALYSIS
Saturation analysis of the IRBP and cytochrome b data set indicates that there is no saturation for tran-sitions and transversions at the three-codon potran-sitions. Therefore we included all events at the three-codon positions of these two genes for all phylogenetic analyses. Saturation analysis of the D-loop data showed that transversions are moderately affected by homoplasy. On the contrary, transitions are more sat-urated (S = 0.45). However, as exclusion of transitions leads to an important lack of information, they were retained in further analyses.
PHYLOGENETICRELATIONSHIPSBETWEENTHE
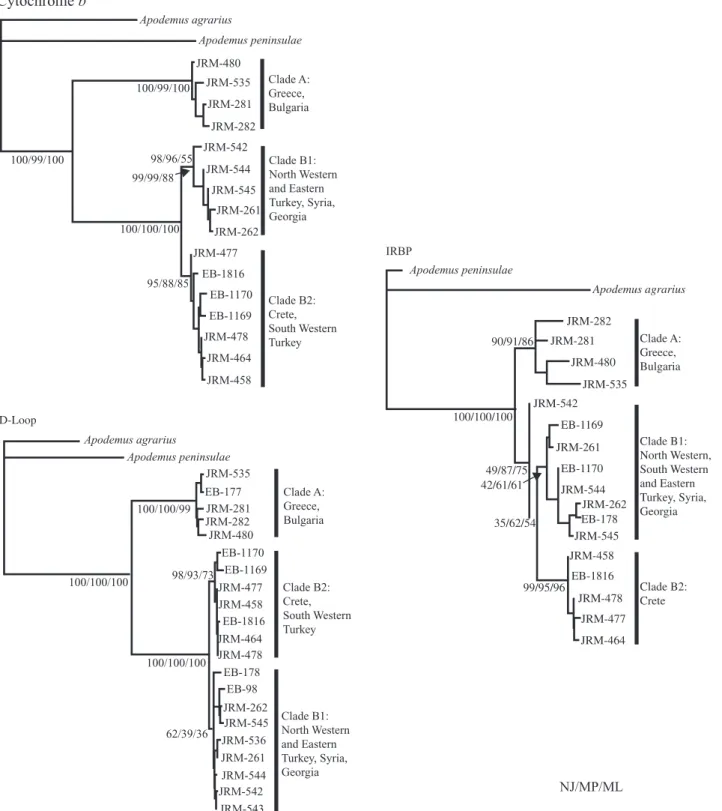
APODEMUS MYSTACINUSLINEAGES (1) Independent analysis of the three genetic regions Whatever the genetic region, it can be seen (Fig. 2) that the specimens are split into two main clades. The first (clade A) corresponds to the Balkan animals, while the second represents the populations from Tur-key, Syria, Georgia and Crete. These clades are very well supported for the D-loop and the cytochrome b gene (BP: 99–100%) but they are less well supported for the IRBP gene (BP: 49–87%).
Within the second clade, two subclades are also dis-tinct. Subclade B1 corresponds to the animals from north-western and eastern Turkey, Syria and Georgia; subclade B2 corresponds to the animals from Crete and south-western Turkey (the exception being for IRBP, which only corresponds to the specimens from
Crete). These two groups are strongly supported for the cytochrome b gene (BP: 85–98%). On the contrary, the robustness of subclade B1 is lower for the D-loop and IRBP (BP: 36–62%).
(2) Combined analysis of the three genetic regions Notwithstanding minor discrepancies between the branching patterns obtained from the D-loop and cytochrome b data sets, the ILD test showed no signif-icant incongruence between the two mitochondrial markers (P = 0.15). Despite significant incongruences found when all three regions are combined (P = 0.001), they were concatenated for the 16 A. mystacinus, one A. agrarius and one A. peninsulae samples sequenced for all the three markers. Therefore, more sites were available for analysis.
A consensus tree, constructed from the topologies retrieved by MP, ML and neighbour-joining, is pre-sented in Fig. 3. Again, the two main clades (A and B) are strongly supported (BP: 100%). Moreover, the two subclades B1 and B2 appear much more robust (BP: 67–100%). Within them, the animals from south-west-ern Turkey are associated with the population from Crete.
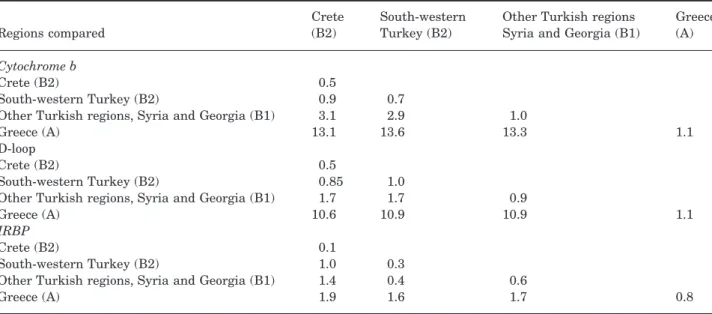
A summary of the K2P sequence divergence values is presented in Table 2, both within and between the observed clades. To determine the precise genetic relationships between the animals from Crete and those from south-western Turkey, subclade B2 was divided into two parts. The cytochrome b, D-loop and IRBP sequences indicate that the Balkan popula-tions are strongly separated from the oriental ani-mals with an important level of genetic divergence (means of 13.3, 10.7 and 1.7% of K2P distance, respectively). Within this last group, the two mito-chondrial regions show that the animals from south-western Turkey are separated from those from other oriental regions (2.9 and 1.7%, respectively). On the contrary, they are very similar to those from Crete (0.9 and 0.85%, respectively). The IRBP results are less clear and show a closer relationship between all the Turkish populations compared to the animals from Crete.
DIVERGENCETIME
The relative rate test (Robinson et al., 1998) indicated no significant rate heterogeneity (both Ks and Ka) for
the cytochrome b and D-loop regions between the different clades. On the contrary, Ks comparisons for
IRBP showed marked differences in evolutionary rates, clade A exhibiting an elevated rate as compared to the other clades. This excluded the use of IRBP data for divergence time estimates as the molecular clock is not homogeneous for it. Moreover, the use of the D-loop was also impossible for divergence time estimates
58
M. JOHAN ET AL.Figure 2. Neighbour-joining tree obtained for the three studied genetic regions, the mitochondrial cytochrome b and D-loop regions, and the nuclear IRBP gene. Apodemus agrarius and A. peninsulae are used to root the tree. For each main node, the different robustness indices are indicated as follows: distance bootstrap support/maximum parsimony bootstrap support/maximum likelihood bootstrap support.
Cytochrome b
Apodemus agrarius Apodemus peninsulae 100/99/100 98/96/55 99/99/88 100/100/100 100/99/100 95/88/85 JRM-480 JRM-535 JRM-281 JRM-282 JRM-542 JRM-544 JRM-545 JRM-261 JRM-262 JRM-477 EB-1816 EB-1170 EB-1169 JRM-478 JRM-464 JRM-458 JRM-535 JRM-281 JRM-282 JRM-480 JRM-477 JRM-458 JRM-464 JRM-478 100/100/100 98/93/73 JRM-262 JRM-545 JRM-536 JRM-261 JRM-544 JRM-542 JRM-543 EB-177 EB-1170 EB-1169 EB-1816 EB-178 EB-98 Clade A: Greece, Bulgaria Clade B1: North Western and Eastern Turkey, Syria, Georgia Clade B2: Crete, South Western Turkey IRBP Apodemus peninsulae Apodemus agrarius 90/91/86 100/100/100 49/87/75 42/61/61 35/62/54 99/95/96 JRM-464 JRM-477 JRM-478 JRM-458 JRM-545 EB-178 EB-1170 EB-1169 JRM-262 JRM-544 JRM-261 JRM-542 JRM-535 JRM-480 JRM-281 JRM-282 Clade A: Greece, Bulgaria Clade B1: North Western, South Western and Eastern Turkey, Syria, Georgia Clade B2: Crete EB-1816 D-Loop Apodemus agrarius Apodemus peninsulae 62/39/36 100/100/100 100/100/99 Clade A: Greece, Bulgaria Clade B2: Crete, South Western Turkey Clade B1: North Western and Eastern Turkey, Syria, Georgia NJ/MP/MLBIOGEOGRAPHY OF THE BROAD-TOOTHED FIELD MOUSE
59
as the data matrix was saturated when sequences of Mus and Rattus (used as calibration points) were added. The analysis was therefore performed only using the cytochrome b region.
The ML distance between Mus and Rattus, which diverged 12 Mya, is 0.211. That between the subgenus Apodemus (A. agrarius and A. peninsulae) and the subgenus Sylvaemus (A. mystacinus), which diverged 7.9 Mya, is 0.167. These values give a rate of 0.0175– 0.0211 (Mus/Rattus and Apodemus/Sylvaemus) ML distance per million years. When this rate is applied to the different dichotomies within A. mystacinus, the following molecular dates are obtained: 4.2–5.1 Myr for the separation between the Balkan and Oriental lineages, and 1.0–0.9 Myr for the separation between
the animals from Crete/south-western Turkey and the other Middle East populations.
DISCUSSION
TAXONOMYOF APODEMUS MYSTACINUS
Johns & Avise (1998) stated that cytochrome b differ-entiation is highly congruent with traditional species boundaries. More recently, Bradley & Baker (2001) used a partition of genetic distances values (using the K2P parameters) in determining specific boundaries under the ‘genetic species concept’. They also evi-denced a strong correlation between genetic distance values and species boundaries, at least for different
Figure 3. Neighbour-joining tree obtained from the analysis of the concatenation of the three genetic regions for 16 Apodemus mystacinus individuals and 2775 positions. A. agrarius and A. peninsulae are used to root the tree. For each main node, the different robustness indices are indicated as follows: distance bootstrap support/maximum parsimony bootstrap support/maximum likelihood bootstrap support.
Apodemus agrarius Apodemus peninsulae 100/100/100 100/100/100 100/100/100 99/99/89 99/89/67 100/99/89 JRM-282 Clade A: Greece, Bulgaria Clade B1: North Western and Eastern Turkey, Syria, Georgia Clade B2: Crete, South Western Turkey JRM-535 JRM-281 JRM-480 JRM-542 JRM-544 JRM-261 JRM-545 JRM-262 JRM-477 JRM-458 JRM-464 JRM-478 NJ/MP/ML EB-178 EB-1169 EB-1170 EB-1816
60
M. JOHAN ET AL.rodent and bat genera. Taking this concept into account and the values of genetic divergence observed between other closely related and well-defined Apode-mus species such as A. sylvaticus, A. flavicollis, A. hermonensis, A. alpicola and A. uralensis (always 10–12% K2P distance, Michaux et al., 2002, 2003; 2004a, b), it can be assumed that the level of genetic divergence between clade 1 (Balkan population) and clade 2 (Turkish and near-east populations) (13.3% K2P distance) corresponds to different species. Simi-lar results are obtained by considering the other genetic regions (Table 2).
Therefore, this strongly confirms Storch’s (1977) and Mezhzherin’s (1997) statements about the specific status of A. epimelas and A. mystacinus. These results are also consistent with the recent morphometric study of Vohralík et al. (2002) as well as with the allo-zyme research of Filippucci et al. (2002).
Moreover, they show for the first time, the existence of two well-separated genetic groups in Turkey and in the near-east. The first one corresponds to the popu-lations from south-western Turkey and Crete; the sec-ond to all the other populations from Turkey, Syria and Georgia. They are separated by a quite important level of genetic divergence (3% K2P distance for cytochrome b), which suggests that they could be con-sidered as different subspecies. Ondrias (1966) distin-guishes a subspecies, A. mystacinus rhodius, in the islands of Crete, Karpathos and Rhodos, which is likely to be present also in south-western Turkey, con-sidering these results. However, Vohralík et al. (2002), failed to show any morphometrical differentiation between these last populations as compared to the
other oriental ones. Additional genetic but also mor-phological studies on further samples of Turkish A. mystacinus would be extremely useful to confirm this hypothesis.
BIOGEOGRAPHYOF APODEMUS MYSTACINUS
Appearance of A. mystacinus and A. epimelas
A. mystacinus appeared during the Middle Pliocene (Martín Suárez & Mein, 1998). During this period, the species was widespread throughout Europe, although with lower densities due to competition with many other rodents present at that time (Gliridae, Eomy-idae, Sciuridae) (Michaux & Pasquier, 1974). It can therefore be assumed that one of the late Pliocene (4.2–5.1 Mya) climate change (maybe associated with the Messinian crisis), linked with low populations densities, led to the disappearance of many animals and the isolation of the two main groups, one in the Balkan region (where it is still confined at present; A. epimelas) and the other, A. mystacinus s.s. in the near and middle east (Turkey, Israel).
Although the Marmara Sea was frequently replaced by dry lands during the Quaternary ice ages, the Euro-pean lineages do not seem to have invaded the oriental region and vice-versa (Vohralík et al., 2002). During the Quaternary, the two broad-toothed field mice lin-eages were probably established in the Balkan and Oriental regions a long time ago (Michaux & Pasquier, 1974). Therefore, each lineage could have prevented the colonization of invaders from the other. Indeed, once established, resident rodents often aggressively exclude newcomers (Granjon & Cheylan, 1989).
Table 2. Degree of within and between clades sequence divergence (in per cent) with Kimura 2 parameters distance for the cytochrome b gene, D-loop and IRBP gene
Regions compared
Crete (B2)
South-western Turkey (B2)
Other Turkish regions Syria and Georgia (B1)
Greece (A) Cytochrome b
Crete (B2) 0.5
South-western Turkey (B2) 0.9 0.7
Other Turkish regions, Syria and Georgia (B1) 3.1 2.9 1.0
Greece (A) 13.1 13.6 13.3 1.1
D-loop
Crete (B2) 0.5
South-western Turkey (B2) 0.85 1.0
Other Turkish regions, Syria and Georgia (B1) 1.7 1.7 0.9
Greece (A) 10.6 10.9 10.9 1.1
IRBP
Crete (B2) 0.1
South-western Turkey (B2) 1.0 0.3
Other Turkish regions, Syria and Georgia (B1) 1.4 0.4 0.6
BIOGEOGRAPHY OF THE BROAD-TOOTHED FIELD MOUSE
61
THEPRESENCEOFTWOGENETICGROUPSIN TURKEY
ANDTHEIRRELATIONSHIPWITHTHE CRETAN
POPULATION
According to the mitochondrial DNA data (Fig. 2), two different genetic groups appear to live in Turkey: the first one corresponding to the majority of Turkish and Syrian populations (clade B1); the second one associ-ating the animals from south-western Turkey (Anta-lya region) with those from Crete (clade B2). The divergence time analysis estimates a separation between them approximately 1–0.9 Mya. During this period, important climatic alterations arose through-out Europe and the near east (Fauquette, Guiot & Suc, 1998), so this structure could be explained by isolation of two groups of A. mystacinus in two different Turk-ish refugia (one in the south-western region, the sec-ond somewhere in another oriental region) during one of the Quaternary climatic oscillations. Indeed, as these climatic changes also altered the vegetation cover of the region (Borisova, 1993; Fauquette et al., 1998, 1999), the distribution of A. mystacinus in Tur-key was probably deeply influenced during this period. Crete would have been colonized recently from ani-mals living in south-western Turkey.
However, the nuclear IRBP gene does not show the same pattern at all, which suggests that the animals from Crete are well separated from the Turkish pop-ulations although they seem closely related. As IRBP genes evolve more slowly than the two mtDNA regions, it would better reflect an ancient and more complex evolutionary history of the broad-toothed field mouse in this region and suggest that a limited number of animals colonized Crete from Turkey a long time ago. This hypothesis is corroborated by the important number of DNA types (five different DNA sequences for five samples observed in the three stud-ied genes) that are genetically weakly differentiated
(Table 2), characterizing the Cretan population.
Indeed, this kind of pattern generally corresponds to a recent genetic differentiation after an important ancient bottleneck or founder effect (Avise, 2000). The colonization of Crete from Turkish populations would have occurred via the Rhodes and Karpathos islands during one of the Quaternary ice ages, when the sea level decreased. When it rose again, A. mystacinus stayed isolated on the island for some time, leading to the emergence of a particular genetic lineage. It later invaded south-western Turkey from Crete, Rhodes and Karpathos during a new drop in sea level or via recent anthropogenic introductions and hybridized with south-western Turkish animals, giving them their particular mtDNA. This would explain the pres-ence of two genetically differentiated mtDNA lineages in continental Turkey that are not evidenced by the nuclear gene.
However, this hypothesis is not corroborated by palaeogeographical and geodynamic data (Meulen-kamp et al., 1988; Dermitzakis, 1990) attesting that Crete has not been connected with the mainland since the Early Pliocene, 5 Mya, even during the main dramatic Quaternary ice ages. Fossil records of A. mystacinus are also lacking in Crete (Kotsakis, 1990) despite well-documented palaeontological sites. Finally, as explained above, the colonization of Turkey from an insular lineage would have been difficult con-sidering that an A. mystacinus population was already present in Turkey during the Quaternary period (Storch, 1977) and that they could have prevented the colonization of new invaders. This hypothesis is cor-roborated by the study of Darlington (1959), which suggested that the majority of islands were invaded by mainland taxa and not the reverse. This was the case for the spiny mouse, Acomys minous, which colonized Crete recently from oriental regions, via anthropo-genic introductions associated with the important maritime traffic between Turkey and many eastern Mediterranean islands since the Bronze Age (Pulak, 1995; Barome et al., 2001). As far as another closely related species, the wood mouse Apodemus sylvaticus, is concerned, it seems that the colonists of Crete find their origin in Greece (J. Michaux, unpubl. data) and were also introduced recently by man.
Therefore, although our genetic data strongly sug-gest an ancient colonization of Crete by the broad-toothed field mouse followed by a secondary invasion of this insular population in continental Turkey, the question still remains open about the origin of the south-western Turkish genetic lineage. The study of a larger sample from this region, as well as from the islands of Rhodes and Karpathos, should help to con-clude definitively about this question.
CONCLUSIONS
The phylogenetic relationships between the different lineages existing within A. mystacinus inferred from cytochrome b, D-loop and IRBP sequences show evi-dence for an important level of genetic divergence between the animals from the Balkans and those from Turkey and the near east. This is in favour of a dis-tinctive specific status for these populations, namely A. epimelas and A. mystacinus, respectively. Moreover, the broad-toothed field mice from south-western Tur-key appear to be closely related to the animals from Crete but clearly distinct from the populations of the other oriental regions. This supports a distinct subspe-cific level (A. m. rhodius) for the insular as well as for the south-western Turkish broad-toothed field mice.
From a biogeographical point of view, it can be assumed that one of the late Pliocene or early Pleis-tocene cooling periods led to the isolation of two main
62
M. JOHAN ET AL.groups of A. mystacinus: one in the Balkan region and the other one in Turkey and the near east (Syria, Israel). Moreover, it is suggested that the isolation of one population of A. mystacinus in Crete during one of the Quaternary ice ages would have led to the emer-gence of two well-differentiated genetic groups in the eastern Mediterranean region. One of these was in Crete and south-western Turkey, after a recent sec-ondary invasion of the insular population in Turkey; the other in northern and eastern Turkey as well as in the near east. If this hypothesis is confirmed, the broad-toothed field mouse would be a rare example of current mammalian species that colonized the Medi-terranean islands naturally without human interven-tion (Vigne, 1999).
ACKNOWLEDGEMENTS
We thank Prof. R. Libois for his helpful comments on the manuscript and Dr Sandrina Kinet for her help with the laboratory experiments. We thank all those people who provided tissue samples of A. mystacinus: Petr Benda, Daniel Frynta, Pavel Munclinger, Petra Nová, Jovana Sadlová, Vladimír Vohralík.
This work was supported by a Belgian FNRS fellow-ship to J. R. Michaux (mandat ‘collaborateur scienti-fique’) and a financial grant of the Belgian FNRS (crédits aux chercheurs, crédits pour brefs séjours à l’étranger to JRM and Roland Libois). Financial sup-port was also provided by the Grant Agency of The Czech Republic, GACR 42-201-50.
REFERENCES
Avise JC. 2000. Phylogeography. The history and formation of species. Cambridge, MA: Harvard University Press. Bahl A, Pfenninger M. 1996. A rapid method of DNA
isola-tion using laundry detergent. Nucleic Acids Research 24: 1587–1588.
Barome PO, Lymberakis P, Monnerot M, Gautun JC. 2001. Cytochrome b sequences reveal Acomys minous (Rodentia, Muridae) paraphyly and answer the question about the ancestral karyotype of Acomys dimidiatus. Molec-ular Phylogenetics and Evololution 18: 37–46.
Bibb MJ, Van Etten RA, Wright CT, Walberg MW, Clay-ton DA. 1981. Sequence and gene organization of mouse mitochondrial DNA. Cell 26: 167–180.
Borisova OK. 1993. Landscape and climate of the South-Central and Southeastern Russian plain during Pliocene. Abstracts from a USGS Workshop, Herdon, VA, 61. Bradley RD, Baker RJ. 2001. A test of the genetic species
concept: Cytochrome-b sequences and mammals. Journal of Mammalogy 82: 960–973.
Darlington M. 1959. Area Climate and Evolution. Evolution 13: 488–510.
Dermitzakis MD. 1990. Paleogeography, geodynamic pro-cesses and event stratigraphy during the Late Cenozoic of
the Aegean area. Biogeographical aspects of insularity (Inter-national Symposium, Rome, 1987). Atti Dei Convegni Lincei (Acc Nat Lincei) 85: 263–288.
Farris JS. 1985. Distance data revisited. Cladistics 1: 67–85. Fauquette S, Guiot J, Suc JP. 1998. A method for climatic reconstruction of the Mediterranean Pliocene using pollen data. Palaeogeography, Palaeoclimatology, Palaeoecology 144: 183–201.
Fauquette S, Suc JP, Guiot J, Diniz F, Feddi N, Zheng Z, Bessais E, Drivaliari A. 1999. Climate and biomes in the West Mediterranean area during the Pliocene. Palaeogeog-raphy, Palaeoclimatology, Palaeoecology 152: 15–36. Filippucci MG, Macholán M, Michaux JR. 2002. Genetic
variation and evolution in the genus Apodemus (Muridae: Rodentia). Biological Journal of the Linnean Society 75: 395– 419.
Gadaleta G, Pepe G, De Candia G, Quagliariello C, Sbisa E, Saccone C. 1989. The complete nucleotide sequence of the Rattus norvegicus mitochondrial genome: cryptic signals revealed by comparative analysis between vertebrates. Jour-nal of Molecular Evolution 28: 497–516.
Granjon L, Cheylan G. 1989. The fate of black rats (Rattus rattus, L.) introduced on an island, as revealed by radio-tracking. Comptes Rendus de l’Académie des Sciences, Serie III-Science de la Vie-Life Sciences 309: 571–575.
Hassanin A, Lecointre G, Tillier S. 1998. The ‘evolutionary signal’ of homoplasy in protein-coding gene sequences and its consequences for a priori weighting in phylogeny. Comptes Rendus de l’Académie des Sciences, Serie III-Sciences de la Vie-Life Sciences 32: 611–620.
Jacobs LL, Downs WR. 1994. The evolution of murine rodents in Asia. In: Tomida Y, Li C, Setoguchi T, eds. Rodent and lagomorph families of Asian origin and diversification. Tokyo: National Science Museum, 149–156.
Jacobs LL, Winkler DA, Murry PA. 1989. Modern mammal origins – evolutionary grades in the early Cretaceous of North America. Proceedings of the National Academy of Sci-ences, USA 86: 4992–4995.
Jacobs LL, Flynn LJ, Downs WR, Barry JC. 1990. Quo vadis Antemus? The Siwalik muroid record. In: Linday EH, Fahlbusch V, Mein P, eds. European mammal chronology. New York: Plenum Press, 573–586.
Jaeger JJ, Tong H, Denys C. 1986. The age of the Mus-Rattus divergence – paleontological data compared with the molecular clock. Comptes Rendus de l’Académie des Sciences, Series II 302: 917–922.
Johns GC, Avise JC. 1998. A comparative summary of genetic distances in the vertebrates from the mitochondrial cytochrome b gene. Molecular Biology and Evolution 15: 1481–1490.
Kocher TD, Thomas WK, Meyer A, Edwards SV, Paabos S, Villablanca FX, Wilson AC. 1989. Dynamics of mito-chondrial-DNA evolution in animals – amplification and sequencing with conserved primers. Proceedings of the National Academy of Sciences, USA 86: 6196–6200. Kock D, Malec F, Storch G. 1972. Rezente und Subfossile
Kleinsäuger aus dem Vilayet Elazig, Ost-Anatolien. Zeitschrift fur Säugetierkunde – International Journal of Mammalian Biology 37: 204–229.
BIOGEOGRAPHY OF THE BROAD-TOOTHED FIELD MOUSE
63
Kotsakis K. 1990. Insular and non insular vertebrate fossil faunas in the eastern Mediterranean islands. International Symposium on Biogeographical Aspect of Insularity, Rome, 18–22 May 1987, 289–334.
Martín Suárez E, Mein P. 1998. Revision of the genera Parapodemus, Apodemus, Rhagamys and Rhagapodemus (Rodentia, Mammalia). Geobios 31: 87–97.
Meulenkamp J-E, Wortel MJR, van Wamel WA, Spakman W, Hoogerduyn Strating E. 1988. On the Hellenic subduc-tion zone and the geodynamic evolusubduc-tion of Crete since the Late Middle Miocene. Tectonophysics 146: 203–215. Mezhzherin SV. 1997. Revision of mice genus Apodemus
(Rodentia, Muridae) of Northern Eurasia. Vestnik Zoologii 31: 29–41. (In Russian, with English summary.)
Michaux J, Pasquier L. 1974. Dynamique des populations de mulots (Rodentia, Apodemus) en Europe durant le Quater-naire. Premières données, BGSF 7 (XVI): 431–439.
Michaux J, Aguilar J-P, Montuire S, Wolff A, Legendre S. 1997. Les Murinae (Rodentia, Mammalia) néogènes du Sud de la France: Évolution et paléo environnements. Geobios 20: 379–385.
Michaux JR, Reyes A, Catzeflis F. 2001. Evolutionary his-tory of the most speciose mammals: molecular phylogeny of muroid rodents. Molecular Biology and Evolution 18: 2017– 2031.
Michaux JR, Chevret P, Filippucci MG, Macholán M. 2002. Phylogeny of the genus Apodemus with a special emphasis on the subgenus Sylvaemus using the nuclear IRBP gene and two mitochondrial markers: cytochrome b and 12S rRNA. Molecular Phylogenetics and Evolution 23: 123–136.
Michaux JR, Magnanou E, Paradis E, Nieberding C, Libois RM. 2003. Mitochondrial phylogeography of the woodmouse (Apodemus sylvaticus) in the Western Palearctic region. Molecular Ecology 12: 685–697.
Michaux JR, Filippucci M-G, Libois R. 2004a. Phylo-geographic history of the yellow-necked fieldmouse (Apo-demus flavicollis) in Europe and in the Near and Middle East. Molecular Phylogenetics and Evolution 32: 188–198. Michaux JR, Libois RM, Filippucci M-G. 2004b. So close
and so different. Comparative phylogeography of two closely related rodent species (Apodemus flavicollis and A. sylvaticus) in the Western Palearctic region. Heredity 94: 52–63.
Mitchell-Jones AJ, Amori G, Bogdanowicz W, Kry tufek B, Reijnders PJH, Spitzenberger F, Stubbe M, Thissen JBM, Vohralík V, Zima J. 1999. The atlas of European mammals. London: Academic Press, 484.
Niethammer J. 1978. Apodemus mystacinus (Danford et Alston 1877) – Felsenmaus. In: Niethammer J, Krapp F, eds. Handbuch der Säugetiere Europas, Bd I. Wiesbaden: Akade-mische Verlagsgesellschaft, 306–324.
Ondrias JC. 1966. The taxonomy and geographical distribu-tion of the rodents of Greece. Säugetierkundliche Mitteilun-gen 14 (Sonderheft): 1–136.
Philippe H. 1993. MUST, a computer package of management utilities for sequences and trees. Nucleic Acids Research 21: 5264–5272.
sˇ
Philippe H, Douzery E. 1994. The pitfalls of molecular phy-logeny based on four species as illustrated by Cetacea/Artio-dactyla relationships. Journal of Mammal Evolution 2: 133– 152.
Pulak C. 1995. ‘Das Schiffswrack von Uluburun’. In: Von Zab-ern P, ed. Poseidons Reich: Archäologie Unter Wasser. Berlin: Verlag Mainz am Rhein.
Robinson M, Gouy M, Gautier C, Mouchiroud D. 1998. Sensitivity of the relative-rate test to taxonomic sampling. Molecular Biology and Evolution 15: 1091–1098.
Sambrook J, Fritsch EF, Maniatis T. 1989. Molecular clon-ing: a laboratory manual, 2nd edn. Cold Spring Harbor, New York: Cold Spring Harbor Laboratory Press.
Serizawa K, Suzuki H, Tsuchiya K. 2000. A phylogenetic view on species radiation in Apodemus inferred from varia-tion of nuclear and mitochondrial genes. Biochemical Genet-ics 38: 27–40.
Spitzenberger F. 1973. Zur Kleinsäugerfauna West-Anatoliens, Teil II. In: Felten H, Spitzenberger F, Storch G, eds. Senckenbergiana Biologia 54: 227–290.
Stanhope MJ, Czelusniak J, Si JS, Nickerson J, Good-man M. 1992. A molecular perspective on mammalian evo-lution from one encoding interphotoreceptor retinoid binding protein, with convincing evidence for bat monophyly. Molec-ular Phylogenetics and Evolution 1: 148–163.
Storch G. 1977. Die Ausbreitung der Felsenmaus (Apodemus mystacinus): Zur Problematik der Inselbesiedlung und Tiergeographie in der Ägäis. Natur und Museum 107: 174– 182.
Suzuki H, Sato JJ, Tsuchiya K, Luo J, Zhang P, Wang Y-X, Jiang X-L. 2003. Molecular phylogeny of wood mice (Apo-demus, Muridae) in East Asia. Biological Journal of the Lin-nean Society 80: 469–481.
Suzuki H, Tsuchiya K, Takezaki N. 2000. A molecular phylogenetic framework for the Ryukyu endemic rodents Tokudaia osimensis and Diplothrix legata. Molecular Phylogenetics and Evolution 15: 15–24.
Swofford DL. 2000. PAUP*, phylogenetic analysis using par-simony (*and other methods), Version 4. Sunderland, MA: Sinauer.
Vigne J. 1999. The large ‘true’ Mediterranean islands as a model for the Holocene human impact on the European ver-tebrate fauna? Recent data and new reflections. In: Benecke N, ed. The Holocene history of the European vertebrate fauna, modern aspects of research (workshop, 6th-9th April 1998, Berlin). Berlin: Deutsches Archaeologisches Institut, Eurasien-Abteilung, 295–322.
Vohralík V, Frynta D, Mikulová P, Benda P, Nová P. 2002. Multivariate morphometrics of Apodemus mystacinus in the Near East and its divergence from European A. m. epimelas (Mammalia: Rodentia). Israel Journal of Zoology 48: 135–148.
Wu CI, Li WH. 1985. Evidence for higher rates of nucleotide substitution in rodents than in man. Proceedings of the National Academy of Sciences, USA 82: 1741–1745. Yang ZH. 1996. Among-site rate variation and its impact on
phylogenetic analyses. Trends in Ecology and Evolution 11: 367–372.