HAL Id: hal-00435262
https://hal.archives-ouvertes.fr/hal-00435262
Submitted on 24 Nov 2009
HAL is a multi-disciplinary open access
archive for the deposit and dissemination of
sci-entific research documents, whether they are
pub-lished or not. The documents may come from
teaching and research institutions in France or
abroad, or from public or private research centers.
L’archive ouverte pluridisciplinaire HAL, est
destinée au dépôt et à la diffusion de documents
scientifiques de niveau recherche, publiés ou non,
émanant des établissements d’enseignement et de
recherche français ou étrangers, des laboratoires
publics ou privés.
CanICA: Model-based extraction of reproducible
group-level ICA patterns from fMRI time series
Gaël Varoquaux, Sepideh Sadaghiani, Jean Baptiste Poline, Bertrand Thirion
To cite this version:
Gaël Varoquaux, Sepideh Sadaghiani, Jean Baptiste Poline, Bertrand Thirion. CanICA: Model-based
extraction of reproducible group-level ICA patterns from fMRI time series. Medical Image Computing
and Computer Aided Intervention, Sep 2009, London, United Kingdom. pp.1. �hal-00435262�
CanICA: Model-based extraction of reproducible
group-level ICA patterns from fMRI time series
G. Varoquaux1, S. Sadaghiani2, J.B. Poline2, B. Thirion1
1
INRIA, Saclay-Ile de France, Saclay, France, 2
CEA/Neurospin, Saclay, France⋆
Abstract. Spatial Independent Component Analysis (ICA) is an in-creasingly used data-driven method to analyze functional Magnetic Res-onance Imaging (fMRI) data. To date, it has been used to extract mean-ingful patterns without prior information. However, ICA is not robust to mild data variation and remains a parameter-sensitive algorithm. The validity of the extracted patterns is hard to establish, as well as the sig-nificance of differences between patterns extracted from different groups of subjects. We start from a generative model of the fMRI group data to introduce a probabilistic ICA pattern-extraction algorithm, called CanICA (Canonical ICA). Thanks to an explicit noise model and canon-ical correlation analysis, our method is auto-calibrated and identifies the group-reproducible data subspace before performing ICA. We compare our method to state-of-the-art multi-subject fMRI ICA methods and show that the features extracted are more reproducible.
1
Introduction
Resting-state fMRI is expected to give insight into the intrinsic structure of the brain and its networks. In addition, such protocols can be easily applied to impaired subjects and can thus yield useful biomarkers to understand the mechanisms of brain diseases and for diagnosis. Spatial ICA has been the most successful method for identifying meaningful patterns in resting-state fMRI data without prior knowledge. The use of the resulting patterns is widespread in cognitive neuroscience, as they are usually well-contrasted, separate different underlying physiological, physical, and cognitive processes, and bring into light relevant long-range cognitive networks.
However, validation of the resulting individual patterns suffers from the lack of testable hypothesis. As a result, cognitive studies seldom rely on automatic analysis, and relevant ICA maps are cherry picked by eye to separate them from noise-induced patterns. Probabilistic ICA models have been used to pro-vide pattern-level noise-rejection criteria [1] or likelihood for the model [2], but have yet to provide adequate auto-calibration and pattern-significance testing. The lack of reproducibility is detrimental to group analysis: various, often non-overlapping, patterns have been published [3,4] and the statistical frameworks for comparison or inference on ICA maps have to be further developed.
⋆Funding from INRIA-INSERM collaboration. The fMRI set was acquired in the context of the SPONTACT ANR project
To allow for group analysis, it is important to extract from a group of sub-jects ICA maps that are well-represented in the group. Various strategies have been adopted: group ICA [5] concatenates individual time series; tensor ICA [6] estimates ICA maps across subjects with different loadings per subject; NEDICA [4] merges ICA maps by hierarchical clustering.
In this paper, we present a novel model and a method, that we dub CanICA, to extract only the reproducible ICA maps from group data. The strength of this method lies in the elimination of the components non-reproducible across sub-jects using model-informed statistical testing and canonical correlation analysis (CCA). We compare the reproducibility of features extracted by our method to features extracted using tensor ICA and group ICA, but could not compare to NEDICA since it suppresses in some way between-subject variability.
2
Methods
2.1 Generative model: from group-level patterns to observations At the group level, we describe intrinsic brain activity by a set of spatial patterns B corresponding to networks common to the group. We give a generative model to account for inter-subject variability and observation noise.
The activity recorded on each subject s can be described by a set of subject-specific spatial patterns Ps, which are a combination of the group-level patterns
B with loadings given by Λs and additional subject-variability denoted as a
residual matrix Rs. If we write the spatial patterns B, Psand Rsas npatterns×
nvoxels matrices, for each subject s, Ps = ΛsB + Rs. In other words, at the
group level, considering the group of patterns (vertically concatenated matrices) P = {Ps}, R = {Rs}, and Λ = {Λs}, s = 1 . . . S,
P = Λ B + R. (1) For paradigm-free acquisitions, there is no specific time course set by an external stimulus or task, and for each acquisition-frame time point a mixture of different processes, described by different patterns, is observed. The observed fMRI data is a mixture of these patterns confounded by observation noise: let Ys be the
resulting spatial images in BOLD MRI sequences for subject s (an nframes×
nvoxels matrix), Esthe observation noise, and Wsa loading matrix such that:
Ys= WsPs+ Es. (2)
2.2 Estimating group-reproducible patterns from fMRI data
Noise rejection using the generative model. Starting from fMRI image se-quences, {Ys, s= 1...S}, time-sliced interpolated and registered to the MNI152
template, we separate reproducible patterns from noise by estimating succes-sively each step of the above hierarchical model.
First, we separate observation noise Es from subject-specific patterns Ps
(Eq. 2) through principal component analysis (PCA). The principal components explaining most of the variance for a given subject’s data set form the patterns of interest, while the tail of the spectrum is considered as observation noise. Using a singular value decomposition (SVD), Ys= UsΣsVTs. The n first columns of
VT
s constitute the “whitened” patterns ˆPs that we retain: ˆPs= (Vs)1...n, and
the residual constitutes the observation noise: ˆEs= Ys− (UsΣsVsT)1...n.
As PCA can be interpreted as latent-variable separation under the assump-tion of normally-distributed individual random variates, we model observaassump-tion noise as normally-distributed. Following [7], we set the number n of significant PCA components retained by drawing a sample null-hypothesis dataset using a random normal matrix and comparing the bootstrap stability of PCA patterns for the measured signal and the null-hypothesis sample. Unlike information-based criteria used in previous methods [1,5] for order selection, such as approx-imations of model evidence or BIC, the selected number of significant compo-nents does not increase when adding artificially number of noise sources[7], and thus does not diverge with long fMRI time series. This is important to avoid extracting group-reproducible patterns from observation noise.
To identify a stable-component subspace across subjects, estimating Eq. (1), we use a generalization of canonical correlation analysis (CCA). CCA is used to identify common subspaces between two different datasets. While there is no unique generalization to multiple datasets, an SVD of the various whitened and concatenated datasets can be used and is equivalent to standard CCA in the two-datasets case [8]. Given ˆP = { ˆPs}, SVD yields ˆP = Υ Z ΘT where ΘT forms
the canonical variables, and Z the canonical correlations, which yield a measure of between-subject reproducibility. Estimation of the inter-subject reproducible components ˆB is given by the vectors of ΘT for which the corresponding
canon-ical correlation Z is above significance threshold. ˆΛ is identified as the corre-sponding loading vectors of Υ Z. For a given number of selected components, this estimator minimizes the sum of squares for the residual ˆR = ˆP − ˆΛ ˆB.
The significance threshold on the canonical correlations is set by sampling a bootstrap distribution of the maximum canonical correlation using ˆEs, the
subject observation noise identified previously, instead of ˆPs. Selected canonical
variables have a probability p < 0.05 of being generated by the noise.
Identifying independent features in the group-level patterns The se-lected group-level components B form reproducible patterns of task-free acti-vation, but they represent a mixture of various processes and are difficult to interpret for lack of distinguishable shape standing out. We perform source sep-aration using spatial ICA on this subspace. From the patterns B we estimate a mixing matrix M and group-level independent components A using the FAS-TICA algorithm [9]: B = M A. FASFAS-TICA is an optimization algorithm which successively extracts patterns with maximally non-Gaussian marginal distribu-tions. This separation corresponds to identifying the maximum-contrast patterns in the subspace of interest. These spatial patterns correspond to
minimally-dependant processes and contain identifiable physiological, physical, or neuronal components.
Consistent with the FASTICA model, the main regions that form the nodes of the functional networks within the resulting patterns are the regions with values corresponding to the non-Gaussian tails of the histogram. Following [10], we model the non-interesting voxels as normally-distributed and estimate the null distribution from the central part of the histogram. The voxels of interest are selected using an uncorrected p-value of 10−3. We use a specificity criterion
rather than a false discovery rate as it yields more stable results, especially on the very-long-tailed distributions that we encounter. As the total number of voxels in the brain is about 40 000, we expect no more than 40 false positives, which corresponds to a small false-discovery rate.
2.3 Model validation for inter-subject generalization
The validation criteria for an ICA decomposition are unclear, as this algorithm is not based on a testable hypothesis. The use of ICA is motivated by the fact that the patterns extracted from the fMRI data display meaningful features in relation to our knowledge of functional neuroanatomy. These features should be comparable between subjects, and thus generalize to new subjects.
To test the reproducibility of the results across subjects, we split our group of subjects in two and learn ICA maps from each sub-group: this yields A1 and
A2. We compare the overlap of thresholded maps and reorder one set to match
maps by maximum overlap. Reproducibility can be quantified by studying the cross-correlation matrix C = AT
1A2. For unit-normed components, Ci,j is 1 if
and only if (A1)i and (A2)j are identical.
We define two measures for overall stability and reproducibility of the maps. First, a measure of the overlap of the subspaces selected in both groups is given by the energy of the matrix: E = tr (CTC). To compare this quantity for different
subspace sizes, we normalize it by the minimum dimension of the subspaces, d = min(rank A1,rank A2): e = 1dtr (CTC). e quantifies the reproducibility of
the subspace spanned by the maps. For e = 1, the two groups of maps span the same subspace, although individual independent components may differ. Second, we use an overall measure of reproducibility for the maps: the normalized trace of the reordered cross-correlation matrix C, t = 1
dtr (C). Indeed, after A2has been
reordered to maximize matching with A1, the diagonal coefficients of C give the
overlap between matched components. Finally, the maximum value of each row and column of C expresses the best match each component learned in one group on the set learned in the other. We plot its histogram. This indicator accounts for components of one group matching multiple components of the other.
3
Results
3.1 Extracted group-level patterns of interest
Twelve healthy volunteers were scanned after giving informed consent. 820 EPI volumes were acquired every T R = 1.5 s at a 3mm isotropic resolution, during a
(a) (b)
(c) (d)
Fig. 1. ICA maps: (a) a neuronal component (default mode network), (b) a ventricular component, (c) and (d) physiological noise and motion components.
rest period of 20 minutes. CanICA identified 50 non-observation-noise principal components at the subject level (Eq. 2) and a subspace of 42 reproducible pat-terns at the group level (Eq. 1), which matches numbers commonly hand-selected by users in current ICA studies. On these long sequences, model-evidence-based methods such as those used in [1] select more than 300 components. Extracted maps can be classified by eye in neuronal components, cardio-spinal-fluid (CSF) induced fluctuations, and movement-related patterns (Fig. 1). The empirical-null-based thresholding yields best results for neuronal components (see Fig. 2). An interesting side result of these maps is that measurement artifacts such as movement or CSF noise form reproducible patterns between different subjects.
3.2 Inter-group reproducibility
We performed 38 analyses on paired groups of 6 different subjects. Out of the 76 groups, 2 yielded 20 stable components, 19 yielded 21 components, 36 yielded 22 components, 17 yielded 23 components, and the last 2 yielded 24 components. We compare our method with tensor ICA [6], running analysis using the MELODIC software on each group, and group-ICA, using the GIFT ICA toolbox (http:// icatb.sourceforge.net/). To avoid bias from the selected-subspace dimension, we run the tensor ICA and group ICA analysis specifying 23 components.
We do cross-correlation analysis on the non-thresholded ICA maps, but also use each implementation’s thresholding algorithm to separate the features of interest. For Group-ICA, the thresholding is done on the t statistics maps gen-erated by the algorithm. As these maps have low amplitude, thresholding on |t| > 3 leaves very few selected voxels; we use |t| > 2, which yields the same number of selected voxels as those selected by the two other methods.
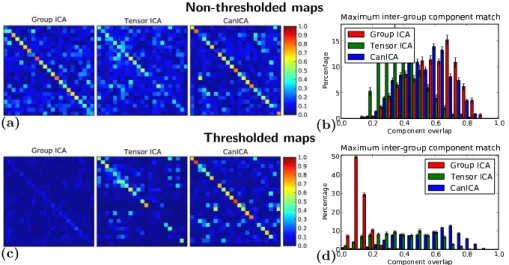
On non-thresholded maps, CanICA and Group ICA perform similarly whereas tensor ICA selects a slightly less stable subspace, and thus yields less repro-ducible ICA maps (see Fig. 3 and Tab. 1). Thresholding the maps does not significantly change the subspace stability (e) and map reproducibility (t) for CanICA, but decreases performance for tensor ICA and drastically affects sta-bility and reproducista-bility for group ICA.
(a) (b)
(c)
Fig. 2. (a) A neuronal ICA map and (b) its histogram. The null distribution, shown in red on the histogram, is estimated from the center of the histogram. (c) Corresponding thresholded map; only voxels with p < 5·10−4 (uncorrected,
two-sided test) are kept.
Non-thresholded maps
(a) (b)
Thresholded maps
(c) (d)
Fig. 3. (a) Typical cross-correlation matrices between non-thresholded ICA maps learned on two half-splits of the total 12 subjects, for group ICA, ten-sor ICA, and CanICA. (b) Histogram of the maximal overlap for each com-ponent from one half-split to a comcom-ponent from the other half. (c) and (d) cross-correlation matrices and histogram for thresholded ICA maps.
4
Discussion
Importance of capturing inter-subject variability The close correspon-dence between the overlap of the selected subspace (e) and independent-component matching quality (t) suggests that identification of the reproducible signal is a key step to identifying stable independent components. Our method explains only a small fraction of the total signal variance –less than 50% for all 12 subjects. This fraction is selected both on noise-rejection criteria, with well-specified noise models, and to best take in account inter-subject variability, by CCA. Indeed, CCA selects linear combinations of subject patterns that have highest canonical correlations. As the individual subject components are whitened, each one can contribute no more than 1 to the canonical correlation. Thus high canonical cor-relations ensure representation of a large fraction of the group. In addition, the algorithm minimizes the sum of squares of the total subject-variability residual, R. The stability of the subspace selected by the GIFT implementation of group ICA is explained by similar reasons.
We believe that subject variability is not accounted for as well by tensor ICA because the variability noise is estimated during the tensorial ICA step, for which statistical significance is hard to establish. The combination of subject-specific components present in the final estimated independent components is not guar-antied to reflect multiple-subject contributions and in practice the corresponding subject-loading vectors are often unbalanced across subjects.
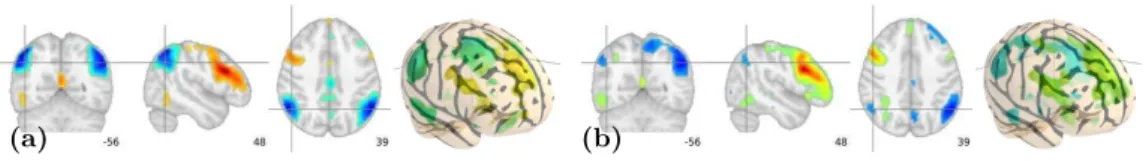
Residual ICA-patterns instability ICA extracts map by successive opti-mizations of linear combinations to maximize negentropy. It is very flexible be-cause, unlike PCA, it does not require orthogonality of the corresponding time courses. However, even with the careful noise reduction performed by CanICA, small signal perturbation can lead to different patterns. As an example, CanICA run on two eleven-subjects groups, differing only by one subject, can yield pat-terns in which the plausible neuronal activation clusters differ (Fig. 4). One should thus be careful when inferring cognitive networks using ICA and, when possible, do significance testing using other criteria, such as seed-voxel correla-tion analysis.
(a) (b)
Fig. 4. Two ICA patterns corresponding to Fig. 2 estimated from two sub-groups of 11 subjects, with 10 common subjects. On the left, (a), an activation cluster in the left superior parietal lobe is clearly visible; whereas on the right, (b), the corresponding cluster does not stand out from noise.
5
Conclusion
We have presented a novel blind pattern-extraction algorithm for fMRI data. Our method, CanICA, is auto-calibrated and extracts the significant patterns accord-ing to a noise model. From these patterns, reproducible and meanaccord-ingful features could be extracted. An important aspect of our method, specifically designed to perform group analysis, is that the features selected are more reproducible than other group-level ICA methods because it identifies a significantly-reproducible signal subspace and extracts localized features with a criteria consistent with the ICA algorithm.
CanICA is numerically efficient, as it relies solely on well-optimized linear algebra routines and performs the ICA optimization loop on a small number of components. Performance is important to scale to long fMRI time series, high-resolution data, or large groups. In addition, as the group-level pattern extraction (CCA and ICA) is very fast3, cross-validation is feasible. ICA is an
unstable algorithm with no intrinsic significance testing, but we have shown that cross-validation can be used to establish validity of group-level maps.
References
1. Beckmann, C.F., Smith, S.M.: Probabilistic independent component analysis for functional magnetic resonance imaging. Trans Med Im 23(2) (2004) 137–152 2. Guo, Y., Pagnoni, G.: A unified framework for group independent component
analysis for multi-subject fMRI data. NeuroImage 42(3) (2008) 1078 – 1093 3. Damoiseaux, J.S., Rombouts, S.A.R.B., Barkhof, F., Scheltens, P., Stam, C.J.,
Smith, S.M., Beckmann, C.F.: Consistent resting-state networks across healthy subjects. Proc Natl Acad Sci U S A 103(37) (2006) 13848–13853
4. Perlbarg, V., Marrelec, G., Doyon, J., Pelegrini-Issac, M., Lehericy, S., Benali, H.: NEDICA: Detection of group functional networks in FMRI using spatial indepen-dent component analysis. In: Proc. ISBI. (2008) 1247–1250
5. Calhoun, V.D., Adali, T., Pearlson, G.D., Pekar, J.J.: A method for making group inferences from functional MRI data using independent component analysis. Hum Brain Mapp 14(3) (2001) 140–151
6. Beckmann, C.F., Smith, S.M.: Tensorial extensions of independent component analysis for multisubject FMRI analysis. Neuroimage 25(1) (2005) 294–311 7. Mei, L., Figl, M., Rueckert, D., Darzi, A., Edwards, P.: Statistical shape modelling:
How many modes should be retained? CVPRW (2008) 1–8
8. Kettenring, J.R.: Canonical analysis of several sets of variables. Biometrika 58(3) (1971) 433–451
9. Hyv¨arinen, A., Oja, E.: Independent component analysis: algorithms and applica-tions. Neural Networks 13(4-5) (2000) 411 – 430
10. Schwartzman, A., Dougherty, R., Lee, J., Ghahremani, D., Taylor, J.: Empirical null and false discovery rate analysis in neuroimaging. NeuroImage 44(1) (2009) 71 – 82
3
Non-thresholded maps Thresholded maps
Group ICA Tensor ICA CanICA Group ICA Tensor ICA CanICA e 0.58 (0.04) 0.47 (0.06) 0.55 (0.05) 0.03 (.004) 0.31 (0.03) 0.52 (0.05) t 0.53 (0.04) 0.36 (0.03) 0.53 (0.05) 0.10 (0.01) 0.35 (0.02) 0.53 (0.04)
Table 1. Reproducibility measures e and t for Group ICA, Tensor ICA and CanICA calculated on the half-split cross-correlation matrices, both for non-thresholded and non-thresholded maps. Numbers in parenthesis give the standard deviation of the mean.