HAL Id: hal-02794272
https://hal.inrae.fr/hal-02794272
Submitted on 5 Jun 2020HAL is a multi-disciplinary open access
archive for the deposit and dissemination of sci-entific research documents, whether they are pub-lished or not. The documents may come from teaching and research institutions in France or abroad, or from public or private research centers.
L’archive ouverte pluridisciplinaire HAL, est destinée au dépôt et à la diffusion de documents scientifiques de niveau recherche, publiés ou non, émanant des établissements d’enseignement et de recherche français ou étrangers, des laboratoires publics ou privés.
Mercedes Roman Dobarco, Philippe Lagacherie, Rossano Ciampalini,
Dominique Arrouays, Nicolas Saby
To cite this version:
Mercedes Roman Dobarco, Philippe Lagacherie, Rossano Ciampalini, Dominique Arrouays, Nicolas Saby. Ensemble of topsoil texture predictions for Region Centre (France). 7. Global Workshop on Digital Soil Mapping, Jun 2016, Aarhus, Denmark. �hal-02794272�
Book of abstracts
Contents
Local Organizing Committee Aarhus University ... 6
Scientific Committee ... 6
Keynote: Climate modeling: the role of subsurface information in predicting climate change... 7
Session 1 Soil Spectroscopy ... 8
Optimizing Model Development and Validation Procedures of Partial Least Squares for Spectral Based Prediction of Soil Properties ... 9
Memory Based Learning: A New Data Mining Approach to Model and Interpret Clay Diffuse Reflectance Spectra ... 10
Utilization of the Internal Soil Standard (ISS) Method to Optimize Exchange of Soil Spectral Libraries .... 11
Session 2 Digital Soil Mapping of SOC ... 12
USDA CarbonScapes — A National Look at Carbon Landscapes and Meeting Place for the USDA Carbon Inventory and Modeling Community ... 13
Coupling high resolution data and national baseline estimates for farm scale soil carbon auditing ... 14
Global space-time soil carbon assessment ... 15
A million dollar challenge to map peatlands in Indonesia ... 16
Session 3 Digital Soil Mapping of SOC ... 17
3D modelling of Scottish soil properties ... 18
Mapping Soil Organic Carbon Stocks Using a General 3D Mapping Approach in the Northeast Tibetan Plateau, China ... 19
High resolution digital soil organic carbon mapping in Western Greenland ... 20
Changes of soil organic matter stocks in Bavaria... 21
Soil organic carbon mapping at different scales in Madagascar ... 22
Session 4 Digital Soil Mapping ... 23
Predictive mapping of soil properties at high resolution by component wise gradient boosting from legacy data ... 24
Mapping of soil moisture by deep learning based Cellular Automata ... 25
Optimization of sampling configuration for digital soil mapping in a historical wine region, Hungary ... 26
Identifying soil variability using multi-year remote sensing for site-specific management ... 27
An improved fuzzy logic slope-form system for predictive soil mapping of a landscape-scale area with strong relief conditions ... 28
Hierarchical approach of incorporating legacy information into the digital soil mapping process to provide soil property information at a scale where people make decisions ... 29
Knowledge discovery from samples using the partial dependence of random forest under fuzzy logic ... 30
Keynote: Flood-risk screening using detailed and massive terrain data ... 32
Session 5 Digital Soil Mapping of large areas ... 33
Mapping chemical and physical properties of soils at regional scale on the Swiss Plateau by robust external drift kriging from legacy soil data ... 34
The new digital soil map of Sweden –method and applications ... 35
Automated soil mapping based on Machine Learning: towards a soil data revolution ... 36
Using Remote Sensing and Ancillary Data Mapping Heavy Metals in Qatar Soils ... 38
Comparison of a soil texture map synthetized from GlobalSoilMap standard layers with a goal specifically compiled product ... 39
DOSoReMI.hu; results of a project for functional, DSM based renewal of Hungary's national soil spatial data infrastructure ... 40
Session 6 Digital Soil Mapping of large areas ... 41
Designing soil monitoring schemes for large areas based on digital soil mapping products ... 42
Legacy soil survey data mining for digital soil mapping in Prince Edward Island (PEI) province in Canada ... 43
Applications of DSM for erosion modelling with uncertainty propagation ... 44
A Systematic Approach to Building a Sustainable Digital Soil Map ... 45
Managing water by managing soils: The importance of soil information for the sustainable development of Central America ... 46
GlobalSoilMap developments in France ... 47
Session 7 Digital Soil Mapping ... 48
Predicting soil depth using survival analysis models ... 49
An error budget for digital soil mapping using proximally sensed EM induction and remotely sensed γ-ray spectrometer data ... 50
Can citizen science be used to assist Digital Soil Mapping? ... 51
Adaptation of public digital soil maps for practical use in agriculture ... 52
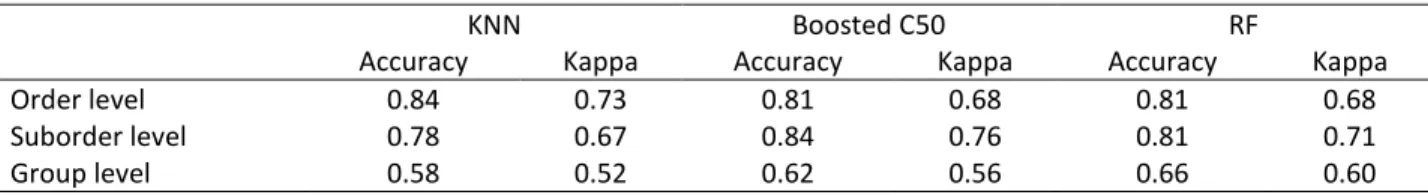
Ensemble of topsoil texture predictions for Region Centre (France) ... 53
Mapping of skidding track soil compaction and displacement from high resolution LIDAR-based DEM’s in broadleaved forest on poorly drained soils ... 54
Scope to map soil management units at the district level from remotely sensed γ-ray spectrometry and proximal sensed EM induction data ... 55 Digital land resource mapping to address information and capacity shortages in developing countries . 56
Session 8 Digital Soil Mapping ... 57
Combining uncertainties from the feature domain and spatial domain for digital soil mapping: where to sample more? ... 58
Digital soil mapping using data with different accuracy levels ... 59
Accurate digital mapping of endemic soils ... 60
Potential to map depth-specific soil organic matter content across an olive grove using quasi-2d and quasi-3d inversion of DUALEM-21 data ... 62
Digital Soil Assessment of Landscape-Scale Forest Restoration Using a Species Distribution Model ... 63
Mapping sustaining soils in prehispanic Western Mexico. Archaeopedology as a tool for understanding ancient agriculture ... 64
Mapping of Functional Soil Classes across Scales ... 65
Keynote: Recent Advances in the Image Spectroscopy for Geo Spatial Information of Soils ... 66
Session 9 Remote Sensing and Soil Spectroscopy ... 67
Geographically closest resampling strategy for soil organic carbon and clay content prediction ... 68
Identification of soil classes based on vis-NIR reflectance spectra using depth harmonization and machine learning techniques ... 69
How reflectance spectroscopy can assist in soil classification?... 70
Using field spectroscopy in the VNIR-SWIR spectral region for predicting hydrophobicity level of undisturbed soils ... 71
Multi-temporal composites of airborne imaging spectroscopy data for the use in digital soil mapping .. 72
Seasonal Changes of Tilled Soil Surface as Information Factor for Efficient Soil Mapping Using Remote Sensing Data ... 73
Mapping of land covers in South Greenland using very high resolution satellite imagery for SOC upscaling ... 74
Session 10 Digital Soil Class Mapping ... 75
Mapping Drainage Classes in Denmark by Means of Decision Tree Classification ... 76
Using regionalization maps in Digital Soil Mapping ... 77
Multinomial Logistic Regression with soil diagnostic features and land surface parameters for soil mapping of Latium (Central Italy) ... 78
Exploring effects of sampling approaches and quantities of training samples on updating conventional soil maps performance ... 79
Session 11 Digital Soil Mapping and Environmental Covariate ... 81
Artificial Neural Networks for soil drainage class mapping in Denmark ... 82
Selection of principal stand factors as predictors for digital mapping of potentially toxic element
contents in forest soils ... 84 Acid sulfate soil mapping in Denmark using legacy data and LiDAR-based derivatives ... 85 Predicting Soil Processes: Digital Soil Mapping as a platform for bridging scale discrepancies between measurements and predictions ... 86
Session 12 Digital Soil Mapping ... 87
Providing spatial SOC estimates for complex and remote soil-landscapes of scarce data availability and structure ... 88 Classification and mapping of soil pH depth function groups for Denmark ... 89 Object-oriented digital soil mapping for the support of Delineation of Areas with Natural Constraints in Hungary ... 90 A new pH depth function for agricultural soils ... 91
6
Chair:
Senior scientist Mogens H. Greve
Members:
Post doc Maria Knadel Post doc Yi Peng
Academic employee Mette Balslev Greve Secretary Karina Rysholt Christensen Secretary Jytte Christensen
Scientific Committee
Responsible:
Mogens H. Greve, Department of Agroecology, Aarhus University, Denmark
Luboš Borůvka, Department of Soil Science and Soil Protection, Faculty of Agrobiology, Food and Natural
Resources, Czech University of Life Sciences Prague
Members of the scientific committee:
Alex McBratney, Soil Science, The University of Sydney, Australia
Allan Lilly, Environmental and Biochemical Sciences, The James Hutton Institute, Aberdeen, Scotland A-Xing Zhu, Department of Geography, University of Wisconsin, Madison, USA
Budiman Minasny, Department of Environmental Sciences, The University of Sydney, Australia
Cristiano Ballabio, Land Resource Management - Soil Action, Joint Research Centre, European Soil Data
Centre (ESDAC)
David G. Rossiter, Department of Crop and Soil Sciences, Cornell University, Ithaca, New York, USA Ganlin Zhang, Soil Ressource and Remote Sensing Applications, Institute of Soil Science, Chinese Academy
of Sciences, Nanjing, China
Kabindra Adhikari, Department of Soil Science, University of Wisconcin, Madison, USA Maria Knadel, Department of Agroecology, Aarhus University, Denmark
S. Young Hong, National Academy of Agricultural Sciences, Rural Development Administration, Suwon,
Gyeonggi-Do, Republic of Korea
Keynote: Climate modeling: the role of subsurface information in
predicting climate change
Jens Hesselbjerg Christensen
Danish Meteorological Institute, Denmark
Climate models are comprehensive computer codes or system models with compartments of all
relevant components of the climate system, handling atmospheric, oceanic and cryospheric processes as well as a complete description of the energy, moisture, carbon and other component fluxes. To this end interactions between the atmosphere and land surfaces are crucial and processes happening at a fine geographical scale may be essential to get right in order to provide credible information about the state of the system. In this talk, aspects of model resolution and the need for detailed soil information in a climate modeling context will be discussed and some examples of crucial model biases related to soil types and soil processes will be touched upon.
Session 1 Soil Spectroscopy
Chair: Yi Peng
Optimizing Model Development and Validation Procedures of Partial
Least Squares for Spectral Based Prediction of Soil Properties
Nimrod Carmon
1, 2and Eyal Ben Dor
21Porter School for Environmental Studies, Tel-Aviv University, Tel-Aviv, Israel
2Department of Geography and Human Environment, Tel-Aviv University, Tel-Aviv, Israel
The benefits of rapid and easy assessment of soil's attributes by means of reflectance spectroscopy at both the VIS-NIR-SWIR and TIR regions have been extensively reported by many workers. The most common method to extract a spectral based model is by using a Partial-Least-Squares Regression (PLS-R) algorithm. Whereas this method is highly affected by the spectral and chemical preprocessing technique and by the pre selection of the calibration and validation samples in the analysis, its robustness has not been fully examined. In this study we close the gaps previously reported within the PLS-R modeling approach and report on an automated way to extract an optimal model from the PLS-R approach. This innovative tool was developed at TAU and termed PARACUDA®. Within PARACUDA®, the All Possibility Approach (APA) is applied, in which preprocessing algorithms are applied on the spectral data in all possible combinations before additional analytical modeling approaches are applied.
In general, the new system optimizes the extraction of a reliable model and reduces specific effects caused by different modeling methods. For this purpose, we have developed a semi-supervised sequential preprocessing module for spectral data and a normalization module for the modeled attribute. These unique transformation modules emphasize important features in the data, improving calibration capabilities. Furthermore, we have developed a novel approach for conducting iterative inner validation procedures for evaluating the performance of a population of models rather than reporting a single model’s result. The validation module is based on a Latin Hypercube Sampling (LHs) algorithm for sophisticated and representative data grouping which eliminates the effects of sample variation between the groups. By performing multiple validation iterations and reporting each iteration’s results, a fuller picture of the modeling potential is discovered and reported. As spectral assignment is a key issue in chemometrics, our system produces unique spectral assignment data for each modeled attribute, showing band dependencies across the spectrum. This system was tested on a well-known legacy spectral library of Israeli soils with 52 chemical and physical attributes measured for 91 soil samples. The results were extremely accurate and showed an average improvement of model performance by ~10%. The spectral assignment ability within the PARACUDA® machine provides the extracted model with a high level of confidence.
Memory Based Learning: A New Data Mining Approach to Model and
Interpret Clay Diffuse Reflectance Spectra
Asa Gholizadeh
1, Mohammadmehdi Saberioon
2and Luboš Borůvka
11
Department of Soil Science and Soil Protection, Faculty of Agrobiology, Food and Natural
Resources, Czech University of Life Sciences Prague, Czech Republic
2
Laboratory of Signal and Image Processing, Institute of Complex Systems, South Bohemia
Research Center of Aquaculture and Biodiversity of Hydrocenoses, Faculty of Fisheries and
Protection of Waters, University of South Bohemia in České Budějovice, Nové Hrady, Czech
Republic
Successful estimation of spectrally active clay in soil with Visible and Near-Infrared (VNIR, 400-1200 nm) and Short-Wave-Infrared (SWIR, 1200-2500 nm) spectroscopy depends mostly on the selection of an appropriate data mining algorithm. The aims of this paper were: to compare different data mining algorithms including Partial Least Squares Regression (PLSR), which is the most common technique in soil spectroscopy, Support Vector Machine Regression (SVMR), Boosted Regression Trees (BRT), and Memory Based Learning (MBL) as a very new promising approach for estimating the content of clay,to explore whether these methods show differences regarding their ability to predict clay from VNIR/SWIR data and to evaluate the interpretability of the results. The dataset consisted of 264 samples from large brown coal mining dumpsites in the Czech Republic. Spectral readings were taken in the laboratory with a fibreoptic ASD FieldSpec III Pro FR spectroradiometer. Leave-one-out cross validation was applied to optimize and validate the models. Comparisons were made in terms of the coefficient of determination (R2
cv) and the Root Mean Square Error of Prediction of Cross Validation (RMSEPcv). Predictions of the clay
by MBL outperformed the accuracy of the other algorithms. It produced the largest R2
cv and smallest
RMSEPcv values, followed by SVMR. Actually, the main goal of this work was to develop a suitable MBL
approach for soil spectroscopy, it showed that MBL is a very promising approach to deal with complex clay VNIR/SWIR datasets. A systematic comparison like the one presented here is important as the nature of the target function has a strong influence on the performance of the different algorithms.
Utilization of the Internal Soil Standard (ISS) Method to Optimize
Exchange of Soil Spectral Libraries
Eyal Ben Dor
1, Gila Notesco
1, Agustin Pimstein
1, Cindy Ong
2,
Ian Lau
2, Veronika Kopackova
3, Jose
Dematte
4and Danilo Romero
411
The Remote Sensing Laboratory, Tel Aviv University
2CSIRO Perth, Western Australia
3
Czech Geology Survey, Czech Republic
4
Department of Soil Science, University of Sao Paulo, Brazil
In the last 5 years, extensive effort has been devoted to building, sharing and using soil spectral libraries on national, continental and global scales. It is a well-known fact in the world spectral community that the different protocols used, are based on the user preference and experience. Nevertheless, it seems that a wide range of factors can affect soil reflectance spectra when using different protocols (spectrometers, geometry, replications, sample preparation, external conditions and even user touch), resulting in subtle or strong alterations in wavelength location, peak absorption and spectral shape or albedo intensity. Although in soil, very weak spectral features are monitored for chemometric purposes, these factors have been found to alter the robust use of a selected spectral model for a wide range of spectrometers and users. Establishment of a common protocol that will be agreed upon by all users might reduce this problem, as well as enable better comparison between spectral libraries. Even so, it has been shown that a strict protocol can only reduce error by about 50%, while the other variations remain. In 2013, Pimstein et al. suggested using an internal standard to reduce the other factors' effects, thereby minimizing the spectral variations after using an agreed-upon protocol. The internal standard idea was adopted from the “wet chemistry” discipline where variations between instruments are reduced by using well-known solutions as standards. In 2015 this idea has been further developed by Ben Dor, Ong and Ian who found a location in Southern Australia where white sand dunes provided a sample to be used as an ideal internal standard for soil spectral measurements (entitled: Internal Soil Standard –ISS). Since then, the ISS method has been utilized by several users showing remarkable results. In this presentation we will provide the basic concept of the ISS method and show it performance along several laboratories worldwide. A focus will be given to construct soil spectral libraries from different sources that generate the measurements using different protocols, spectrometer makes, calibration schemes and users touch. The results show that the ISS concept reduces significantly the systematic variations between spectral readings from many sources allowing an optimal spectral data merging. Furthermore, the proxy analyses before and after applying the ISS correction show a significant improvement of the spectral model's accuracy using the ISS method. The final and important conclusion of this presentation is that using the ISS method as a routine stage at any laboratory with any protocol would allow better and accurate sharing, exchanging and utilizing of enlarging numbers of soil spectral libraries worldwide.
Session 2 Digital Soil Mapping of SOC
Chair: Alex McBratney
USDA CarbonScapes — A National Look at Carbon Landscapes and
Meeting Place for the USDA Carbon Inventory and Modeling Community
James A. Thompson
1, Sharon W. Waltman
2, Kurt Donaldson
3, Maneesh Sharma
3, Frank Lafone
3,
Mike Wilson
4, and Skye Wills
51
Division of Plant and Soil Sciences, West Virginia University, Morgantown, WV, USA
2UDSA-NRCS-National Soil Survey Center Geospatial Research Unit, Morgantown, WV, USA
3West Virginia GIS Technical Center, West Virginia University, Morgantown, WV, USA
4USDA-NRCS-Soil Science Division, Lincoln, NE, USA
5
UDSA-NRCS-National Soil Survey Center, Lincoln, NE, USA
Understanding the carbon cycle is one of the most difficult challenges facing scientists studying the global environment. Without an understanding of C sequestration potential across the landscape, it will be difficult to effectively manage our landscapes for future mitigation of atmospheric CO2. Furthermore,
policy actions to enhance C sinks and remove C sources can be prioritized only when their relative magnitudes are known. In response to the need for readily accessible and reliable data on terrestrial C stocks, the US Department of Agriculture (USDA) made a commitment to making USDA carbon-related information available to the public via a single website. A collaborative effort between the West Virginia GIS Technical Center (WVGISTC) and the Natural Resources Conservation Service (NRCS) National Soil Survey Center Geospatial Research Unit (NSSC-GRU) at West Virginia University led to the creation of an online application that allows a diverse set of clients to access data, models, and other tools related to regional and national inventories of C stocks in an understandable way. This web application, known as USDA CarbonScapes (carbonscapes.org), is organized into four major sections: ATLAS, DATA, EXPLORER, and LEARN. ATLAS summarizes reports for specific C pools in the landscape for C stock or C mass by a particular area (county, watershed, and major land resource area) within the conterminous United States. DATA catalogs and links users to USDA terrestrial C data and model resources published on Data.gov and other web sites. EXPLORER provides advanced users more in-depth tools to visualize and analyze C models and associated map layers as well as create maps, share geospatial links, and extract GIS data. LEARN provides useful links to easy to understand explanation of C in the terrestrial biosphere. The goal of USDA CarbonScapes is to provide a useful and easy to navigate web map application to educate and answer questions for stakeholders about USDA inventory, modeling, and mapping of terrestrial biosphere C across the landscape. USDA soil, forest and crop resource inventories are featured along with USDA C sequestration models used for conservation planning.
Coupling high resolution data and national baseline estimates for farm
scale soil carbon auditing
C Hedley
1, P Roudier
1, B Malone
2, B Minansy
2and AB McBratney
2 1Landcare Research, Palmerston North, New Zealand2Centre for Carbon, Water & Food, Faculty of Agriculture and Environment, The University of Sydney, Australia
There has been considerable effort by national governments to develop greenhouse gas inventories that include accounting for soil carbon stocks and stock changes, as a commitment to the reporting requirements of the United Nations Framework Convention on Climate Change (UNFCCC). In parallel, independent verification methods have been developed for soil carbon trading initiatives, and these typically target smaller private land holdings, to audit management strategies implemented to sequester carbon into soils. Here we present a method that disaggregates coarse resolution, national soil carbon maps to fine resolution, farm scale maps. The method takes advantage of high resolution sensor datalayers and the output maps can be used to stratify the farm and guide sampling for the purpose of assessing soil carbon change through time.
The disaggregation method used, named dissever, is a downscaling approach developed by Malone et al. (2012). In this study, it has been applied to national soil carbon models, using high resolution data available locally to disaggregate the national maps to the farm scale. An iterative regression process develops a quantitative relationship between the fine scale covariates and the coarse scale soil organic carbon map. An extension of the original dissever method enables different regression methods to be tested and compared (generalised additive models, linear models, MARS splines, random forests and Cubist). The method also uses bootstrapping on the final dissever model to derive prediction uncertainties.
The national model provides a baseline value for one case study site, a 160 ha pastoral farm in the Manawatu region of New Zealand, of 91.84±22.88 t C ha-1 (to 0.3 m soil depth). Disseveration then uses
the fine gridded environmental covariate data to drive the downscaling procedure on a block by block basis, with mass preservation. The available fine scale covariates used are: digital elevation from airborne laser scanning (< 1m resolution) and derived terrain attributes, gamma-ray spectrometry (10 m resolution), electromagnetic sensor data (10 m resolution), and a legacy (polygon) soil map (1:6,000). There is generally good agreement between the original data and the back transformed disaggregated data, with concordance correlation coefficient (CCC) > 0.8 for all regression methods tested. Performance indicators (CCC, RMSE, R2, bias, SE) show that Cubist outperforms the other models with
CCC of 1.00, RMSE of 0.15, R2 of 1.00, bias of 0.00 and SE of 0.15.
The national model therefore provides a baseline value for any part of the country, and the disaggregation method can be used to guide local sampling through time, which is necessary to account for any management effects on soil organic carbon stocks.
Reference:
Malone, Brendan P, Alex B McBratney, Budiman Minasny, and Ichsani Wheeler. 2012. “A General Method for Downscaling Earth Resource Information.” Computers & Geosciences 41. Elsevier: 119–25.
Global space-time soil carbon assessment
José Padarian
1, Uta Stockman
1, Budiman Minasny
1and Alex B. McBratney
11
Faculty of Agriculture and Environment, The University of Sydney, New South Wales 2006,
Australia
Climate change including change in temperature, elevated CO2 concentrations, increased rainfall
variability, and altered land-use will have a great impact on soils. The influence of these factors will create a dynamic feedback between soil and the environment. Because of the inherently dynamic nature of soil change, addressing these questions requires empirical data over time. While there are efforts to collect soil data round the globe for estimation of soil carbon stocks, the results are still uncertain.
This paper produces a global space-time assessment of soil carbon dynamics in different biomes and ecozones of the world accounting for impacts of environmental factors. We utilised the world’s prior investment in soil data infrastructure gathered over the past half-century and beyond to provide a comprehensive global space-time assessment of soil organic carbon (SOC) dynamics. We first applied the scorpan approach to reveal the effect of soil forming factors on SOC. Following this, we incorporated land cover change dynamics, generating a two-stage model capable of predicting SOC content given a land-use history. We present global SOC maps and meta-statistics by ecozones to illustrate the change in time of this critical soil property.
The outcome can be used for an analysis of the relative effects of climate change and soil management on soil carbon across the globe. These observations will lead to a design of optimised soil carbon change monitoring network.
A million dollar challenge to map peatlands in Indonesia
Budiman Minasny
1, Rudiyanto
2and Budi Indra Seyiawan
21 Faculty of Agriculture and Environment, The University of Sydney, New South Wales 2006, Australia 2 Department of Civil and Environmental Engineering, Bogor Agricultural University, Indonesia
The Indonesian government recently announced a million dollar prize competition to find a
more accurate and faster way of mapping the extent and depth of Indonesia’s peatlands. Never
before, soil mapping can make one become a millionaire. Eager soil mappers around the world
seek collaboration with Indonesian scientists to enter the competition.
This call is in response to last year’s devastating peat fire disaster in Indonesia. Tropical
peatlands provide important ecosystem functions essential for soil security: biomass
production, water supply, carbon storage, and biodiversity conservation. Effort has begun on
restoring degraded peatlands, but one of many obstacles faced by the restoration agency is the
lack of accurate map that made it difficult to identify areas that need to be conserved.
This paper presents digital mapping techniques that can be used to map peat depth in
Indonesia. First we will review some techniques that have been proposed in mapping peat
depth, both in the tropical area and the northern hemisphere. These include Lidar and gamma
radiometrics. We then evaluated the scorpan spatial function approach using field observations
in combination with widely-available covariates. We assessed the efficiency and accuracy of
DSM techniques in a peatland of 600,000 ha in Ogan Komering Ilir, South Sumatra. To begin
with, we defined the mapping extent based on a peat hydrological unit, where a peatland is
bounded by at least two rivers. We used the 30 m DEM from the SRTM as covariates. We
formulated the spatial soil prediction functions using Cubist regression tree, and Quantile
Regression Forests (QRF). The results showed that peat depth can be predicted accurately using
elevation and distance from the nearest river. Both Cubist and QRF performed similarly in
predicting peat depth with a RMSE less than 1m, however the 90% prediction confidence
interval for QRF is wider than that of Cubist. We also calculated the carbon stock for the
peatland using the estimated peat depth and C density measurements. Finally, we evaluated
the use of stratification-based sampling to increase the efficiency of sampling and also covariate
coverage.
Session 3 Digital Soil Mapping of SOC
Chair: Budiman Minasny
3D modelling of Scottish soil properties
Laura Poggio
1and Alessandro Gimona
11The James Hutton Institute, Craigiebuckler, Aberdeen (Scotland, UK)
Soil properties vary in space and time and the prediction of their variation is an important part of environmental modelling as it has to consider and communicate their inherent uncertainty. In this study the continuous vertical and lateral distributions of relevant soil properties in Scottish soils were modelled with a 3D-GAM+GS approach following globalsoilmap.net specifications. The values at each cell for each of the considered depth layers were defined using a hybrid GAM-geostatistical 3D model, combining the fitting of a GAM (Generalised Additive Models) to estimate the trend of the variable, using a 3D smoother with related covariates; and Gaussian simulations of the model residuals as spatial component to account for local details. A dataset of about 26,000 horizons (7,800 profiles) was used for this study. A validation set was randomly selected as 25% of the full dataset. Numerous covariates derived from globally available data, such as Digital Elevation Model and Remote Sensing derived information are considered. The results showed good validation metrics and an accurate reproduction of the spatial structure of the data for a range of soil properties, such as organic carbon, pH, texture and soil depth. The results have an out-of-sample RMSE between 10 to 15% of the observed range when taking into account the whole profile. The results mirror the morphology and the soil patterns with high organic soil on the west and agricultural areas on the east. The approach followed allows the assessment of the uncertainty of both the trend and of the residuals.
Mapping Soil Organic Carbon Stocks Using a General 3D Mapping
Approach in the Northeast Tibetan Plateau, China
Ren-Min Yang
1and Gan-Lin Zhang
11 State Key Laboratory of Soil and Sustainable Agriculture, Institute of Soil Science, Chinese Academy of Sciences, Nanjing 210008, China
In the Tibetan Plateau, alpine grassland is the most widespread ecosystem and plays an important role in the storage of SOC. Therefore, there is a need for accurate estimate of soil organic carbon (SOC) stocks for understanding the role of alpine soils in the global carbon cycle.
The study area is located in the northeast of the Tibetan Plateau (ca. 30000 km2). We tested a method
for mapping digitally the continuous distribution of the SOC stock in three dimensions. First, a step-wise exponential depth function was defined to describe SOC depth distribution, with four parameters. This depth function integrated the spatial distribution of the “mattic epipedon” which is a special surface horizon with intensive roots. Such topsoils rich in organic matter. It usually leads to a sharp decrease in SOC contents with depth. Consequently, a monotonic decreasing function may result in an unrealistic distribution of SOC in the mattic epipedon because of high SOC content in topsoils. Second, a combined model of classification and regression analysis in random forest was applied for mapping parameters of soil depth functions using environmental covariates across the study area. Third, SOC stocks were predicted by using soil depth functions at each location.
The defined soil depth function provided a mean R2 of 0.91 between the observed and fitted SOC
content at calibration sites. Prediction models resulted in high prediction accuracy. The mean RMSE value of independent validation was 0.94 kg m-2. By applying the predicted parameters of soil depth
functions, we mapped the spatial distribution of SOC stocks across the study area. An average SOC stock in the mattic epipedon was estimated to be 4.99 kg m-2 in a mean depth of 14 cm. The average stock for
the 0-30 cm layer was 5.54 kg m-2, that of 6.11 kg m-2 for the 0-50 cm layer and 6.89 kg m-2 for the 0-100
cm layer. The amounts of SOC in the mattic epipedon, the upper 30 cm and 50 cm accounted for about 21 %, 80 % and 89 %, respectively, of the total SOC stock in the upper 1 m depth. By investigating the mattic epipedon, we were able to quantify the role of such an uppermost soil layer in storing SOC. Information on this layer is valuable for mapping the realistic distribution of SOC stocks in the Tibetan grasslands. Compared with previous estimates, our approach resulted in more reliable predictions.
High resolution digital soil organic carbon mapping in Western
Greenland
Philipp Gries
1, Karsten Schmidt
1, Thorsten Behrens
1and Thomas Scholten
1 1 University of Tuebingen,Chair of Soil Science and Geomorphology
Soils are an important carbon sink, which stores up to 2500 Pg carbon worldwide. Thereof, arctic soils contain the major portion of soil organic carbon (SOC). Being a sensible ecosystem, the Arctic is sensitive to climate change. Hence, thawing of permafrost-affected soils to greater depth and for longer periods increases the release of CO2 to the atmosphere, which queries soils as important carbon pool. There are several studies on predicting SOC content of arctic soils focusing on different depths, scales and regions. Most surveys base on soil or landscape units representing averaged point information. Being limited respecting intense natural and spatial variation of soils, these approaches are susceptible to errors of estimation. The spatial heterogeneity of soil properties, especially soil carbon, results from environmental factors varying highly in space and scale. Although, dealing with diversified soil properties, pixel based approaches are less widespread at pedological studies of the Arctic. This study comprises an area-wide prediction approach of SOC at two different study areas in Western Greenland using digital soil mapping (DSM) and data mining (DM). The objectives are (i) identifying major environmental factors controlling spatial variation of SOC in Western Greenland, (ii) creating high-resolution maps of relevant soil properties (iii), and to estimate carbon stocks. Being an ongoing study, intermediate results are presented.
We used two study areas (2 km² each) in Western Greenland (~67° N). The first area is four kilometers east to Sisimiut (Holsteinsborg) close to the seaside. The second area is located 20 kilometers east to Kangerlussuaq (Søndre Strømfjord) at Lake Aajuitsup Tasia close to the Greenland Ice Sheet (GrIS). Onshore oceanic conditions in Sisimiut turn into continental climate at GrIS showing less precipitation, more sunshine hours and increasing permafrost thickness. Input data of the DSM model includes soil data from fieldwork (bulk density, SOC, soil moisture, active layer thickness, vegetation cover). Environmental variables contain a wide range of local, complex and combined terrain attributes as well as remote sensed data (NDVI, soil moisture, surface roughness). Combinations of DSM and DM (random forest, support vector machines, artificial neural networks) are used to identify relationships between environmental variables and soil attributes for modeling high-resolution digital soil maps and calculating carbon stocks.
Intermediate results contain new digital elevation models created by aerial photos and Structure from Motion techniques. They have higher resolution (5x5 m) and are superior in comparison to measured altitudes by GPS (R² = 0.83/0.76, RMSE = 6.23/5.70) compared to existing ones (R² = 0.77/0.62, RMSE = 8.39/10.97). The topography, glacial and periglacial sediments of the study areas are comparable regarding the terrain variables aspect, profile curvature, flow direction, flow path length, Terrain Classification Index for Lowlands and Topographic Position Index. However, at the seaside, slope, plan curvature, flow accumulation, LS-Factor, valley depth, and relative mass balance are more than twice as high as close to GrIS. We divided both study areas into four landscape units using k-means cluster analysis on the terrain attributes listed. We used a random sampling design to select 10 sampling location per unit to calibrate respective DSM models. According to this concept, next steps will be collecting soil samples, laboratory and statistical analysis as well as high-resolution modeling of soil properties, especially SOC, in both study areas in Western Greenland.
Changes of soil organic matter stocks in Bavaria
Anna Kühnel
1, Martin Wiesmeier
1, Peter Spörlein
2, Bernd Schilling
2, Ingrid Kögel-Knabner
1 1Lehrstuhl für Bodenkunde, Department für Ökologie und Ökosystemmanagement,
Wissenschaftszentrum Weihenstephan für Ernährung, Landnutzung und Umwelt, Technische
Universität München, Freising-Weihenstephan, 85350, Germany
2
Bayerisches Landesamt für Umwelt (LfU), Hof, 95030, Germany
Climate change will have profound impacts on organic matter stocks and thus on the functionality of soils. The predicted rising temperatures in Bavaria might lead to an increased decomposition and release of soil carbon into the atmosphere, which would deteriorate a number of important soil functions. Information about the effect of rising temperatures on soils is however scarce.
In order to identify how organic carbon stocks in soils have already changed over the last 30 years, we used soil data from about 150 long term observation sites with constant management practises. The long term observation sites are homogeneously distributed over Bavaria and comprise forest, grassland and agricultural systems. These sites have been established in the middle of the 80’s and have been re-sampled approximately every 10 years.
In about two thirds of the analysed sites soil organic carbon changes could be detected. It is noteworthy, that there are sites with declining and sites with rising carbon stocks. The observed changes in organic carbon stocks will then be related to soil type, landuse, management, topographic and especially climatic data using random forest models. Thus, we can identify potential drivers of the soil organic carbon changes.
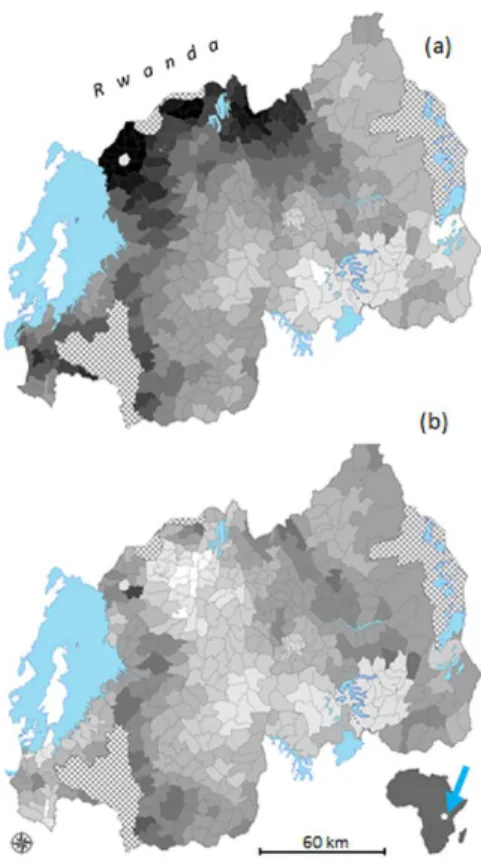
Soil organic carbon mapping at different scales in Madagascar
N. Ramifehiarivo
1, A. Andriamananjara
1, H. Razafimahatratra
2, T. Razafimbelo
1, M. Rabenarivo
1,
A.Rasolohery
3, N. Ranaivoson
1, F. Seyler
4, A. Albrecht
5, F. Razafindrabe
6, M. Brossard
7and H.
Razakamanarivo
11 Laboratoire des RadioIsotopes, University of Antananarivo, Madagascar
2 Ecole Supérieure des Sciences Agronomiques, University of Antananarivo, Madagascar 3 Conservation International, Antananarivo, Madagascar
4 IRD Institut de recherche pour le développement, UMR ESPACE-DEV Montpellier, France 5 IRD Institut de recherche pour le développement, UMR Eco&Sols Montpellier, France 6 Institut Géographique de Madagascar, Antananarivo, Madagascar
7 IRD Institut de recherche pour le développement, UMR Eco&Sols Cayenne, France
The assessment of soil organic carbon is important for carbon sequestration known as the central driver in climate change mitigation and soil fertility. For Madagascar, advanced research on soil carbon mapping at multi-scales is required to improve the accuracy of the existing maps. This study aimed to (i) model the spatial distribution of Soil Organic Carbon (SOC) at local, regional and national scales from the relevant environmental variables, (ii) develop map of SOC at this three scales. For this, spatial models from the Random Forest algorithm were developed by using 13 pedoclimatic, topographic, and vegetation variables at local scale (Commune Rural of Didy, 1416 Km² of area) with 213 soil profiles (0-30 cm depth); at regional scale (Eastern humid ecoregion, 205 858 Km²)) with 800 soil profiles (0-(0-30 cm depth); and national scale (587 000 Km²) with 1996 soil profiles (0-30 cm depth). The results showed that the prediction models at local scale had the best predictive capacity compared to regional and national scales, with a Root Mean Squared Error (RMSE) equal to 15.47 Mg.ha-1 for local scale, 24.55
Mg.ha-1 for regional scale, and 25.81 Mg.ha-1 for national scale. SOC variability could be explained by
precipitation, aboveground biomass and land-use in local scale, and precipitation, altitude, and temperature for regional and national scale. The predicted SOC from fitted models ranged from 60 to 150 Mg.ha-1 at local scale, 60 to 130 Mg.ha-1 at regional scale, and 40 to 150 Mg.ha-1 at the national
scale. This study improves the knowledge on the spatial distribution of SOC, by reducing the uncertainty related to up scaling process in Madagascar.
Session 4 Digital Soil Mapping
Chair: A-Xing Zhu
Predictive mapping of soil properties at high resolution by component
wise gradient boosting from legacy data
Madlene Nussbaum
1, Andreas Papritz
1, Marielle Fraefel
2, Andri Baltensweiler
2, Lorenz
Walthert
2, Armin Keller
3, Urs Grob
3and Sanne Diek
41 Department of Environmental Systems Science, ETH Zurich, Zurich, Switzerland 2 NABO, Agroscope, Zurich, Switzerland
3 Swiss Federal Institute for Forest, Snow and Landscape Research WSL, Birmensdorf, Switzerland 4 Remote Sensing Laboratories RSL, University of Zurich, Zurich, Switzerland
Accurate spatial information on soils is crucial for sustainable usage of the resource soil. Spatial planning, agriculture, forestry or natural hazards management need high resolution maps of potentials for particular soil functions (e. g. water storage, nutrient supply). Soil functions are derived from basic soil properties like soil organic matter, pH or soil texture. For many parts of Switzerland precise maps thereof are missing.
A wide range of statistical approaches (linear and additive models, external-drift kriging, Random Forest) was used for digital soil mapping in the past. If numerous environmental covariates (e. g. hyper-spectral remote sensing data or terrain attributes) are available the selection of the model with best predictive power is challenging. To handle these difficulties we used a gradient boosting approach that included categorical covariates, linear and smooth non-linear terms of continuous covariates. Besides numeric responses gradient boosting can predict binary or ordered categories (e. g. soil classification data) based on logistic or proportional odds models.
To explore the feasibility of the gradient boosting approach we mapped a wide range of basic soil properties for two agricultural study areas and one forested area in Switzerland. We predicted properties for top- and subsoil from legacy soil data on a fine-meshed grid (20 m mesh width). The gradient boosting approach could be applied to numerous responses with ease and successfully selected a small number of relevant covariates (10–30 out of 480).
Model performance – evaluated with independent validation data – depended on soil properties: Topsoil maps for pH, organic matter content or texture were more accurate compared to subsoil maps. For example, the spatial distribution of subsoil organic matter could not be captured due to very low subsoil organic matter content. For other soil properties (e. g. content of fragments > 2 mm) the model performance was independent from depth. Categorical information on waterlogging could be predicted with satisfactory accuracy. We compared the results to predictions derived from legacy soil maps. To account for the uncertainty we computed prediction intervals by a model-based bootstrap approach and validated externally the coverage of these intervals.
Mapping of soil moisture by deep learning based Cellular Automata
Xiao-Dong Song
1, Gan-Lin Zhang
1*, Feng Liu
1, De-Cheng Li
1and Yu-Guo Zhao
11
State Key Laboratory of Soil and Sustainable Agriculture, Institute of Soil Science, Chinese
Academy of Sciences, Nanjing, 210008, China
Soil moisture content (SMC) is a key hydrological parameter in various application domains, and its spatio-temporal patterns are needed to address precise irrigation scheduling. The hybrid interaction of static and dynamic environmental parameters makes it particularly difficult to accurately and reliably model the distribution of SMC. In this research, a novel Macroscopic Cellular Automata (MCA) model was presented by integrating deep belief network (DBN) and applied to a prediction experiment over an irrigated corn field (22 square kilometers in the Zhangye artificial oasis, northwestern China). Recently deep learning has won numerous contests in machine learning and hence DBN, a breakthrough in deep learning, was trained to extract the transition functions for the simulation of the cell state changes. Static and dynamic predictors were prepared with regard to the complex hydrological processes. The widely used neural network, multi-layer perceptron (MLP) was utilized for comparison. The hybrid models were calibrated and validated on SMC data within four months, i.e. June to September 2012, which were automatically observed by a wireless sensor network. Compared with the MLP-MCA, DBN-MCA model led to a reduction in root mean squared error (RMSE) of 18%. Differences arose due to the propagating errors of variables, and difficulties of knowing soil properties and recording irrigation amount in practice. The sequential Gaussian simulation (sGs) was performed to assess the uncertainty of soil moisture patterns. Calculated with a threshold of SMC for each grid cell, local uncertainty of simulated results in the post processing suggested that the probability of SMC less than 25% will be in different areas at different time. Results showed that DBN-MCA model performs better than MLP-MCA and provides a powerful tool for predicting SMC in highly non-linear forms. Moreover, as modelling soil moisture using environmental information is gaining increasing popularity, DBN techniques could contribute to enhancing the calibration of MCA-based SMC models and hence provide an alternative approach for the SMC monitoring for irrigation systems based on canals.
Optimization of sampling configuration for digital soil mapping in a
historical wine region, Hungary
Gábor Szatmári
1, Péter László
1, Katalin Takács
1, György Lukácsy
2, József Szabó
1and László
Pásztor
11 Institute for Soil Science and Agricultural Chemistry, Centre for Agricultural Research, Hungarian Academy of Sciences
2 Corvinus University of Budapest, Faculty of Horticulture, Department of Viticulture
Tokaj is a historical region in Hungary for botritized dessert wine making. Recently the sustainable quality wine production in the region was targeted, which requires detailed soil surveys, digital soil mapping (DSM) procedures and uncertainty assessments using model-based (i.e. geostatistical) approaches. The objective of our work was to plan the sampling strategy considering predefined constraints for digital mapping of primary soil properties.
First of all a preliminary soil survey with a number of 200 observations has been carried out in 2014 to explore the relationship between the soil properties of interest and the auxiliary information (i.e. digital elevation model, geological map and satellite images) and to explore the spatial structures (i.e. variograms). In the second phase, the aim was to establish a sampling design especially for DSM purposes. This one can be considered as an optimization problem, where the spatial simulated annealing (SSA) was applied as an optimization algorithm. The regression kriging error variance (RKV) was used as a pre-quality measure, which requires the structure of the regression models and the variogram of the regression residuals. These were known from the preliminary survey. RKV’s spatial average and RKV’s spatial maximum were applied as optimization criterions, respectively. Along the optimization procedures a lot of constraints had to be considered, such as inaccessible areas for sampling and priority areas (where the mapping accuracy has to be higher). These have yielded a complex optimization problem, where a weighted optimization criterion was developed using the linear combination of RKVs and the weights of the priority areas (i.e. high, medium and low). Along the optimization procedures the sample size was systematically changed to yield a so-called “calibration curve”, which was used to determine the sample size for the desired mapping accuracy. The final sampling configuration was evaluated using various statistical and point pattern analysis tools.
The aim of the recent paper is to present the challenges and the results of the second phase sampling strategy of the Tokaj wine region and the evaluation of the optimized sampling scheme.
Acknowledgement: Tokaj Kereskedőház Ltd. supported the project for the survey of the state of vineyards. Digital soil mapping was partly supported by the Hungarian National Scientific Research Foundation (OTKA, Grant No. K105167).
Identifying soil variability using multi-year remote sensing for
site-specific management
Yash Dang
1and Ram Dalal
21 The University of Queensland, 203 Tor Street, Toowoomba Qld 4350, Australia
2 Department of Science, IT and Innovation, 41 Boggo Road, Dutton Park, Qld 4001, Australia
Soils are highly variable, leading to variation in its potential productivity often over distances of only a few metres. A number of techniques/methodologies have been suggested to identify soil variability at paddock, farm and regional scales. It has been possible to identify sites that clearly manifest specific soil constraints at the site level or at local scale using grid soil sampling; however, this process is time-consuming and expensive. Yield mapping technologies collect high-resolution information, but they require some capital investment and, in our experience, can become an inconvenient distraction for growers at harvest. Multi-year spatial and temporal analysis of remotely sensed data can provide a rapid and accurate assessment of areas that are consistently low-yielding over several years, indicating the presence of at least one unknown soil constraint factor. We used historical mid-season normalized difference vegetation index (NDVI) generated from Landsat imagery at different wheat growth stages. The NDVI obtained at different wheat growth stages was compared to the actual yield map from a 74-ha paddock for wheat grown in 2007 (r2 = 0.40-0.75) and 2010 (r2 = 0.26-0.78). The NDVI at flowering best
predicted the wheat grain yield. The regression function obtained was used to simulate wheat yield for rest of the years over 2000-13. We delineated three potential management classes (PMC) using k-means classification of the interpolated data of apparent electrical conductivity (ECa), yield maps and multi-year
remote sensing data. A minimum of four locations were selected within each PMC for soil sampling in 0-0.10 m then 0.20 m depth intervals to 1.5 m and analyzed for physico-chemical properties. The PMC identified by our analysis were: (i) a low-yielding class, LYC (=1.27 t/ha); (ii) a medium-yielding class, MYC (=1.99 t/ha); and, (iii) a high-yielding class, HYC (=3.36 t/ha). Soil Cl- was significantly higher
(>800 mg/kg) below 0.8 m depth in LYC and MYC compared with HYC. Exchangeable Mg percentage (EMgP) was significantly higher (>25%) in the LYC compared with MYC and HYC at all soil depths. The presence of an excessive EMgP can result in soil dispersion. The NO3-N below 0.6 m depth was
significantly higher in LYC and MYC compared with the HYC. In 2009, replicated strips were established in each PMC and 0 and 23 kg N/ha was applied across the field aligned in the direction of management operations while the rest of the field received 46 kg N/ha. Gypsum @2.5 t/ha was applied in LYC. No significant response to applied N was obtained in LYC; however, significant increases in wheat grain yield were obtained with increasing rates of N application in both MYC and HYC zones. Nitrogen requirement calculated using average wheat yield in different PMC, underlying soil NO3-N and protein goal (11.5%),
showed that LYC of the field (29 ha) had substantial unutilised NO3-N in the soil profile from previous
uniform N applications. The application of 46 kg N/ha results in a net wastage of 2.9 t urea as per farmer’s uniform N management practice. Gypsum significantly increased wheat grain yield in the first and second wheat crop. The cummulative profit with gypsum application over two years was A$103/ha. The simulated yield mapping methodology offers an opportunity to identify within-field spatial variability using satellite imagery as a surrogate measure of biomass. However, the ability to successfully simulate crop yields at farm scale or regional scale requires wider evaluation across different soil types and climatic conditions.
An improved fuzzy logic slope-form system for predictive soil mapping
of a landscape-scale area with strong relief conditions
Bui Le Vinh1 2 3 4, Gerhard Clemens2 3 and Karl Stahr2
1Department of Land Management, Faculty of Land Management, Vietnam National University of Agriculture, Trau Quy, Gia Lam, Hanoi, Vietnam
2Institute of Soil Science and Land Evaluation (310), University of Hohenheim, 70593 Stuttgart, Germany 3The Uplands Program, Vietnamese-German Center, Technical University Hanoi, 1 Dai Co Viet, Hanoi, Vietnam
4International Center for Tropical Agriculture (CIAT), regional office for Asia, Institute of Agricultural Genetics, Km2 Pham Van Dong Street, Tu Liem, Hanoi, Vietnam
This paper applies a fuzzy logic approach as a predictive soil mapping tool for a mountainous region of northwestern Vietnam with no soil information available. This approach uses Soil-Land Inference Model (SoLIM) software to study the relationship between soil and environment to predict spatial occurrences of soils and their quality. Purposive sampling strategy was used to obtain soil data from 110 profiles covering four major slope positions on a hillslope: crest, upper-, middle-, and foot slope. Influencing environmental parameters were identified and described from this sampling approach and are called descriptive knowledge. These parameters are parent material, slope inclincation, slope position, slope aspect, and elevation. A detailed system of 29 fuzzy slopeforms was constructed as another parameter for an assumption that slopeforms at this extreme relief area have certain influence on spatial distribution of soils and differences in soil quality Soil profiles were classified into reference soil groups (RSG) and subsoil unit according to WRB 2006. The occurrence of each of these classified RSGs and units is defined by distinctive combinations of the environmental parameters acquired during the conventional soil survey. The inference engine in SoLIM calculates and assigns a similarity value to a map pixel with based on the prescribed RSGs and subsoil units with values ranges from 0 (zero similarity) to 1.0 (maximum similarity). Similarity maps were produced for these RSGs and subsoil units and hardened to a RSG map and subsoil unit map, respectively. The soil quality map under this mapping approach was constructed in the same way. The validity of these products was checked with 50 field validation points. The RSG and subsoil unit maps showed good accuracy results of 76% and 72%, respectively. The results show that the fuzzy slopeforms in relation to the major slope positions and slope inclination do reveal occurrences of certain RSGs and units. The soil quality map shows a lower match with the validation points. The fuzzy slopeforms in this case do not show a significant correlation with the soil quality classes. Variations of soil quality depend more on slope inclination, slope positions, elevation. Land-use history was confirmed in several studies in the same are to be the major reason for soil fertility decline. However, it could not be quantified due to limitations in time and finance, which was probably the reason of having an average certainty result for the soil quality map.
Hierarchical approach of incorporating legacy information into the
digital soil mapping process to provide soil property information at a
scale where people make decisions
Phillip R. Owens
1, Jenette Ashtekar
1, Minerva Dorantes
1, Mayesse DaSilva
2and Zamir
Libohova
31 Purdue University, Department of Agronomy, 915 W. State Street, West Lafayette IN 47907 2 Center for International Agriculture in the Tropics (CIAT), Cali, Colombia
3 USDA-NRCS-NSSC, Federal Building, Room 152, 100 Centennial Mall North Lincoln, NE 68508-3866
Text Soil maps are basic infrastructure for nations. The variable function of soils controls agriculture production, flooding, landslides, road construction and water storage/recharge to aquifers. These are only a few of the many society-based needs for understanding this natural resource. There is a great need to understand the general function of soils; however, there is a greater need to understand soil function at the scale where people make management decisions. The task of creating maps at a resolution that highlights soil variability at a field scale is difficult using soil point data alone because the required input is rarely available. Fortunately, there is information in legacy maps and other sources that can build upon the accumulated knowledge of past generations of field scientist that provided boundary conditions for predictions. Utilizing maps of surface geomorphology describes the parent material information that can infer the soil texture, pH, base saturation, clay mineralogy and other properties that are necessary to predict. At the scale of a geomorphic surface, the parent material properties control the possibilities of soil properties. Within a scale of a field, topography is the greatest driver of soil variability because of water redistribution over geologic time. Water is the energy that drives the differentiation of similar parent material that results in variations of soil properties. This paper will present the hierarchal process used to map soils by utilizing regional legacy data to constrain the predictions so that finer resolution topographical information can identify the natural patterns that developed based on topographical differences. The patterns can be predicted and data can be tied to patterns to make soil property predictions. This paper will present examples from the USA, El Salvador and Kenya where this process is being utilized to map at the resolution of the digital elevation model. The process is being adopted by governments and industry to make decisions regarding the function of soil.
Knowledge discovery from samples using the partial dependence of
random forest under fuzzy logic
Canying Zeng
1, A-Xing Zhu
1, 2, 3and Lin Yang
21
Key Laboratory of Virtual Geographic Environment, Ministry of Education, Nanjing Normal
University, 1 Wenyuan Road, Nanjing, Jiangsu 210023, China
2
State Key Lab of Resources and Environmental Information System, Institute of Geographic
Sciences and Natural Resources Research, Chinese Academy of Sciences, Beijing, 100101, China
3Department of Geography, University of Wisconsin-Madison, Madison, USA
The knowledge of relationships between soil and its environmental factors is very important for soil mapping. Numerous methods have been developed to discover soil-environment knowledge, such as, decision tree, artificial neural network, SoLIM (Soil Landscape Inference Model), and etc. In those methods, using fuzzy memberships to express the soil-landscape knowledge have several advantages: 1) it can better reflect the space gradient information and continuously of soil since fuzzy membership describes how similarity between a local soil and the typical case of the given soil type will change as environmental conditions change; 2) it is beneficial to accumulation and transplant knowledge. The fuzzy membership function is mainly constructed from experts, existing soil maps. However, most areas do not have soil experts or soil map, and the accuracy of knowledge extracted from soil map highly depends on the quality of the using map. In general, soil samples also imply the knowledge of relationships between soil types and their underlying environmental conditions. The excisting knowledge discovery method from soil samples requires the representative field points making its application restricted (Yang et al., 2013).
In this paper, we presented a method to construct fuzzy membership function from partial dependence of environmental variables generated using random forest (RF) based on soil samples. Partial dependence is the dependence of a variable on the class probability (when used for random forest classification) or response (when random forest used for regression) (Friedman, 2001). When applying RF on soil classification, one can obtain partial dependence curves for all variables for each soil classes. Partial dependence functions (curves) can measure the dependence of a certain soil type on an environment variable. The stronger the partial dependence of a value of some variable is, the higher probability of the soil existing in this value of the variable. Therefore, the partial dependence curve contains the knowledge of relationships between soil type and environmental conditions. The fuzzy membership deverived from partial dependences were finally used for soil type inference under the SoLIM framework to predict soil types in Heshan study area. In order to test how the training samples, especially the representativeness (typicality) of the training samples, impact the extracted knowledge and the predicted mapping results, two types of training samples were set. Case 1: the first type of training samples were all the representative samples. To compare with the previous study (Yang et al., 2013), which constructed fuzzy membership functions using descriptive knowledge generated from the representative samples in the same study area, we used the same training samples (Thirty three
representative soil samples) and the same fifty validation samples including regular sampling, subjective sampling, and transect sampling (Yang et al., 2013). Case 2: the second type of training samples was generated by splitting the total sample set randomly without assessment of the representativeness of the samples. This is because it is hard to know the representativeness of soil samples in most cases. In this study, we randomly split the 83 sample in to a training dataset and a validation dataset using the proportion of 2:1 (55 samples for training and 28 samples for validation). And to avoid the randomness of the splitting result, the split was conducted six times, so that six groups of different training and validation data sets were generated for this study area. Random forest was also adopted to compare with the knowledge based soil mapping method.
Results showed that the accuracy of predicted map using the knowledge derived from partial dependence based on representative samples were much higher than using random forest (78% vs 60%). The main reason is that the random forest method needs the full coverage in environmental conditions of the soil sample. But the representative samples only can represent the typical environmental conditions for each soil type. The soil type predictions in one pixel using random forest only have two alternatives within a certain environmental conditions: either yes or no. Thus when the samples are typical, it is difficult for random forest to capture the gradient information. However, the knowledge extracted from partial dependence in random forest is not only can capture the typical environmental conditions but also can express the graduation information. Therefore, it is more suitable by using the knowledge discovery method to predict soil type than random forest when the samples are typical. In addition, compared with the accuracy, 78% of case 1 in our study is slightly higher than the highest accuracy of Yang et al. (2013) with value of 76%. The results of case 2 showed that training samples impact the mapping accuracies greatly. In overall, the knowledge-based method generated more stable mapping accuracy results (ranges from 68% to 75% for group 1-5) than random forest(ranges from 58% to 82% for group 1-5) when training samples changed. If the accuracy of random forest was too low, such as group 6 with accruacy of 50%, the knowledge derived from the partial dependence will have derivation. In such condition, it is difficult to further improve the results.
It can be concluded that the knowledge discover method proposed in our study is more suitable than random forest when using the representative soil samples. The random forest could produce very high accuracy if the training samples covered most of the feature spaces which including the typical samples and the transitional samples. Otherwise, the knowledge discovery method based on the partial dependence can be an alternative method to improve it.
References
Friedman, J., 2001. Greedy function approximation: the gradient boosting machine. Ann. of Stat.
Yang, L., Zhu, A.X., Qi, F., Qin, C.Z., Li, B., Pei, T., 2013. An integrative hierarchical stepwise sampling strategy for spatial sampling and its application in digital soil mapping. International Journal of
Keynote: Flood-risk screening using detailed and massive terrain data
Lars Arge
Center for Massive Data Algorithmics, Department of Computer Science, Aarhus University
Improvements of mapping technologies such as LiDAR have resulted in a major increase in both the amount and quality of terrain data being acquired. Detailed terrain data is useful in a number of applications, such as for example when modelling how water flow on the terrain surface in order to estimate areas that are in risk of flooding during extreme rain events. However, the size of the data has also reveal scalability problems with existing terrain processing applications. Often these problems are a result of the underlying algorithms not taking the hierarchical structure of memory systems into account - especially the large difference in the access time of main memory and disk. In this presentation, we will discuss these problems further and describe how development and use of algorithms that minimize the number of accesses to disk, so-called I/O-efficient algorithms, has led to large practical runtime improvements in many flood-risk screening applications. The presentation will also include a demonstration of an online flood risk analysis tool based on these algorithms.