HAL Id: hal-01902715
https://hal.univ-brest.fr/hal-01902715
Submitted on 12 Apr 2021
HAL is a multi-disciplinary open access
archive for the deposit and dissemination of
sci-entific research documents, whether they are
pub-lished or not. The documents may come from
teaching and research institutions in France or
abroad, or from public or private research centers.
L’archive ouverte pluridisciplinaire HAL, est
destinée au dépôt et à la diffusion de documents
scientifiques de niveau recherche, publiés ou non,
émanant des établissements d’enseignement et de
recherche français ou étrangers, des laboratoires
publics ou privés.
Distributed under a Creative Commons Attribution| 4.0 International License
occurrence of blue and fin whales in the Southern Indian
Ocean
Emmanuelle C Leroy, Flore Samaran, Kate M Stafford, Julien Bonnel,
Jean-Yves Royer
To cite this version:
Emmanuelle C Leroy, Flore Samaran, Kate M Stafford, Julien Bonnel, Jean-Yves Royer.
Broad-scale study of the seasonal and geographic occurrence of blue and fin whales in the Southern
In-dian Ocean. Endangered Species Research, Oldendorf/Luhe : Inter-Research, 2018, 37, pp.289-300.
�10.3354/esr00927�. �hal-01902715�
INTRODUCTION
The Indian Ocean is inhabited by several species and subspecies of large whale, including the Ant -arctic blue whale Balaenoptera musculus intermedia, the pygmy blue whale B. m. brevicauda and B. m.
indica, and the fin whale B. physalus (Stafford et al.
2004, 2011, Samaran et al. 2010a, 2013, Balcazar et al. 2015, Tripovich et al. 2015, Tsang-Hin-Sun et al.
2015). During the 20th century, populations of both blue and fin whales in the Southern Ocean were severely decimated by commercial and illegal whal-ing, particularly in the Indian Ocean (Branch et al. 2004). As a response, in 1979, the International Whal-ing Commission established the Indian Ocean Sanc-tuary to protect them from further exploitation (IWC 1980). North of the Equator, this sanctuary comprises the waters from the coast of Africa to 100° E and
© The authors 2018. Open Access under Creative Commons by Attribution Licence. Use, distribution and reproduction are un -restricted. Authors and original publication must be credited. Publisher: Inter-Research · www.int-res.com
*Corresponding author: emmanuelle.leroy@unsw.edu.au
Broad-scale study of the seasonal and
geographic occurrence of blue and fin whales
in the Southern Indian Ocean
Emmanuelle C. Leroy
1,*, Flore Samaran
2, Kathleen M. Stafford
2, 3, Julien Bonnel
4,
Jean-Yves Royer
11CNRS Laboratoire Geosciences Océan, University of Brest – IUEM, 29280 Plouzané, France 2UMR CNRS 6285 Lab-STICC, ENSTA Bretagne, 29806 Brest, France
3Applied Physics Laboratory, University of Washington, Seattle, WA 98105, USA 4Woods Hole Oceanographic Institution, Woods Hole, MA 02543 USA
ABSTRACT: The southern Indian Ocean is believed to be a natural territory for blue and fin whales. However, decades after commercial and illegal whaling decimated these populations, little is known about their current status, seasonal habitat or movements. Recent passive acoustic studies have described the presence of 4 acoustic populations of blue whales (Antarctic and 3 ‘pygmy’ types), but are generally limited temporally and geographically. Here, we examine up to 7 yr of continuous acoustic recordings (2010−2016) from a hydrophone network of 6 widely spaced sites in the southern Indian Ocean, looking for the presence of Antarctic and pygmy blue and fin whales. Power spectral density analyses of characteristic and distinct frequency bands of these species show seasonal and geographic differences among the different populations, and the over-all patterns for each display interannual consistencies in timing and occurrence. Antarctic blue and fin whales are recorded across the hydrophone network, mainly from austral autumn to spring, with peak intensity in winter. Pygmy blue whales show spatial variation: Madagascan pygmy blue whales are mainly present in the west of the network, while the Australian call type is heard at the eastern sites. Both populations share a common seasonality, with a presence from January to June. Finally, the Sri Lankan call type is recorded only on a single site in the northeast. These results confirm the importance of the southern Indian Ocean for several populations of endangered large whales and present the first long-term assessment of fin whales in the southern Indian Ocean.
KEY WORDS: Pygmy blue whales · Antarctic blue whales · Fin whales · Southern Indian Ocean · Passive acoustic monitoring · Sympatry
O
PEN
PEN
includes the Red and Arabian Seas and the Gulf of Oman; south of the Equator, it extends from 20° E to 130° E and down to 55° S (IWC 1980, see also Fig. 1 in Stafford et al. 2011). The post-whaling and present status of these populations remains poorly under-stood with no recent abundance estimates for the Indian Ocean (Branch et al. 2007), and most current knowledge of their distribution coming from passive acoustic monitoring (PAM) studies (e.g. Stafford et al. 2004, 2011, Samaran et al. 2013, Tripovich et al. 2015). According to a recent study on genetic differ-entiation of blue whale subspecies, those sampled in the Indian Ocean were distinct from Antarctic and Pacific blue whales, but no within-Indian Ocean divi-sions were evident, possibly due to small sample sizes (Leduc et al. 2017). Further, genetic diversity within the Indian Ocean was relatively low (Attard et al. 2016, Barlow et al. 2018). As a conservative meas-ure, the International Union for Conservation of Nature Red List classifies the Antarctic blue whales as ‘Critically Endangered’, fin whales as ‘Endan-gered’, and pygmy blue whales as ‘Data Deficient’ (Cooke 2018). The unknown status of the pygmy blue whale is largely due to its late identification in 1961 as a distinct species from Antarctic blue whales (Ichi-hara 1966). Therefore, the impact of whaling on this species is not known (Clapham et al. 1999), although Branch et al. (2007) concluded that whaling likely caused a decrease in the number of pygmy blue whales. The occurrence of acoustically distinct popu-lations of pygmy blue whales in the Indian Ocean further complicates their observation (Staf ford et al. 2011, Samaran et al. 2013).
Monitoring whale populations over large geogra -phic and temporal scales is a challenge, especially in the southern Indian Ocean. Visual observations re -quire dedicated ship time and are restricted to peri-ods of daylight, good weather, and accessibility, all of which can be difficult to meet in temperate waters, but even more so in extreme environments such as the Southern Ocean, particularly in the remote Indian sector.
Over the past 15 years, PAM has proved to be an efficient and relatively low-cost method to monitor baleen whales year-round by recording their vocal activity (Mellinger et al. 2007), and has greatly improved our understanding of the distribution of vocally active large baleen whales. Both blue and fin whales produce sounds year-round, although fin whales tend to be more vocally active from fall to spring (e.g. Stafford et al. 2001, Širovic´ et al. 2009, Nieukirk et al. 2012, Thomisch et al. 2016). PAM takes advantage of the active vocal behavior of
large whales, which produce easily recognizable and low-frequency calls that can be heard over tens or hundreds of kilometers (Mellinger et al. 2007, Širovic´ et al. 2007, Samaran et al. 2010b). Further-more, these species produce sounds in long, stereo-typed patterns (song) during many months of the year. In the Indian and Southern Oceans, distinct vocal signatures have been documented for at least 5 species or subspecies: fin whales, Antarctic blue whales, and 3 acoustic populations of pygmy blue whales (known as the Madagascan, Australian (or eastern Indian Ocean) and Sri Lankan types) (Stafford et al. 2004, 2011, Sa maran et al. 2010a, 2013, Tsang-Hin-Sun et al. 2015).
While all blue whales share the common traits of producing very long, low-frequency signals that are frequency and/or amplitude modulated, the units that make up these songs differ by region in overall duration, frequency content, and number of compo-nents. Because these differences are stable over many decades, the acoustic signatures of blue whales have been used to designate ‘acoustic popu-lations’ (e.g. Stafford et al. 2001, 2011, Mellinger & Clark 2003, McDonald et al. 2006, Buchan et al. 2014). At present, only 4 subspecies of blue whale are recognized worldwide (Rice 1998), while at least 12 geographically distinct acoustic signatures have been identified. Acoustic studies revealed the importance of the Indian Ocean for Antarctic and pygmy blue whales as a migrating, wintering, and likely feeding area (Stafford et al. 2004, 2011, Samaran et al. 2010a, 2013, Tsang-Hin-Sun et al. 2015). However, most of these studies were limited to 1 or 2 yr of observation. Moreover, at present, there are no post-whaling data on the distribution of fin whales in the area, although there is acoustic evidence of their presence (Tsang-Hin-Sun et al. 2015).
Since the end of 2009, a network of hydrophones has been deployed in the southern Indian Ocean to continuously monitor the low-frequency sounds pro-duced by the seismic and biological activity (Royer 2009, TsangHinSun et al. 2016). This acoustic ob -servatory, called OHASISBIO (Observatoire Hydro Acoustique de la SISmicité et de la BIOdiversité), now comprises 7 yr of acoustic records at 6 sites span-ning an area of 9 000 000 km2. The analysis of this dataset shed light on the seasonal and geographic distribution of Antarctic blue whales in the southern Indian Ocean from 2010 to 2016 (Leroy et al. 2016). In this paper, we extend this analysis to pygmy blue whales and fin whales, based on coarser power spec-tral density (PSD) analyses.
MATERIALS AND METHODS Data acquisition
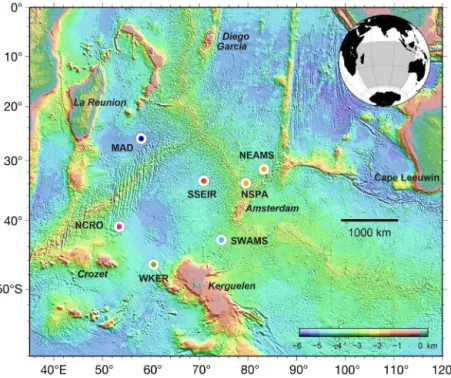
The acoustic data were collected by a hydrophone network in the framework of the OHASISBIO hydro acoustic experiment (Royer 2009). This net-work, initially deployed in December 2009 at 5 sites in the southern Indian Ocean, was designed to mon-itor low-frequency sounds produced by seismic and volcanic events (Royer et al. 2015, Tsang-Hin-Sun et al. 2016), and by large baleen whales. Instruments were deployed south of La Reunion Island in the Madagascar Basin (MAD), northeast of the St Paul and Amsterdam plateau (NEAMS), mid-way be tween the Kerguelen and Amsterdam islands (SWAMS), north of Crozet Island (NCRO) and west of Kergue-len Island (WKER) (Fig. 1). In 2014, a new site was
established in the northern Crozet Basin (SSEIR). All moorings were recovered and redeployed annually, except in January 2016 when poor weather conditions pre-vented the recovery of the hydro phones at the WKER and NEAMS sites. Instead, a new mooring was deployed at the WKER site, and a provisional mooring was de -ployed at 35° S, 079° E (NSPA). Each moor-ing consists of an expandable anchor, an acous tic release, and an au tonomous hydro -phone programmed to record acoustic waves continuously at a rate of 240 Hz with a 24-bit resolution and a sensitivity of −163.5 dB re: 1V µPa−1 (see D’Eu et al.
2012 for instrumental details). Hydro -phones are deployed in the axis of the sound fixing and ranging (SOFAR) chan-nel, from 500 to 1300 m below sea surface de pending on the site. Data are retrieved every year during the annual voyages of the R/V ‘Marion Du fresne’ to the French Southern and Antarctic Territories. The database comprises nearly continuous acoustic data over 7 yr (2010− 2016), bar-ring a few months or years depending on the site, due to battery failures or instrument losses (see Leroy et al. 2016 for more details). Data recorded at the NCRO site in 2010 and 2013 were excluded from the analyses since those records were hindered by high noise levels likely due to the strumming of the mooring line. Deployment periods are summa-rized in Fig. 2 and listed in Table S1 in the Supple-ment at www. int-res. com/ articles/ suppl/ n037 p289 _ supp. pdf.
PSD analysis
As noted above, baleen whales emit stereotyped calls, patterned in sequences with regular inter-call intervals (i.e. song). These acoustic signatures are readily distinguishable among the different acoustic
Fig. 1. Hydrophone locations of the OHASISBIO network in the Indian Ocean (circles). Color scale indicates depth. See ‘Data acquisition’ for
a description of the sites
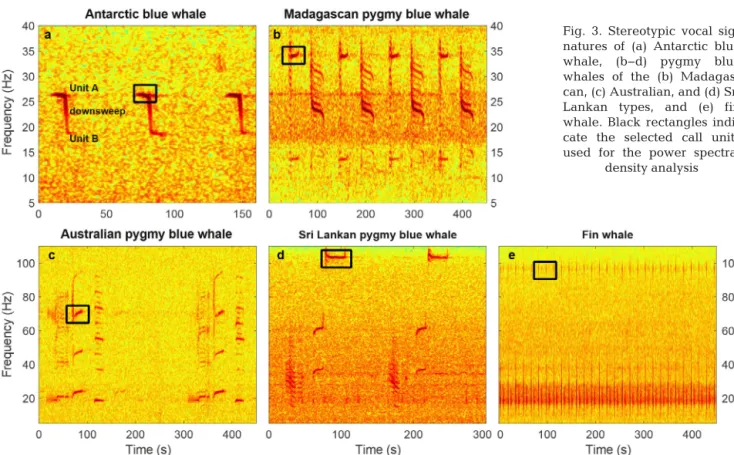
populations, based on their time-frequency charac-teristics. The signals of Antarctic and Indian Ocean blue whales (Fig. 3) are now well described in the literature (Alling et al. 1991, Ljungblad et al. 1998, Stafford et al. 2004, 2011, Rankin et al. 2005, Sama-ran et al. 2010a, 2013).
Worldwide, fin whales emit short duration, broadband pulses (<1 s) often called ‘20 Hz pulses’ (Wat -kins et al. 1987), ranging from ~15 to 30 Hz; in the Southern Hemisphere, they simultaneously produce an upper note near 89−99 Hz (Širovic´ et al. 2009, Gedamke & Robinson 2010, Fig. 3e). The upper note produced by Antarctic fin whales varies geographi-cally; this pulse occurs at 89 Hz off west Antarctica and at 99 Hz off east Antarctica (Širovic´ et al. 2009). Long-term spectral averages of our data show that, in the southern Indian Ocean, fin whales also produce a pulse at ~99 Hz.
One way to assess the broad-scale presence of vocalizing whales is to compare the acoustic power in the frequency bands of their vocalizations to the acoustic power in adjacent frequency bands (Ge -damke et al. 2007, Širovic´ et al. 2009). This method, known as PSD analysis, is commonly used to deter-mine the seasonal presence of blue and fin whales in large acoustic datasets (Curtis et al. 1999, Širovic´ et al. 2004, 2009, Gavrilov et al. 2012, Nieukirk et al. 2012, Leroy et al. 2016, Thomisch et al. 2016, Menze et al. 2017).
To assess this ratio, hereinafter called the ‘chorus-to-noise ratio’ (CNR), we first selected specific units of each vocal signature, either because they occurred consistently and loudly, or for their distinctiveness from the other species units (units outlined by black rectangles in Fig. 3a−e). For the pygmy blue whales, we selected the 35 Hz unit of the Madagascan-type call (Fig. 3b), the 70 Hz harmonic of the Australian-type call (Fig. 3c), and the 105 Hz unit of the Sri Lankan-type call (Fig. 3d). Finally, to avoid the overlap between the fin whale 20 Hz pulse and the Antarctic blue whale Z-call, we used the 99 Hz com-ponent of the fin whale vocal signature (Fig. 3e). To consistently study all the blue whale subspecies re -corded by the OHASISBIO array with the same PSD metric, we applied the same weekly PSD analyses to Antarctic blue whale calls, based on the unit A of a Z-call, near 26 Hz (Fig. 3a). Note that the selected fre-quency band for analyzing the presence of Antarctic blue whale calls is extremely narrow and focuses on Z-call unit A, hence avoiding any energy from other calls in the 18−28 Hz frequency range (e.g. fin whale 20 Hz pulses, Madagascar pygmy blue whale 25 Hz unit). In a previous analysis (Leroy et al. 2016), the ge-ographic and seasonal distribution of Antarctic blue whales was inferred from individual calls, automati-cally detected using a subspace projection algorithm (Socheleau et al. 2015). Comparing these results pro-vides a way to cross-validate the 2 approaches.
Fig. 3. Stereotypic vocal sig-natures of (a) Antarctic blue whale, (b−d) pygmy blue whales of the (b) Madagas-can, (c) Australian, and (d) Sri Lankan types, and (e) fin whale. Black rectangles indi-cate the selected call units used for the power spectral
The PSD for each acoustic file (~6 h 28) was com-puted using the P-welch Matlab function, over 300 s windows, with 50% overlap and a frequency resolution of 0.0018 Hz. The averaged power (in dB Hz−1 re:
1 µPa) was then calculated (1) in the frequency range that encompassed each unit selected to characterize the vocal signature of each species or subspecies (Fig. 4, Table 1), and (2) in adjacent frequency bands of noise above and below these units (upper and lower noise windows in Table 1). Finally, following Širovic´ et al. (2009), the average power density of the lower and upper noise windows was subtracted from the power of the selected unit frequency band. Note that for the Antarctic blue whale and the Sri Lankan pygmy blue whale, we only used an upper noise window since a
lower noise window would have fallen into the fre-quency range of fin whale calls; a lower noise band relative to Antarctic blue whale Z-calls would overlap with fin whale 20 Hz pulses and that relative to the se-lected Sri Lankan frequency would overlap with the fin whale 99 Hz pulse. In addition, since the PSD rap-idly decreases with frequency, we fitted the power density of the noise level in the 102−106 Hz range to a straight line, and then extrapolated and subtracted it from the call power level between 99 and 102 Hz to es-timate the CNR of the Sri Lankan-type call.
The resulting CNR values for all species were then averaged by week for each call type and each re -cording site. The mean seasonality for each species is estimated by averaging the weekly CNR values over the available years of data. The peak seasonality of the CNR values corresponds to the dates of the upper quartile of the cumulative distribution of CNR ranked by week.
RESULTS Geographic distribution
The vocal signatures of the different species were not recorded uniformly across the study area, reflect-ing differences in the geographic distribution of these acoustic populations across the basin. Antarctic blue whales and fin whales were recorded at all sites (Fig. 5). Madagascan pygmy blue whales were recor -ded at every site except NEAMS, while Australian pygmy blue whales were only recorded at SSEIR, SWAMS, and NEAMS. Lastly, Sri Lankan pygmy blue whales were only recorded at the NEAMS site, but with very low CNR (Fig. 6c). The NEAMS site is mostly dominated by fin and Antarctic blue whale choruses. In contrast, the SWAMS and SSEIR sites show the greatest acoustic diversity, with 3 blue whale call types and fin whales.
Call-unit Lower Upper frequency noise noise band (Hz) window (Hz) window (Hz) Antarctic BW 25.5–26.8 na 30.0–33.0 Madagascan PBW 33.5–34.5 30.0–32 36.0–38.0 Australian PBW 67.1–70 64.0–66.0 71.0–73.0 Sri Lankan PBW 98.9–102.1 na 102.0–106.0 Fin whale 95.2–97.8 91.0–93.0 99.0–101.0 Table 1. Frequency bands of the computed power spectral density for the call units of interest and the bracketing noise bands. BW =
blue whale, PBW = pygmy blue whale, na = not applicable
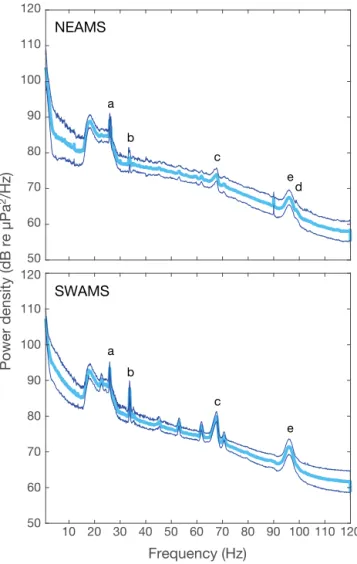
50 60 70 80 90 100 110 120 10 20 30 40 50 60 70 80 90 100 110 120 Frequency (Hz) 50 60 70 80 90 100 110 120
Power density (dB re µPa
2/Hz) SWAMS NEAMS a b c e d a b c e
Fig. 4. Power spectral density of the data for sites NEAMS and SWAMS (see Fig. 1) for April 2015 (mean level and stan-dard deviation). The letters refer to the selected frequencies for the Antarctic blue whale (a), the Madagascan pygmy blue whale (b), the Australian pygmy blue whale (c), the Sri Lankan pygmy blue whale (d) and the fin whale (e) (see
Seasonal distribution
The presence of the studied whale species in the OHASISBIO array is highly seasonal and this seasonality is consistent over the 3 to 7 yr of data analyzed per site (see Fig. S1 in the Supplement). Furthermore, the seasonality of the different call types varies among species and locations (Figs. 5 & 6).
Pygmy blue whales
Madagascan pygmy blue whales. The presence of the pygmy blue whale Madagascan call type is strongly seasonal and occurs almost exclusively from January to June (austral summer to autumn) at the southernmost stations (NCRO, WKER, SWAMS, and SSEIR). The CNR level is low everywhere outside of this 6 mo period. At the northernmost station MAD, its seasonality is shorter, from the end of March to
June (austral autumn), and the peak CNR is delayed by about 2 mo relative to the other sites (Fig. 6a). The peak CNRs for the Madagascan chorus are highly variable among sites (Table 2) and occur as early as mid-January at NCRO and as late as the third week of March at MAD. For all sites but MAD, the CNR rapidly decreases after the end of May. For all sites, however, there is no CNR chorus from July to December (Fig. 6a).
Australian pygmy blue whales. Overall, the Aus-tralian call-type chorus shows a similar seasonality to the Madagascan call type, ex cept that there are much greater geographic differences in the CNR levels. At the 3 easternmost sites of the array, SWAMS in particular, the CNRs are very high (Fig. 6b), whereas at the western sites, MAD, NCRO, and WKER, CNRs are almost null. How-ever, the chorus peak of this call type is very simi-lar among sites: from the first to the third week of February until the first to the third week of May (Table 2).
Fig. 5. Weekly means of chorus-to-noise ratio of each acoustic population for every recording site of the OHASISBIO hy-drophone network. NSPA results are displayed with NEAMS, since this hyhy-drophone was deployed temporarily in 2016 to replace the NEAMS site. Sri Lanka pygmy blue whale calls are only detected at NEAMS and have a very low chorus-to-noise ratio level compared with the other call types; for sake of clarity, their seasonality is only shown in Fig. 6c. Data are given for January, June, and December (DJ: December/January). For location of sites see Fig. 1. BW = blue whale, PBW = pygmy
Sri Lankan pygmy blue whales. This call type is only observed at a single site (NEAMS). Despite a low CNR, a seasonal pattern is distinguishable, with 2 peaks from March to June then in November (Table 2, Fig. 6c).
Antarctic blue whales
Antarctic blue whales are recorded nearly year-round at all sites, from February to November (Fig. 6d). The chorus starts to increase at the 3 southern-most sites in February and roughly a month later at the 3 sites further north (Fig. 6d). The peak CNR for most sites occurs from the middle or end of April to early August. The exception is the MAD site where
the peak CNR occurs mid-May (Table 2). For all sites, however, CNR starts declining steadily after August up to December (Fig. 6d).
Fin whales
The presence of the fin whale chorus is strongly seasonal and occurs from March to November (Fig. 6e). The peak CNR occurs from the end of April to late August (austral autumn and winter, Table 2), except at the northernmost site (MAD) where the peak CNR occurs from the first week of June to the first week of September. The fin whale chorus is first detected in March at all sites, with WKER and NCRO ramping up more sharply from March to April than
Fig. 6. Averaged seasonal patterns of presence for each (sub-)species and population, at every site of the OHASIS-BIO array (each site is color coded as in Figs. 1 & 2). CNR = chorus-to-noise ratio. Horizontal lines: yellow = austral sum-mer; orange = austral autumn; blue = austral winter; green =
the other sites, followed by SSEIR, SWAMS, and NEAMS (Fig. 6e). At all sites, the chorus declines throughout September and October and reaches a minimum from November to February (austral summer).
DISCUSSION
It is increasingly clear from the OHASISBIO data that the southern Indian Ocean is an important habi-tat for large whales. The Indian Ocean has the largest variety of blue whale vocal signatures glob-ally including 3 ‘acoustic populations’ of pygmy blue whales (Stafford et al. 2011). Further, the consistent, seasonal presence of Antarctic blue and fin whales throughout the subantarctic Indian Ocean suggests that these species are widespread at mid-latitudes during much of the year. The present study illustrates the regular geographic and seasonal variation in the occurrence of pygmy blue whales, which supports the use of song as a robust means of defining geo-graphic populations and assessing their habitat.
Low-frequency choruses of these species have been hypothesized to be detectable over hundreds to perhaps thousands of kilometers (Cummings & Thompson 1971, Payne & Webb 1971). The estima-tion of the chorus detecestima-tion range is beyond the scope of this paper. First, it would require a robust estimation of the call source level, and of the detec-tion range of individual calls. For the southern blue whales, these estimates are scarce and based on a very limited number of calls (Širovic´ et al. 2007, Samaran et al. 2010b, Gavrilov et al. 2011). Second, the detection range is likely to vary with the en -vironmental conditions surrounding the instruments, known to change with latitude, longitude, season, and the depth of the hydrophone or of the vocalizing animals (Helble et al. 2013a,b, Širovic´ et al. 2015). Finally, with these parameters known, a proper
esti-mate of the chorus detection range would require modeling the emission of numerous calls by several individuals at various distances and azimuths around a hydrophone. This question would thus call for an entire dedicated study.
Nonetheless, our records suggest that this range could be only in the order of hundreds up to perhaps 1000 km. Indeed, the CNR seasonality of Australian and Madagascan pygmy blue whales is largely dif-ferent at SWAMS, NEAMS, and SSEIR, which are all less than 1000 km apart (e.g. in 2015 or 2016 in Fig. S1). This is even more striking for Sri Lankan pygmy blue whales, whose chorus is recorded only at NEAMS and nowhere else. An exception may be the Antarctic blue whales, whose chorus appears rela-tively identical at every site. However, Leroy et al. (2016) have shown that this chorus at the same geo-graphical sites shows high spatial variability. We thus believe that the CNR is a pertinent proxy to study the presence of vocalizing baleen whales on multi-year and broad-basin scales.
Variation in CNR could also be due to changing propagation conditions, e.g. CNR may increase be -cause of lower noise levels. However, noise level does not follow the CNR pattern (see Tsang-Hin-Sun et al. 2015, Leroy et al. 2016), which rejects this hypothesis. As a result, we do believe that seasonal changes in CNR could be attributed either to calling animals getting seasonally closer to the site, or to more animals calling and contributing to the chorus, or to seasonal changes in their acoustic behavior, or to some combination of these. At present, although we cannot be entirely certain, we do not believe that the changes in CNR are due to changes in acoustic behavior, at least for blue whales. This species ap pears to produce characteristic song phrases through -out the year (e.g. Širovic´ et al. 2004, Stafford et al. 2004, Samaran et al. 2013, Leroy et al. 2016). Without information on the numbers and distributions of call-ing whales around the hydrophone, distcall-inguishcall-ing
Call type MAD SSEIR NEAMS NCRO WKER SWAMS
Madagascan PBW 23 Mar−21 Jun 1 Mar−31 May 22 Feb−24 May 19 Jan−4 May 8 Feb−17 May 16 Feb−18 May Australian PBW 16 Feb−25 May 8 Feb−11 May 28 Feb−8 Jun 23 Feb−25 May 8 Feb−18 May 16 Feb−18 May Sri Lankan PBW na na 22 Mar−21 Jun na na na
and 15 Nov−29 Nov
Antarctic BW 18 May−10 Aug 27 Apr−10 Aug 3 May−3 Aug 20 Apr−24 Aug 20 Apr−10 Aug 27 Apr−10 Aug Fin whale 8 Jun−7 Sep 27 Apr−27 Jul 11 May−7 Aug 27 Apr−24 Aug 27 Apr−27 Jul 27 Apr−17 Aug Table 2. Peak seasonality (date range for the upper quartile of CNR values) for each call type at each location. BW = blue
between the first 2 possibilities is difficult. We do know from Leroy et al. (2016), in which both counts of detected calls and CNR for some of the same data were reported, that the number of individually de -tected calls matches fairly well with the CNR curves. This suggests that, for some sites, increases in CNR are due to animals moving closer to the hydrophones; to be detected automatically, individual calls need to be loud and clear, and therefore relatively close to the hydrophone.
Madagascan pygmy blue whales
The only site where Madagascan pygmy blue whale calls are not recorded is our eastern station (NEAMS), indicating that this population mostly in -habits the western and southern Indian Ocean basin. The Madagascan call type is only recorded during 6 mo (during austral summer to autumn) except at the northernmost station (MAD) where its seasonal presence is shorter (austral autumn only). These geo-graphic and seasonal patterns are consistent with observations from the same area in 2007−2008 (Samaran et al. 2013). A recent study confirms their presence exclusively during autumnal months near our northern site (MAD) (Dréo et al. in press). Simi-larly, in 2004, Madagascan pygmy blue whale calls were detected near Crozet Island from January to June (Samaran 2008, Samaran et al. 2010a), which is consistent with our observations at the NCRO site. Our analysis thus highlights the robustness of sea-sonal occurrence and also extends our understanding of the spatial distribution of this population. The Madagascan pygmy blue whale population is distrib-uted in summer and autumn (January to June) between 26° S (MAD) and 46° S (WKER), 52° E (NCRO) and 74° E (SWAMS). The western Indian Ocean is prob ably not a winter or spring habitat for this population of pygmy blue whales. Where these animals go during these seasons is presently un -known. However, a few instances of this call type were recorded from May to July at Diego Garcia (Stafford et al. 2011) and in the Mozambique Chan-nel, off the northwest coast of Madagascar (S. Cer-chio et al. unpubl.), suggesting a migration to north-ern latitudes at the end of autumn, which may be their wintering area. Visual observations and whal-ing data suggest that blue whales are found off the coast of South Africa (Branch 2007), and recent acoustic observations also report their presence from mid-October to December in the Mozambique Chan-nel, off the northwest coast of Madagascar (S.
Cer-chio et al. unpubl.). Based on this seasonality, we assume that this population is acoustically active dur-ing at least 10 mo of the year. Therefore the ab sence of calls in our study area during austral winter and spring reflects the absence of individuals and not a change in their acoustic behavior.
Australian pygmy blue whales
For the Australian pygmy blue whales, a strong chorus is observed at SWAMS and SSEIR sites, and also at NEAMS but with a lower CNR. As noted by Samaran et al. (2013), their presence is strongly seasonal, with acoustic occurrences in winter and autumn, and no vocal activity from July to January. They also noted relatively fewer calls at NEAMS than at SWAMS. Australian pygmy blue whale calls have also been recorded off the western and south-ern coasts of Australia from February to July in the Perth Canyon, from February to May in the Bass Strait (Balcazar et al. 2015), from March to June off Portland, Australia (Tripovich et al. 2015), and from February to July as well as November to December at Cape Leeuwin (Gavrilov & McCauley 2013). The latter observation suggests that, like the Madagas-can pygmy blue whales, the Australian population is vocally active at least during 8 mo of the year, which supports the idea that the absence of calls in our study area during the austral winter and spring is due to a displacement of the population to another area, and not a change in the whale vocal behavior. Here again, the location of the wintering area is puzzling, although slightly better docu-mented off the West Australian coast thanks to satellite telemetry. Indeed, Double et al. (2014) showed that Australian pygmy blue whales that feed off western and southern Australia travel rela-tively close to the Australian coastline to reach potential breeding grounds in Indonesian waters by June. Their southward migratory route, from Sep-tember to December, remains uncertain due to a lack of satellite data for this period, and lack of call detections between July and the end of October. It is also not known whether the whales recorded in the west of our study area share the same wintering areas as the satellite-tracked whales. Based on the recording of these signals in the southwestern Indian Ocean between January and June, it is possi-ble that a part of this population may migrate longi-tudinally from east to west in the Indian Ocean. This suggests there may be multiple migratory routes for this population of blue whales.
Sri Lankan pygmy blue whales
The chorus of Sri Lankan pygmy blue whales is absent at all sites but NEAMS. It confirms earlier observations in 2007 at NEAMS, although SWAMS also recorded few calls (Samaran et al. 2013), with calls occurring throughout the year with a slight peak in spring. In our study, in contrast, we found a decrease in the level of chorus in spring at NEAMS. Relatively few calls were detected near Crozet in 2004 (Samaran et al. 2010a). This seasonality more closely re sembles that reported near Diego Garcia (Stafford et al. 2011), which displays a first peak in March−April and a second peak from November to December. This lack of Sri Lankan chorus in our data and the few detections from previous studies in the same area support the common belief that this population mostly dwells in the northern Indian Ocean, with a limited migration to subantarctic lati-tudes during the austral summer and autumn, i.e. after the period of high productivity driven by mon-soons in the northern Indian Ocean (Branch 2007, Samaran et al. 2013).
Antarctic blue whales
For the Antarctic blue whale, the in-depth analysis of the first 6 yr of data (2010 to 2015) by Leroy et al. (2016) used monthly averages of the CNR instead of weekly averages. Both averages show similar sea-sonal patterns, but the weekly CNR levels help to refine the picture. They show a progressive arrival of the whales in autumn from the southernmost to the northernmost sites, and their presence throughout the winter and spring.
This south to north migration is consistent with that deduced from individual call numbers (Leroy et al. 2016). This agreement a posteriori validates the weekly CNR approach, although coarser than the call detec-tion approach.
Fin whales
The arrival of fin whales at the different sites also follows a latitudinal gradient. This observation pro-vides evidence for a likely south to north migration of the species. Fin whales are first heard south of the array at the end of austral summer, after spending the summer feeding off Antarctica (Širovic´ et al. 2004, 2009), and then move northwards to subantarc-tic and subtropical latitudes during the winter.
The CNR reaches its peak in May at the southern sites and in July−August at the northernmost site (MAD) and decreases synchronously across all sites toward October−November. The seasonal decrease in CNR may result from a change in acoustic behav-ior. Fin whale vocalizations, when produced in series, have been attributed to a mating behavior during the period of reproduction, which would explain a weak CNR during the austral summer, when the whales are feeding (e.g. Watkins et al. 1987, Croll et al. 2002, Širovic´ et al. 2009). Furthermore, there is some indi-cation that fin whales do not produce long bouts of 20 Hz pulses year-round but change their vocal behavior (Širovic´ et al. 2013).
CONCLUSIONS
The results of this wide-range and long-term data analysis confirm the importance of the southern Indian Ocean for several populations of large whales, simultaneously, as a possible feeding area, particu-larly for pygmy blue whales (Samaran et al. 2010a, 2013), and as a wintering area for Antarctic blue whales (Samaran et al. 2013, Leroy et al. 2016) and fin whales. This is also the first broad-scale assess-ment of the seasonal and geographic distribution of fin whales in the Indian Ocean. Pygmy blue whales do not migrate to the Antarctic waters but appear to spend their lives in subantarctic and subtropical waters. The Madagascan and Australian acoustic pop -ulations show similar seasonalities but clearly differ-ent distributions. Furthermore, their seasonal oc -currence in our hydrophone array is distinct from that of Antarctic blue whales and fin whales. The lat-ter are heard throughout the austral winlat-ter with the lowest CNR level in austral summer when they pre-sumably are off Antarctica.
Although the CNR metric does not provide fine-scale information on acoustic behavior or seasonal variations, it is an efficient tool for investigating the broad-scale spatial and seasonal distribution of dif-ferent whale populations. In our study area, this approach emphasizes the sympatric occurrence of several (sub-)species of blue whales and fin whales over many years and thousands of kilometers. These results call for future studies examining the inter -annual occurrence of each species in the context of oceanographic and environmental variability.
Acknowledgements. The authors thank the captains and
crew of RV ‘Marion Dufresne’ for the successful deploy-ments and recoveries of the hydrophones of the OHASISBIO
experiment (http://dx.doi.org/10.18142/229). French cruises were funded by the French Polar Institute (IPEV), with addi-tional support from INSU-CNRS. E.C.L. was supported by a PhD fellowship from the University of Brest and from the Regional Council of Brittany (Conseil Régional de Bre-tagne). K.M.S. contributed to this paper while staying at the University of Brest as Invited Professor. J.B. acknowledges funding from the Independent Research and Development Program at WHOI. The contribution of Mickael Beauverger at LGO to the logistics and deployment cruises is greatly appreciated.
LITERATURE CITED
Alling A, Dorsey E, Gordon J (1991) Blue whales (Balaen
-optera musculus) off the northeast coast of Sri Lanka:
dis-tribution, feeding and individual identification. UNEP Mar Mammal Tech Rep 3: 247−258
Attard CR, Beheregaray LB, Möller LM (2016) Towards pop-ulation-level conservation in the critically endangered Antarctic blue whale: the number and distribution of their populations. Sci Rep 6: 22291
Balcazar NE, Tripovich JS, Klinck H, Nieukirk SL, Mellinger DK, Dziak RP, Rogers TL (2015) Calls reveal population structure of blue whales across the southeast Indian Ocean and the southwest Pacific Ocean. J Mammal 96: 1184−1193
Barlow D, Torres L, Hodge K, Steel D and others (2018) Doc-umentation of a New Zealand blue whale population based on multiple lines of evidence. Endang Species Res 36: 27−40
Branch TA (2007) Abundance of Antarctic blue whales south of 60°S from three complete circumpolar sets of surveys. J Cetacean Res Manag 9: 253−262
Branch TA, Matsuoka K, Miyashita T (2004) Evidence for increases in Antarctic blue whales based on Bayesian modelling. Mar Mamm Sci 20: 726−754
Branch TA, Stafford KM, Palacios DM, Allison C and others (2007) Past and present distribution, densities and move-ments of blue whales Balaenoptera musculus in the Southern Hemisphere and northern Indian Ocean. Mam-mal Rev 37: 116−175
Buchan S, Hucke-Gaete R, Rendell L, Stafford K (2014) A new song recorded from blue whales in the Corcovado Gulf, Southern Chile, and an acoustic link to the Eastern Tropical Pacific. Endang Species Res 23: 241−252 Clapham PJ, Young SB, Brownell RL (1999) Baleen whales:
conservation issues and the status of the most endan-gered populations. Mammal Rev 29: 37−62
Cooke JG (2018) Balaenoptera musculus ssp. intermedia. The IUCN Red List of Threatened Species 2018: e.T4171 3A 50 22 6962. (accessed 22 Nov 2018). https://www. iucn redlist. org/species/41713/50226962#assessment- information Croll DA, Clark CW, Acevedo A, Tershy B, Flores S,
Gedamke J, Urban J (2002) Bioacoustics: Only male fin whales sing loud songs. Nature 417: 809
Cummings WC, Thompson PO (1971) Underwater sounds from the blue whale, Balaenoptera musculus. J Acoust Soc Am 50: 1193−1198
Curtis KR, Howe BM, Mercer JA (1999) Low-frequency ambient sound in the North Pacific: long time series observations. J Acoust Soc Am 106: 3189−3200
D’Eu JF, Royer JY, Perrot J (2012) Long-term autonomous hydrophones for large-scale hydroacoustic monitoring of
the oceans. In: Proceedings of Oceans 2012, Yeosu, South Korea. IEEE, p 1−6
Double MC, Andrews-Goff V, Jenner KCS, Jenner MN, Laverick SM, Branch TA, Gales NJ (2014) Migratory movements of pygmy blue whales (Balaenoptera
musculus brevicauda) between Australia and Indonesia as re
-vealed by satellite telemetry. PLOS ONE 9: e93578 Dréo R, Bouffaut L, Leroy E, Barruol G, Samaran F (in press)
Baleen whale distribution and seasonal occurrence re -vealed by an ocean bottom seismometer network in the western Indian Ocean. Deep Sea Res II, doi: 10.1016/ j. dsr2. 2018. 04. 005
Gavrilov AN, McCauley RD (2013) Acoustic detection and long-term monitoring of pygmy blue whales over the continental slope in southwest Australia. J Acoust Soc Am 134: 2505−2513
Gavrilov AN, McCauley RD, Salgado-Kent C, Tripovich J, Burton C (2011) Vocal characteristics of pygmy blue whales and their change over time. J Acoust Soc Am 130: 3651−3660
Gavrilov AN, McCauley RD, Gedamke J (2012) Steady inter and intra-annual decrease in the vocalization frequency of Antarctic blue whales. J Acoust Soc Am 131: 4476−4480
Gedamke J, Robinson SM (2010) Acoustic survey for marine mammal occurrence and distribution off East Antarctica (30−80°E) in January−February 2006. Deep Sea Res II 57: 968−981
Helble TA, D’Spain GL, Campbell GS, Hildebrand JA (2013a) Calibrating passive acoustic monitoring: correct-ing humpback whale call detections for site-specific and time-dependent environmental characteristics. J Acoust Soc Am 134: EL400−EL406
Helble TA, Gerald L, Hildebrand JA, Campbell GS, Camp-bell RL, Heaney KD (2013b) Site specific probability of passive acoustic detection of humpback whale calls from single fixed hydrophones. J Acoust Soc Am 134: 2556−2570
Ichihara T (1966) The pygmy blue whale, Balaenoptera
mus-culus brevicauda, a new subspecies from the Antarctic.
Whales Dolphins Porpoises 9: 79−111
IWC (1980) Chairman’s report of the thirty-first annual meeting. Rep Int Whal Comm 30: 25−41
Leduc RG, Archer FI, Lang AR, Martien KK and others (2017) Genetic variation in blue whales in the eastern pacific: implication for taxonomy and use of common wintering grounds. Mol Ecol 26: 740−751
Leroy EC, Samaran F, Bonnel J, Royer JY (2016) Seasonal and diel vocalization patterns of Antarctic blue whale (Balaenoptera musculus intermedia) in the southern Indian Ocean: a multi-year and multi-site study. PLOS ONE 11: e0163587
Ljungblad DK, Clark CW, Shimada H (1998) A comparison of sounds attributed to pygmy blue whales (Balaenoptera
musculus brevicauda) recorded south of the Madagascar
Plateau and those attributed to ‘true’ blue whales
(Bal-aenoptera musculus) recorded off Antarctica. Rep Int
Whal Comm 48: 439−442
McDonald MA, Mesnick SL, Hildebrand JA (2006) Biogeo-graphic characterization of blue whale song worldwide: using song to identify populations. J Cetacean Res Manag 8: 55–65
Mellinger DK, Clark CW (2003) Blue whale (Balaenoptera
musculus) sounds from the North Atlantic. J Acoust Soc
Mellinger DK, Stafford KM, Moore S, Dziak RP, Matsumoto H (2007) Fixed passive acoustic observation methods for cetaceans. Oceanography (Wash DC) 20: 36
Menze S, Zitterbart DP, van Opzeeland I, Boebel O (2017) The influence of sea ice, wind speed and marine mam-mals on Southern Ocean ambient sound. R Soc Open Sci 4: 160370
Nieukirk SL, Mellinger DK, Moore SE, Klinck K, Dziak RP, Goslin J (2012) Sounds from airguns and fin whales re -corded in the mid-Atlantic Ocean, 1999−2009. J Acoust Soc Am 131: 1102−1112
Payne R, Webb D (1971) Orientation by means of long range acoustic signaling in baleen whales. Ann NY Acad Sci 188: 110−141
Rankin S, Ljungblad D, Clark CW, Kato H (2005) Vocalisa-tions of Antarctic blue whales, Balaenoptera musculus
intermedia, recorded during the 2001/2002 and 2002/
2003 IWC/SOWER circumpolar cruises, Area V, Antarc-tica. J Cetacean Res Manag 7: 13−20
Rice DW (1998) Marine mammals of the world. In: Wartzok D (ed) The Society for Marine Mammalogy, Lawrence, KS
Royer JY (2009) OHA-SIS-BIO: Observatoire HydroAcous-tique de la SISmicité et de la BIOdiversité de l’Océan Indien. https://campagnes.flotteoceanographique.fr/ series/ 229/
Royer JY, Chateau R, Dziak RP, Bohnenstiehl DR (2015) Seafloor seismicity, Antarctic ice-sounds, cetacean vocal-izations and long-term ambient sound in the Indian Ocean basin. Geophys J Int 202: 748−762
Samaran F (2008) Analyse des signaux acoustiques d’origine biologique enregistrés dans l’Océan Indien: implications dans le recensement et le suivi des mouvements saison-niers des cétacés. PhD thesis, Université de La Rochelle Samaran F, Adam O, Guinet C (2010a) Discovery of a mid-latitude sympatric area for two Southern Hemisphere blue whale subspecies. Endang Species Res 12: 157−165 Samaran F, Adam O, Guinet C (2010b) Detection range modeling of blue whale calls in Southwestern Indian Ocean. Appl Acoust 71: 1099−1106
Samaran F, Stafford KM, Branch TA, Gedamke J, Royer JY, Dziak RP, Guinet C (2013) Seasonal and geographic vari-ation of southern blue whale subspecies in the Indian Ocean. PLOS ONE 8: e71561
Širovic´ A, Hildebrand JA, Wiggins SM, McDonald MA, Moore SE, Thiele D (2004) Seasonality of blue and fin whale calls and the influence of sea ice in the western
Antarctic peninsula. Deep Sea Res II 51: 2327−2344 Širovic´ A, Hildebrand JA, Wiggins SM (2007) Blue and fin
whale call source levels and propagation range in the Southern Ocean. J Acoust Soc Am 122: 1208−1215 Širovic´ A, Hildebrand JA, Wiggins SM, Thiele D (2009) Blue
and fin whale acoustic presence around Antarctica dur-ing 2003 and 2004. Mar Mamm Sci 25: 125−136
Širovic´ A, Wiggins SM, Oleson EM (2013) Ocean noise in the tropical and subtropical Pacific Ocean. J Acoust Soc Am 134: 2681−2689
Širovic´ A, Rice A, Chou E, Hildebrand JA, Wiggins SM, Roch MA (2015) Seven years of blue and fin whale call abundance in the Southern California Bight. Endang Species Res 28: 61−76
Socheleau FX, Leroy E, Pecci AC, Samaran F, Bonnel J, Royer JY (2015) Automated detection of Antarctic blue whale calls. J Acoust Soc Am 138: 3105−3117
Stafford KM, Nieukirk SL, Fox CG (2001) Geographic and seasonal variation of blue whale calls in the North Pacific. J Cetacean Res Manag 5: 65–76
Stafford KM, Bohnenstiehl DR, Tolstoy M, Chapp E, Mellinger DK, Moore SE (2004) Antarctic-type blue whale calls recorded at low latitudes in the Indian and eastern Pacific Oceans. Deep Sea Res I 51: 1337−1346 Stafford KM, Chapp E, Bohnenstiel DR, Tolstoy M (2011)
Seasonal detection of three types of ‘pygmy’ blue whale calls in the Indian Ocean. Mar Mamm Sci 27: 828−840 Thomisch K, Boebel O, Clark CW, Hagen W, Spiesecke S,
Zitterbart DP, Van Opzeeland I (2016) Spatio-temporal patterns in acoustic presence and distribution of Ant -arctic blue whales Balaenoptera musculus intermedia in the Weddell Sea. Endang Species Res 30: 239−253 Tripovich JS, Klinck H, Nieukirk SL, Adams T and others
(2015) Temporal segregation of the Australian and Antarctic blue whale call types (Balaenoptera musculus spp.). J Mammal 96: 603–610
Tsang-Hin-Sun E, Royer JY, Leroy EC (2015) frequency sound level in the Southern Indian Ocean. J Acoust Soc Am 138: 3439−3446
Tsang-Hin-Sun E, Royer JY, Perrot J (2016) Seismicity and active accretion processes at the ultraslow-spreading Southwest and intermediate-spreading Southeast Indian ridges from hydroacoustic data. Geophys J Int 206: 1232−1245
Watkins WA, Tyack P, Moore KE, Bird JE (1987) The 20-Hz signals of finback whales (Balaenoptera physalus). J Acoust Soc Am 82: 1901−1912
Editorial responsibility: Robert Harcourt, Sydney, New South Wales, Australia
Submitted: June 27, 2018; Accepted: September 26, 2018 Proofs received from author(s): November 22, 2018, 2018