HAL Id: hal-02338823
https://hal.archives-ouvertes.fr/hal-02338823
Submitted on 10 Nov 2020HAL is a multi-disciplinary open access archive for the deposit and dissemination of sci-entific research documents, whether they are pub-lished or not. The documents may come from teaching and research institutions in France or abroad, or from public or private research centers.
L’archive ouverte pluridisciplinaire HAL, est destinée au dépôt et à la diffusion de documents scientifiques de niveau recherche, publiés ou non, émanant des établissements d’enseignement et de recherche français ou étrangers, des laboratoires publics ou privés.
Controlled Growth of Ag Nanocrystals in a H-Bonded
Open Framework
Walid Khodja, Vincent Collière, Myrtil L. Kahn, Nans Roques, Jean-pascal
Sutter
To cite this version:
Walid Khodja, Vincent Collière, Myrtil L. Kahn, Nans Roques, Jean-pascal Sutter. Controlled Growth of Ag Nanocrystals in a H-Bonded Open Framework. Chemistry - A European Journal, Wiley-VCH Verlag, 2019, 25 (60), pp.13705-13708. �10.1002/chem.201903684�. �hal-02338823�
1
Controlled Growth of Ag NanoCrystals in an H-bonded
Open-Framework
Walid Khodja, Vincent Collière, Myrtil L. Kahn, Nans Roques, Jean-Pascal Sutter*
Laboratoire de Chimie de Coordination (LCC) du CNRS, Université de Toulouse, CNRS, Toulouse, France
Table of Content
A rational access to hybrid material made of NPs grown within an H-bonded framework is reported. The metal precursor was chemically trapped in the porous structure and subsequently photo-reduced to afford Ag NPs of nanometric sizes (< 15 nm) homogeneously distributed in the crystals of the host material. In a subsequent step, taking advantage of the porous matrix the silver NPs have been transformed in-situ to Ag2S NPs by reaction with H2S.
Keywords:
H-bonded open framework; Organic-inorganic hybrid composites; Nanoparticles; Silver; Silver sufide.
2 Abstract :
A procedure that enabled rational access to the first example of hybrid material made of NPs grown within an H-bonded framework is reported. To avoid competitive reactions with the framework units, the metal precursor was chemically trapped in the porous structure and subsequently photo-reduced to afford the hybrid material Ag@SPA-2, which consists in Ag NPs of nanometric sizes (< 15 nm) homogeneously distributed in the crystals of the host material. In a subsequent step, taking advantage of the porous matrix the silver NPs have been transformed in-situ to Ag2S NP by simple infiltration of H2S. The supramolecular
network is shown to play an important role in stabilizing the inorganic nanomaterials and thus in controlling their growth.
3
Hydrogen-bonded open-frameworks are an emergent class of microporous molecule-based materials.[1-6] They are characterized by a robust crystalline lattice with large porosity resulting, like for MOF (metal-organic frameworks) and COF (covalent organic frameworks),[7] in remarkable sorption properties[8-12] with possible use for gas separation,[13-14] selective detection,[15] or drug encapsulation.[16] The majority of the reported H-bonded frameworks are purely organic systems know as HOF (H-bonded Organic Framework). They are formed typically by homo-assemblage of neutral molecules but related architectures have also been achieved following a bimolecular approach with charged H-donor and H-acceptor units, including metal complexes.[4, 17-19] An interesting feature of the latter is the reinforcement of the H-bond by the Coulombic interaction resulting in a robust and predictable supramolecular assemblage pattern.[20-21]
MOF and COF frameworks have been combined with inorganic nanoparticles (NPs) to reach hybrid materials for which the confined space and sieving properties of the microporous component add to the property of the inorganic species to gain selectivity in catalysis or in sensing applications, for instance.[22-25] These frameworks have also been used as matrix for the controlled growth of nanoparticles.[26] The possibility of using the related H-bonded open frameworks as a host matrix for inorganic nanocrystals has, however, never been documented. This may appear surprising when some exclusive features of these host materials are considered; among which the weaker supramolecular bond energy that allows for self-healing of the frameworks or easy release of the guests by simple dissolution of the matrix. Actually, this apparent lack of interest is to be related to the challenge arising from the capability of the H-bond donor and acceptor groups to act also as ligands towards metal ions, a propensity that jeopardizes the integrity of the porous framework.
Herein, we disclose a procedure that enabled rational access to the first example of hybrid material made of NPs grown within an H-bonded framework (i.e. SPA-2, vide infra). To avoid competitive reactions with the framework units, the metal precursor was chemically trapped in the porous structure and subsequently photo-reduced to afford the hybrid material Ag@SPA-2, which consists in Ag NPs of nanometric sizes (< 15 nm) homogeneously distributed in the crystals of the host material. In a subsequent step, taking advantage of the porous matrix the silver NPs have been transformed in-situ to Ag2S NP by simple infiltration
of H2S.
The classical procedure for growing metal NPs within a porous structure involves two steps, namely the inclusion of a metal precursor, typically a metal salt or complex, into the matrix, followed by a reduction step leading to the growth of the NPs. For an H-bonded matrix, it is the first step that can be especially problematic because of the possible competition between interactions and metal coordination for the chemical groups involved in the H-bond network (typically carboxylic acids and amines derivatives). To circumvent this drawback we considered the possibility of trapping the inserted metal precursor derivative by a chemical species within the channels of the porous material. Dealing with Ag+,
4
formation of AgCl appeared as an interesting option because it can be easily photo-reduced to Ag metal. This approach proved efficient using SPA-2, a supramolecular porous architecture containing chloride anions in its channels.[19]
The templating matrix, SPA-2, is characterized by 1 nm-large pores interconnected in the three directions of space. The framework results from assemblage in a 1:1 ratio of [Al(oxalate)3]3- and protonated tetrakis(4-pyridyl-oxymethyl)methane, [H4Tpy]4+, respectively
the H-bond acceptor and donor. Only three pyridinium of the [H4Tpy]4+ units are involved in
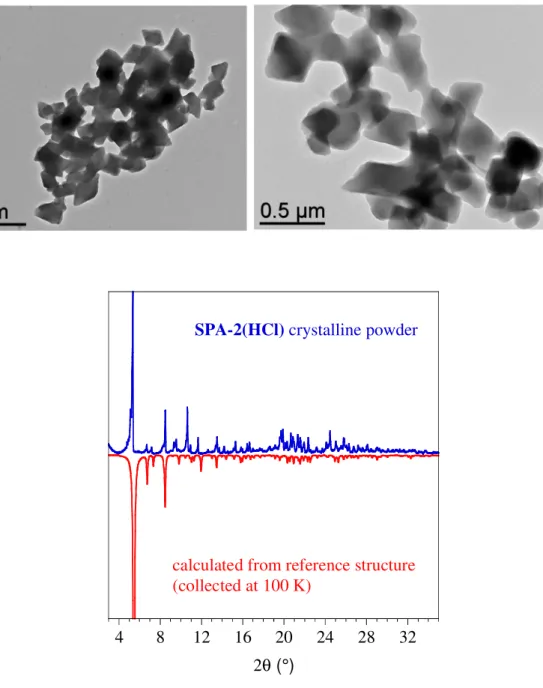
H-bonds with the oxalate moieties, the fourth is outside this network, pointing towards the channel space (Scheme S1). Since synthesis is performed in acidic medium, the latter protonated pyridyl is associated to an anion located in the channels. For the present study, SPA-2 was prepared in HCl solution and SPA-2(HCl) was precipitated as a submicronic crystalline powder (See experimental in SI). The formation of the expected framework was corroborated by PXRD (Figure S1).
Impregnation with Ag+ was performed by mixing in the dark AgNO3 (0.9 equivalent versus
[H4Tpy]4+) with a suspension of SPA-2(HCl) in absolute EtOH for ca 10 min. Formation of
AgCl@SPA-2 was confirmed by PXRD (Figure 1) showing that the SPA framework has not been affected, and diffractions peaks characteristic for AgCl. Transmission Electron Microscopy (TEM) revealed that AgCl formed as NPs spread all over the crystals of SPA-2 with two size-distributions centered at ca. 9 and 5 nm, the latter being the largest population. The sizes of these NPs exceed the pore size of 1 nm in the SPA-2, confirming that this flexible framework cannot withstand the growth of the inorganic material. However, the NPs remain embedded and well dispersed in the SPA crystals.
Figure 1. (from left to right) PXRD for AgCl@SPA-2 (in blue) compared to the starting SPA-2(HCl), the insert is a magnification of the diffraction pattern between 30 and 90° showing the diffraction peaks of AgCl; TEM image of a crystal of AgCl@SPA-2 with size distribution for AgCl NPs (8.6 ± 5.4 nm and 4.8 ± 2.1 nm)[27], and composition analysis by energy dispersive X-ray analysis, EDX (Cu comes from
5
The reduction of Ag+ to Ag metal was achieved by UV-irradiation (365 nm) of AgCl@SPA-2 suspended in EtOH-H2O. The formation of Ag@SPA-2 can be observed by the color change of
the solid from white to orange-brown that develops rapidly after irradiation was started (Figure S2). This coloration is related to a rather broad absorption band centered at 420 nm (Figure S2) that can be attributed to the surface plasmon resonance of Ag nanoparticules.[28] The photo-reduction process was followed by cyclic voltammetry performed on the solid (Figure 2) and found to be completed after 120 min. Before UV-irradiation, only the characteristic signature for AgCl was observed, with reduction and oxidation waves at respectively, -0.07 and 0.22 V (vs Ag/AgCl). Upon photo-reduction a second oxidation wave appeared at 0.73 V, which is ascribed to Ag NPs.[29-30] After 120 min under UV irradiation only the signal arising from Ag NPs was observed suggesting a total reduction of the Ag+ centers. The role of the liquid media was examined and H2O was found to play an essential role in the
efficiency of the photo-reduction process. When the reduction was performed in pure EtOH, a substantial fraction of AgCl remained even after 4h of irradiation (Figure SI3). Therefore, for the preparations of Ag@SPA-2 discussed herein an irradiation in EtOH/H2O (3/1) for 120
min was applied.
Figure 2. Ag@SPA-2: (from left) cyclic voltammograms of AgCl@SPA-2 before irradiation and after 120 min (deposited on GC, KNO3 (0.1 M in H2O) buffer, scan rate 0.20 V/s, reference electrode
Ag/AgCl); PXRD pattern for Ag@SPA-2 after completion of the photo-reduction process (120 min), the insert is a magnification of the diffraction pattern between 30 and 90° showing the diffraction
peaks of Ag.
The PXRD for Ag@SPA-2 (Figure 2) shows the presence of diffractions peaks that can be attributed to fcc Ag and the disappearance of those for AgCl; besides the crystallinity of the supramolecular framework appears unaffected. The electronic microscopy investigation for Ag@SPA-2 (Figures 3 and S4 for dark-field images) shows that the Ag NPs are distributed all over the crystals of SPA and located in the upper layers of the crystals, a situation
-0.5 0 0.5 1 1.5 -0.4 -0.2 0 0.2 0.4 0.6 0.8 1 1.2 AgCl@SPA-2 before hν
Ag@SPA-2 after 120 min hν
cu rr en t (n o rm al iz ed ) potential (V) 30 40 50 60 70 80 90 (1 1 1 ) (2 0 0 ) (2 2 0 ) (3 1 1 ) (2 2 2 ) 0 20 40 60 80 2θ ∆ ∆ ∆ ∆ ∆ Ag@SPA-2 ∆ : fcc Ag
6
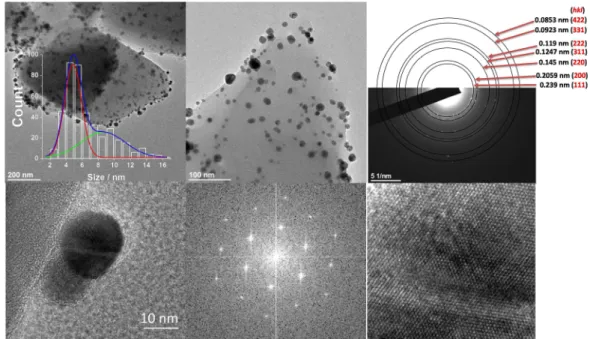
reminiscent to that observed for the precursor system, AgCl@SPA-2. This is expected for a gradual reduction of the AgCl NPs to their metallic homologues. They consist in isotropic particles with two size populations centered respectively at 9 and 16 nm. The slightly larger size of the Ag NPs compared to the AgCl NPs can be attributed to the merging with smaller particles located in their vicinity. These particles were found to have a high degree of crystallinity and the electron diffraction pattern of a collection of NPs showed diffraction points concentrically aligned at distances characteristic of the face centered cubic (fcc) phase of Ag. In addition, the image analysis by means of the Fourier technique performed on a single NP confirmed the presence of a cubic phase with relative interplanar distances of d = 0.229, 0.115, and 0.131 nm. These distances can be attributed to the (111), (222), and (311) planes of the fcc structure of Ag, respectively. EDX analysis showed the presence of the expected framework atoms and the absence of detectable amounts of chlorine (Figure S4). This latter information suggests that the Cl- anions are released in the liquid medium during the reduction process.
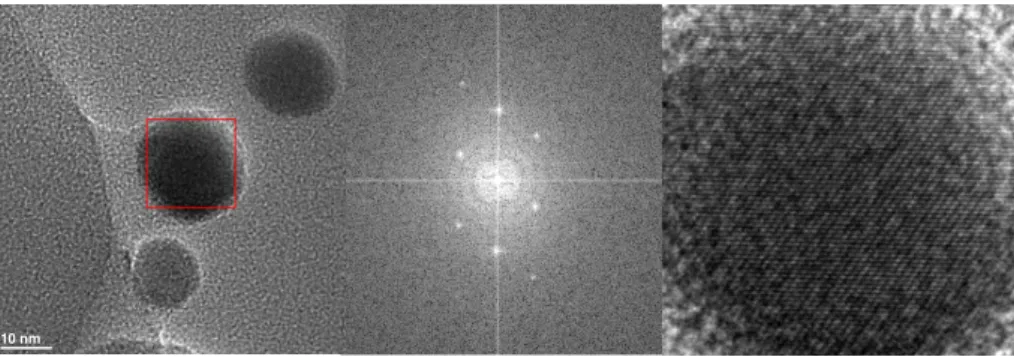
Figure 3: (top) TEM images of Ag@SPA-2 with AgNPs size distribution (9.2 ± 5.2 and 15.5 ± 9.9 nm) and electron diffraction pattern recorded for an assembly of NPs located in a SPA-2 crystal; (bottom) HRTEM of a single NP, associated Fourier transform, and reconstructed image.
The HRTEM also showed that even the NPs are located at the surface of the SPA-2 crystals, they remain coated by the matrix material (Figures 3 and 4). The essential role of the organic phase in the stabilization of the Ag particles was demonstrated by dissolving the SPA material, which was achieve at room temperature using a H2O/HNO3 solution with pH = 2.
TEM performed on the released NPs evidenced dramatic modifications of their size and aspect (Figure S5) as a result of rapid and uncontrolled coalescence. This observation
7
confirms that the NPs are embedded in the SPA, and that the matrix plays an important role in both the growth and the stability of the inorganic nanomaterial.
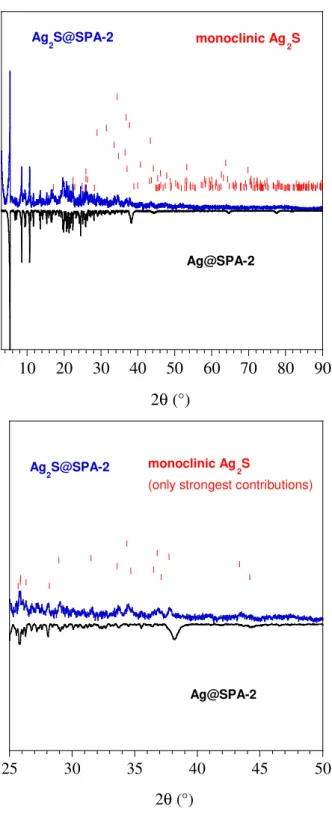
Interestingly, the NPs remain accessible to molecules able to infiltrate the porous SPA framework. This possibility was used to perform an in-situ chemical transformation of Ag@SPA-2 in to Ag2S@SPA-2 simply by addition of H2S to a suspension in EtOH. The PXRD
pattern (Figure S6) showed the disappearance of the peaks for fcc Ag and the appearance of new peaks that can be ascribed to Ag2S, indicating a complete conversion. Electron
diffraction confirmed the formation of monoclinic Ag2S NPs. Again, these particles were
found to have a high degree of crystallinity (Figure 4). The image analysis by means of the Fourier technique performed on a single NP reveals the presence of a monoclinic phase with relative interplanar distances of d = 0.344, 0.261, 0.218, 0.198, 0.171, and 0.130 nm. These distances can be attributed to the (020), (120), (03-1), (12-3), (22-2) and (30-3) planes of the monoclinic structure of Ag2S, respectively.
Figure 4. HRTEM of a single NP in Ag2S@SPA-2, associated Fourier Transform, and reconstructed image.
The results gathered demonstrate for the first time that H-bonded porous architectures can be used as a matrix for the growth of inorganic NPs. The chemical trapping of the metal precursor in the hosting system is shown to be an efficient approach to circumvent possible competition between interactions and metal coordination for the building units of an H-bond network.
During their growth, the inorganic NPs remain embedded and well dispersed in the SPA crystals. This confirms a growth process within, and thus controlled by, the matrix. As illustrated for the Ag NPs, the supramolecular network also plays an important role in stabilizing the inorganic nanomaterials. Moreover, the porosity of the host material makes the NP accessible for small molecules. This was exemplified by the in-situ transformation of the imbedded Ag NPs to Ag2S NPs by H2S.
Finally, the micro-crystalline NPs@SPA system makes the manipulations and transformation of nano-sized particles easy and safe while allowing their release by simple dissolution of the matrix.
8
Acknowledgements: Authors are grateful to Alix Sournia-Saquet and Alain Moreau for performing electrochemistry investigations. This work was supported by the French research agency ANR (contract reference ANR-15-CE29-0013-01).
REFRENCES:
[1] P. Brunet, M. Simard, J. D. Wuest, J. Am. Chem. Soc. 1997, 119, 2737-2738. [2] D. Laliberté, T. Maris, J. D. Wuest, J. Org. Chem. 2004, 69, 1776-1787.
[3] X.-Z. Luo, X.-J. Jia, J.-H. Deng, J.-L. Zhong, H.-J. Liu, K.-J. Wang, D.-C. Zhong, J. Am. Chem. Soc. 2013, 135, 11684-11687.
[4] T. Adachi, M. D. Ward, Acc. Chem. Res. 2016, 49, 2669-2679.
[5] R.-B. Lin, Y. He, P. Li, H. Wang, W. Zhou, B. Chen, Chem. Soc. Rev. 2019, 48, 1362-1389. [6] I. Hisaki, C. Xin, K. Takahashi, T. Nakamura, Angew. Chem. Inter. Ed. 2019, 58, DOI: 10.1002/anie.201902147.
[7] A. G. Slater, A. I. Cooper, Science 2015, 348, aaa8075.
[8] T.-H. Chen, I. Popov, W. Kaveevivitchai, Y.-C. Chuang, Y.-S. Chen, O. Daugulis, A. J. Jacobson, O. Š. Miljanić, Nat Commun 2014, 5, 5131.
[9] F. Hu, C. Liu, M. Wu, J. Pang, F. Jiang, D. Yuan, M. Hong, Ang. Chem. Int. Ed. 2017, 56, 2101-2104.
[10] Y.-L. Wu, N. E. Horwitz, K.-S. Chen, D. A. Gomez-Gualdron, N. S. Luu, L. Ma, T. C. Wang, M. C. Hersam, J. T. Hupp, O. K. Farha, R. Q. Snurr, M. R. Wasielewski, Nat Chem 2017, 9, 466-472.
[11] P. Li, P. Li, M. R. Ryder, Z. Liu, C. L. Stern, O. K. Farha, J. F. Stoddart, Ang. Chem. Int. Ed. 2019,
58, 1664-1669.
[12] A. I. Cooper, Ang. Chem. Int. Ed. 2012, 51, 7892-7894.
[13] H. Wang, B. Li, H. Wu, T.-L. Hu, Z. Yao, W. Zhou, S. Xiang, B. Chen, J. Am. Chem. Soc. 2015,
137, 9963-9970.
[14] P. Li, Y. He, Y. Zhao, L. Weng, H. Wang, R. Krishna, H. Wu, W. Zhou, M. O'Keeffe, Y. Han, B. Chen, Ang. Chem. Int. Ed. 2015, 54, 574-577.
[15] S. Cai, H. Shi, Z. Zhang, X. Wang, H. Ma, N. Gan, Q. Wu, Z. Cheng, K. Ling, M. Gu, C. Ma, L. Gu, Z. An, W. Huang, Ang. Chem. Int. Ed. 2018, 57, 4005-4009.
[16] Q. Yin, P. Zhao, R. J. Sa, G. C. Chen, J. Lü, T. F. Liu, R. Cao, Ang. Chem. Int. Ed. 2018, 57, 7691-7696.
[17] M. Morshedi, M. Thomas, A. Tarzia, C. J. Doonan, N. G. White, Chem. Sci. 2017, 8, 3019-3025. [18] N. Roques, G. Mouchaham, C. Duhayon, S. Brandès, A. Tachon, G. Weber, J. P. Bellat, J.-P. Sutter, Chem. Eur. J. 2014, 20, 11690-11694.
[19] G. Mouchaham, N. Roques, W. Khodja, C. Duhayon, Y. Coppel, S. Brandès, T. Fodor, M. Meyer, J.-P. Sutter, Chem. Eur. J. 2017, 23, 11818-11826.
[20] M. Meot-Ner, Chem. Rev. 2012, 112, PR22.
[21] G. Mouchaham, M. Gualino, N. Roques, C. Duhayon, S. Brandes, J.-P. Sutter, CrystEngComm 2015, 17, 8906-8914.
[22] S. Li, F. Huo, Nanoscale 2015, 7, 7482-7501.
[23] C. Rosler, R. A. Fischer, CrystEngComm 2015, 17, 199-217.
[24] A. Dhakshinamoorthy, A. M. Asiri, H. Garcia, ACS Catalysis 2017, 7, 2896-2919.
[25] M. Bhadra, H. S. Sasmal, A. Basu, S. P. Midya, S. Kandambeth, P. Pachfule, E. Balaraman, R. Banerjee, ACS Applied Materials & Interfaces 2017, 9, 13785-13792.
[26] S. Goswami, H. Noh, L. R. Redfern, K.-i. Otake, C.-W. Kung, Y. Cui, K. W. Chapman, O. K. Farha, J. T. Hupp, Chem. Mater. 2019, 31, 1485-1490.
[27] Note: The mean diameter is evaluated by fitting of the histogram with Gaussian curve. The first value corresponds to the center of the peak whereas the second one corresponds to twice the
9
standard deviation of the Gaussian distribution or approximately 0.849 the width of the peak at half-height.
[28] K. B. Mogensen, K. Kneipp, J. Phys. Chem. C 2014, 118, 28075-28083. [29] M. Giovanni, M. Pumera, Electroanalysis 2012, 24, 615-617.
10
Supporting Information
CONTENT :
• Experimental
• Scheme S1: SPA-2 building units and crystal structure.
• Figure S1 . SPA-2(HCl): TEM images and X-ray powder diffraction for as synthetized crystalline powder
• Figure S2. Absorption spectrum for Ag@SPA-2
• Figure S3. X-ray powder diffraction pattern for AgCl@SPA-2 irradiated at 365 nm for 240 min in absolute EtOH.
• Figure S4: Dark-field picture for an Ag@SPA-2 crystal
• Figure S5: TEM images for Ag NPs after dissolution of the SPA-2-matrix
11 EXPERIMENTAL :
Chemicals: AgNO3 (>99.8%), Absolute EtOH (99.9% vol.), technical EtOH (96% vol.) and HCl
solution (37%) were purchased from commercial sources and used without further purification.
Synthesis:
SPA-2(HCl): The preparation of submicron-sized crystals of SPA-2(HCl) was adapted from the published procedure.1 {K3[Al(C2O4)3]}.3H2O (37 mg, 0.080 mmol) was dissolved in 10 mL of
distilled water, Tpy (46 mg, 0.080 mmol) was added followed by 30 µL of HCl (37 %). Once the organic molecule was completely dissolved, the pH of the solution was around 3. The rapid addition of 30 mL of EtOH (96%) into the reaction mixture under vigorous stirring resulted in the formation of a solid. The reaction medium was then centrifuged (2500 rpm, 5 minutes), and the mother liquor was removed to yield SPA-2.HCl (ca 100 mg) as crystalline powder (Fig. S1).
Ag@SPA-2: Freshly isolated2 SPA-2.HCl (95 mg, 0.074 mmol) was dispersed in absolute EtOH (6mL) and a solution of AgNO3 (11,7 mg, 0,069 mmol, 0,9 eq) in absolute EtOH (10 mL) was
added dropwise, within a minute, in the absence of light. The reaction medium was stirred for additional 6 minutes in dark to yield AgCl@SPA-2. After this impregnation step, the solution was centrifuged (3000 rpm, 2 minutes), and the supernatant was removed. The powder was washed with 15 mL of absolute EtOH, centrifuged (3000 rpm, 2 minutes), and the supernatant was removed. The resulting AgCl@SPA-2 powder was dispersed in a mixture of EtOH:H2O (3:1), before being irradiated under UV light (365 nm) for 2 hours,
under stirring. A color change (white to orange) is observed after 5 minutes of exposure to UV light. The color of the sample evolves to become brown at the end of the irradiation time. Ag@SPA-2 was centrifuged, washed with 3x 10mL EtOH:H2O (3:1), and kept in the dark
in this liquid medium before further use.
Ag2S@SPA-2: A THF solution (0.8 M) of H2S (50µL; 40 µmol) was added to a suspension of
Ag@SPA-2 (50 mg) in EtOH:H2O (3:1) resulting in an immediate color change from brown to
black. Sampling for microscopy studies has been done 2h after mixing the reagents. Apparatus and methods
UV lamp: A 100 Watt Analytik Jena UV lamp (UVP B-100AP) was used for the
photo-reduction experiments. It was positioned ca 10 cm above the top of the reaction mixture.
Electrochemistry: Voltammetric measurements were carried out with a potentiostat Autolab
PGSTAT100 (ECO Chemie, The Netherlands) controlled by GPES 4.09 software. Experiments
1
G. Mouchaham, N. Roques, W. Khodja, C. Duhayon, Y. Coppel, S. Brandès, T. Fodor, M. Meyer, J.-P. Sutter, Chem.
Eur. J. 2017, 23, 11818-11826.
2
Alternatively, air-dried SPA-2.HCl was suspended in EtOH (96%) for 90 min before the liquid was changed for absolute EtOH.
12
were performed at 298 K in a homemade airtight three-electrode cell connected to a vacuum/argon line. The reference electrode consisted of a saturated calomel electrode (SCE) separated from the solution by a bridge compartment. The counter electrode was a platinum wire of 1 cm2 apparent surface. The working electrode was glassy carbon micro-disk (1.0 mm of diameter – Bio-logic SAS). The media used during electrochemical studies was typically a H2O solution of 0.1 mol.L-1 KNO3 (Fluka, puriss p.a. ACS 99%). Before each
measurement, the solutions were degassed by bubbling argon, and the working electrode was polished with a polishing machine (Presi P230).
Electrode preparation: The modified GC electrode was prepared as follows: 10 mg of
AgCl/Ag@SPA-2 was mixed with 100 µL of Nafion solution (100 µL of n-propanol, 2 µL of 5 % Nafion and 398 µL distilled water). The mixture was ultra-sonicated for 5 min to obtain an ink. Then 1 µL of the ink was deposited onto the polished GC disk electrode with a micropipette. The working electrode was then dried for 10 minutes at room temperature. Solvent evaporation was monitored by optical microscope. The surface layer of the electrode was checked before and after each electrochemical measurement.
X-ray powder diffraction (XRPD): Diffraction data were collected for wetted samples. The
powder X-ray diffraction pattern was collected on a XPert Pro (Theta-Theta mode) Panalytical diffractometer with λ(Cu, Kα1, Kα2) = 1.54059, 1.54439 Å.. The apparatus was
used in a configuration for capillary analysis (WJM-Glas, 0.5 mm OD, 0.01 mm wall thickness), with a multilayer mirror focusing on the detector. The data were recorded over an angular range (2θ) of 2 to 90°, with a pitch of 0.016° and a counting time in steps of 900 seconds. The extraction of peak positions for indexing was performed with the fitting program, available in the PC software package Highscore+ supplied by Panalytical.
High Resolution Transmission Electronic Microscopy (TEM): A JEOL JSM 1011 Transmission
Electron Microscope operating at 100 kV or a JEOL JSM 2100F High Resolution Transmission Electron Microscope operating at 200 kV were used for TEM or HRTEM imaging, respectively. Analysis of the images were performed using Digital Micrograph program. Image J software3 was used manually or with a macro in order to extract width and length of nano-objects in various micrographs. The macro is based on the PSA macro, available at https://code.google.com/archive/p/psa-macro/. Overlapping nanoparticles are automatically rejected for the statistical analysis. The nanoparticle size-distribution histograms were determined from magnified TEM images. The size distributions of the particles
were determined by measuring a minimum of 200 particles of each sample. The size distributions observed were generally analyzed in terms of Gaussian statistics.
13
UV-Visible Spectroscopy: Spectra have been recorded on a Perkin Elmer UV-Vis
Spectrometer, UV / VIS / NIR LAMBDA Spectrometer 950. A spectralon® was used as a blank for diffuse reflectance measurements.
14
Figure S1 . SPA-2(HCl): TEM images and X-ray powder diffraction for as synthetized crystalline
powder, the experimental diffraction pattern (in blue) is compared to the one calculated (in red) with cif of reference structure (CCDC-1537662).
4 8 12 16 20 24 28 32
2θ (°)
SPA-2(HCl) crystalline powder
calculated from reference structure (collected at 100 K)
15
And aigure S2. Ag@SPA-2: Color developing during photo-reduction, Absorption spectrum for Ag@SPA-2 collected (in solid state) on a sample after 2h under UV(365nm) irradiation.
Figure S3. X-ray powder diffraction pattern for AgCl@SPA-2 irradiated at 365 nm for 240 min in absolute EtOH. (the stronger signal at 5.3° is cut at half of its intensity for clarity)
30 40 50 60 70 80 90 * * * * * 10 20 30 40 50 60 70 80 90 2 theta (°)
*
* **
* AgCl
Ag *
16
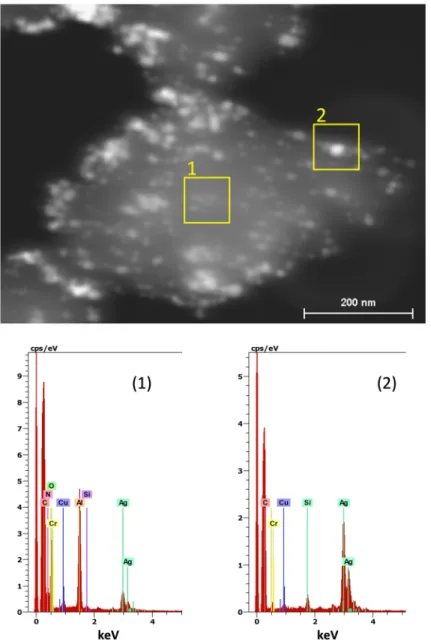
Figure S4: Dark-field picture for an Ag@SPA-2 crystal showing area where EDX analysis was performed: (1) zone with lower NP density, (2) centered on a larger NP.
The EDX analysis performed on zone (1) yielded a composition comprising the light atoms (C, N, and O) and Al expected from the SPA-2 material in addition to Ag. For zone (2), focused on an Ag NP, resulting composition shows a larger proportion of Ag. It can be noticed that no chlorine atom was detected. The presence of Cu is due to the grid.
17
18
Figure S6: PXRD for Ag2S@SPA-2: Experimental data (in blue) compared to Ag@SPA-2 (in black), with (in red) the expected peak positions and their relative intensities for monoclinic Ag2S between (left) 3
and 90° and (right) detail of the pattern between 25 and 50°
10 20 30 40 50 60 70 80 90 2θ (°) Ag@SPA-2 Ag 2S@SPA-2 monoclinic Ag2S 25 30 35 40 45 50 2θ (°) Ag@SPA-2 Ag 2S@SPA-2 monoclinic Ag 2S