HAL Id: hal-02481717
https://hal.archives-ouvertes.fr/hal-02481717
Submitted on 6 Nov 2020HAL is a multi-disciplinary open access archive for the deposit and dissemination of sci-entific research documents, whether they are pub-lished or not. The documents may come from teaching and research institutions in France or abroad, or from public or private research centers.
L’archive ouverte pluridisciplinaire HAL, est destinée au dépôt et à la diffusion de documents scientifiques de niveau recherche, publiés ou non, émanant des établissements d’enseignement et de recherche français ou étrangers, des laboratoires publics ou privés.
Seasonal shift in airborne microbial communities
Romie Tignat-Perrier, Aurélien Dommergue, Alban Thollot, Olivier Magand,
Pierre Amato, Muriel Joly, Karine Sellegri, Timothy Vogel, Catherine Larose
To cite this version:
Romie Tignat-Perrier, Aurélien Dommergue, Alban Thollot, Olivier Magand, Pierre Amato, et al.. Seasonal shift in airborne microbial communities. Science of the Total Environment, Elsevier, 2020, 716, pp.137129. �10.1016/j.scitotenv.2020.137129�. �hal-02481717�
1 Seasonal shift in airborne microbial communities linked to land use
1 2
Romie Tignat-Perrier1,2*, Aurélien Dommergue1, Alban Thollot1, Olivier Magand1, Pierre 3
Amato3, Muriel Joly3, Karine Sellegri3, Timothy M. Vogel2, Catherine Larose2 4
1
Institut des Géosciences de l’Environnement, Université Grenoble Alpes, CNRS, IRD, 5
Grenoble INP, Grenoble, France 6
2
Environmental Microbial Genomics, CNRS UMR 5005 Laboratoire Ampère, École Centrale 7
de Lyon, Université de Lyon, Écully, France 8
3
Institut de Chimie de Clermont-Ferrand, CNRS UMR 6096 Université Clermont Auvergne-9
Sigma, Clermont-Ferrand, France 10 *[email protected] 11 12 Highlights 13
-Airborne microbial communities showed a seasonal shift at the puy de Dôme elevated site 14
-Dominant microbial taxa showed different trends throughout the year 15
-Summer results in higher concentrations of plant-associated microbes in the air 16
-Winter results in higher concentrations of soil and dead material-associated microbes 17
-Seasonal changes in the underlying ecosystems likely drive microbial seasonal shift 18 19 20 21 22 23 24 Abstract 25
2 Microorganisms are ubiquitous in the atmosphere. Global investigations on the geographical 26
and temporal distribution of airborne microbial communities are critical for identifying the 27
sources and the factors shaping airborne communities. At mid-latitude sites, a seasonal shift in 28
both the concentration and diversity of airborne microbial communities has been 29
systematically observed in the planetary boundary layer. While the factors suspected of 30
affecting this seasonal change were hypothesized (e.g., changes in the surface conditions, 31
meteorological parameters and global air circulation), our understanding on how these factors 32
influence the temporal variation of airborne microbial communities, especially at the 33
microbial taxon level, remains limited. Here, we investigated the distribution of both airborne 34
bacterial and fungal communities on a weekly basis over more than one year at the mid-35
latitude and continental site of puy de Dôme (France; +1465 m altitude above sea level). The 36
seasonal shift in microbial community structure was likely correlated to the seasonal changes 37
in the characteristics of puy de Dôme’s landscape (croplands and natural vegetation). The 38
airborne microbial taxa that were the most affected by seasonal changes trended differently 39
throughout the seasons in relation with their trophic mode. In addition, the windy and variable 40
local meteorological conditions found at puy de Dôme were likely responsible for the 41
intraseasonal variability observed in the composition of airborne microbial communities. 42
43
Keywords: atmospheric microorganisms, bioaerosols, planetary boundary layer, amplicon 44
sequencing, biosphere-atmosphere interactions 45
46
Introduction 47
Thousands to millions of diverse microbial cells per cubic meter of air are transported among 48
aerosols with their diversity shown to depend on geographic location1 and time of year2. 49
These microorganisms might be active, since some airborne microbial isolates were shown in 50
3 laboratory studies to sustain metabolic activity using organic acids found in the atmosphere3–5. 51
Understanding the global distribution of airborne microbial communities is critical for 52
determining how airborne microorganisms might influence atmospheric chemistry4, 53
meteorological processes such as cloud and precipitation formation6, as well as human and 54
crop health7. Recent large geographical and spatial investigations highlighted the major 55
contribution of the local landscapes and local environmental factors in the observed 56
distribution of airborne microbial communities in the planetary boundary layer1,8. The 57
composition of airborne microbial communities is closely related to the nature of the 58
surrounding landscapes (ocean, agricultural soil, forest etc.) from which local meteorology 59
(especially wind direction and speed) controls microbial cell emission rates1. Studies on 60
airborne microbial communities at mid-latitude sites (aerosol-, cloud water- and precipitation-61
associated microorganisms) reported seasonal changes in both microbial biomass and 62
biodiversity2,9–13. The seasonal variability was associated to changes in surface conditions10,11, 63
meteorological conditions2,9 and/or changes in the global air circulation9,13. Yet, our 64
understanding on how these potential factors impact airborne microbial community 65
composition, and more specifically the microbial taxa individually, remains limited. Here, we 66
investigated the distribution of airborne microbial communities and specific microbial taxa at 67
the mid-latitude and continental site of puy de Dôme (France; +1465 m altitude above sea 68
level). We monitored the diversity and abundance of bacterial and fungal communities in the 69
troposphere on a weekly basis for more than a year (June 2016 to August 2017). These 70
microbial community metrics were evaluated in relation to the local meteorology and 71
particulate matter chemical composition, and puy de Dôme local landscape was evaluated 72
based on the MODIS satellite images. While a number of studies focusing on microorganisms 73
in clouds has been carried out at puy de Dôme3,4,14–17, no investigation was conducted in the 74
dry troposphere and at such a high temporal resolution. Puy de Dôme is surrounded mainly by 75
4 croplands and vegetation (i.e. > 80% of the surrounding landscapes in a perimeter of 50 km) 76
whose surface characteristics change drastically over the four different seasons (summer, 77
autumn, winter and spring). These seasonal changes in landscape were related to the temporal 78
variability of airborne microbial community composition at the microbial taxon level. 79
80
Material and Methods 81
Sites and Sampling 82
A size selective high volume air sampler installed at the puy de Dôme (PDD) meteorological 83
station terrace was used to collect particulate matter on quartz fiber filters every week from 84
June 2016 to August 2017 (Table S1). The sampler was equipped with a PM10 size-selective 85
inlet in order to collect particulate matter smaller than 10 µm (PM10) and sampling was done 86
as presented in Dommergue et al. (2019)18. Overall, the dataset was composed of fifty-three 87
samples with an average normalized collected volume of 9100 m3 (Table S1). Quartz fiber 88
filters were heated to 500°C for 8 hours to remove traces of organic carbon including DNA. 89
All the material including the filter holders, aluminium foils and plastic bags in which the 90
filters were transported were sterilized using UV radiation as detailed in Dommergue et al., 91
(2019)18. A series of field and transportation blank filters were carried out to monitor the 92
quality of the sampling protocol as presented in Dommergue et al. (2019)18. PDD is a mid-93
altitude (+ 1465 m) site surrounded by croplands, an urban area (Clermont-Ferrand) and 94
forests within a 50 km perimeter (Fig. 1). Monthly NASA satellite images of puy de Dôme 95
surrounding surfaces (https://wvs.earthdata.nasa.gov/) are shown in Fig. S1. The Atlantic 96
coast and Mediterranean Sea are at around 320 km and 240 km from PDD, respectively. 97
98 99 100
5 101
Fig. 1. Geographical location and landscape of the sampling site. Map showing the 102
location of the puy de Dôme mountain in France and relative surfaces types surrounding the 103
site in a perimeter of 50 km based on the MODIS satellite images. Cropland and vegetation 104
areas comprise > 80% of the surrounding landscapes, while forest and urban areas (mainly 105
Clermont-Ferrand) comprise < 20% of the surrounding landscapes. 106
107 108
DNA extraction 109
We extracted DNA from 3 punches (diameter of one punch: 38 mm) from the quartz fiber 110
filters using the DNeasy PowerWater kit with some modifications as detailed in Dommergue 111
et al. (2019)18. During cell lysis, an one hour heating step at 65°C followed by a 10-min 112
vortex treatment at maximum speed and a centrifugation using a syringe to separate the filter 113
debris from the lysate were added to the DNeasy PowerWater DNA extraction protocol18. 114
DNA concentration was measured using the High Sensitive Qubit Fluorometric 115
Quantification (Thermo Fisher Scientific) then stored at -20°C. 116
117
Real-Time qPCR analyses 118
6 The bacterial cell concentration was approximated by the number of 16S rRNA gene copies 119
per cubic meter of air and the fungal cell concentration was approximated by the number of 120
18S rRNA gene copies per cubic meter of air. Primers and methodology are presented in 121
Tignat-Perrier et al. (2019)1. 122
123
MiSeq Illumina amplicon sequencing 124
16S rRNA gene sequencing: library preparation, reads quality filtering and taxonomic 125
annotation. The V3-V4 region of the 16S rRNA gene was amplified and libraries were 126
prepared as presented in Tignat-Perrier et al. (2019)1. The amplicons were sequenced by 127
paired-end MiSeq sequencing using the V3 Illumina technology with 2 x 250 cycles. Reads 128
were filtered based on quality using FASTX-Toolkit
129
(http://hannonlab.cshl.edu/fastx_toolkit/), assembled using PANDAseq19, and annotated using 130
RDP Classifier20 and the RDP 16srRNA database as detailed in Tignat-Perrier et al. (2019)1. 131
RDP classifier was used in part to avoid errors due to sequence clustering. The number of 132
sequences per sample and the percentage of sequences annotated at the genus level were 133
evaluated using a home-made R script. The sequences annotated as chloroplasts by RDP were 134
manually removed. 135
ITS rRNA gene sequencing: library preparation, reads quality filtering and taxonomic 136
annotation. The ITS2 region of the ITS was amplified libraries were prepared as presented in 137
Tignat-Perrier et al. (2019)1. The amplicons were sequenced by a paired-end MiSeq 138
sequencing using the technology V2 of Illumina with 2 x 250 cycles. Reads were filtered 139
based on quality using FASTX-Toolkit, assembled using PANDAseq, and annotated at the 140
species level21 using RDP Classifier and the RDP fungallsu database as detailed in Tignat-141
Perrier et al. (2019)1. The number of sequences per sample and the percentage of sequences 142
annotated at the species level were evaluated using a home-made R script. 143
7 The number of reads per sample and per sequencing (V3-V4 regions of the 16S rRNA gene 144
and the ITS2 region of the ITS) is presented in the Table S1. Samples with less than 6000 145
reads were removed. Samples from the same season were pooled and rarefaction curves per 146
season were done (Fig. S2). 147
148
Estimation of the trophic mode of the fungal species 149
We used the FUNGuild software22 to assign the trophic mode of the fungal species (RDP 150
classifier based annotation). Fungal species annotated to a trophic mode with the level 151
confidence “Possible” were grouped in the “not classified” fungi. Then, we calculated the 152
percentage represented by each trophic mode per sample. Heatmaps were done using the R 153 package gplots. 154 155 Chemical analyses 156
The elemental carbon (EC), organic carbon (OC), sugar anhydrides and alcohols 157
(levoglucosan, mannosan, galactosan, inositol, glycerol, erythriol, xylitol, arabitol, sorbitol, 158
mannitol, trehalose, rhamnose, glucose, fructose and sucrose), soluble anions (MSA, SO42-, 159
NO3-, Cl-, Ox) and cations (Na+, NH4+, K+, Mg2+, Ca2+) concentrations were analyzed as 160
presented in Dommergue et al. (2019)18. 161
162
Meteorological data 163
Meteorological parameters such as wind speed and direction, temperature, relative humidity 164
and UV were collected (Vaisala instrument). For each sample, the backtrajectories of the air 165
masses were calculated over 3 days before the sampling using HYSPLIT23 (maximum height 166
above ground level: 1 km). 167
8 Graphical and Statistical analyses
169
Environmental variables. For chemical species, air concentrations in ng per cubic meter of air 170
were used in the analyses. The chemical table was log10-transformed to approach a Gaussian 171
distribution (verified on a Q-Q plot and tested using the Shapiro-Wilk test), and a hierarchical 172
cluster analysis (average method) was done on the Euclidean distance matrix using the vegan 173
and ade4 R packages. Meteorological data were used to do the wind roses using the openair R 174
package24. Backtrajectories of the air masses over three days were plotted on maps using the 175
openair R package, and the relative surfaces of the landscapes (MODIS land surfaces) air 176
masses over flown were calculated. 177
Diversity statistics and Multivariate analyses. Before doing the multivariate analyses, the raw 178
abundances of the taxa (bacterial genera and fungal species) were transformed into relative 179
abundances to counter the heterogeneity in the number of sequences per sample. A 180
hierarchical cluster analysis (average metric) on the Bray-Curtis dissimilarity matrix was done 181
using the vegan and ade4 R packages25. We have defined the seasons as following: we 182
adjusted the beginning and ending administrative dates of the seasons (i.e. summer: 20th of 183
June to 22th of September; autumn: 23th of September to 21th of December; winter: 22th of 184
December to 19th of March; spring: 20th of March to 19th of June) based on the weekly mean 185
temperature (Fig. S3). France goes through a cycle of four strong seasons characterized by 186
distinctive weather: the summer is characterized by higher temperatures, a longer daylight 187
period and the period of fructification of fruiting plants; the autumn is the harvest period of 188
most annual crops and a preparation period for dormancy; winter is characterized by the 189
lowest temperatures, frequent precipitation (rain and snow) and high air humidity; and finally 190
the spring is characterized by milder weather, snow melting, budding and flowering. To 191
access the variability of microbial population structure within the seasons, we averaged the 192
degrees of dissimilarity obtained from the Bray-Curtis matrix for each pair of samples from 193
9 the same season, subtracted these values from 1 to get similarity values and divided the 194
similarity values by the standard deviation (as detailed in Tignat-Perrier et al., 20191). 195
Spearman correlations were calculated to test the correlation between microbial abundance 196
and richness and quantitative environmental factors using the Hmisc R package26. ANOVA 197
analyses were used to test the influence of qualitative factors such as season and year on both 198
bacterial and fungal abundance and richness using the vegan R package, followed by 199
TukeyHSD tests to identify which group revealed a significantly different mean. A distance-200
based redundancy analysis (RDA – linear or non-linear correlation) was carried out to 201
evaluate the part of the variance between the samples explained by the seasons, chemistry 202
and/or meteorology, and an ANOVA was carried out to test each variable using the vegan and 203
ade4 R packages. Venn diagrams using the R package VennDiagram were done to access the 204
shared and unique bacterial genera and fungal species from each season after rarefaction on 205
the raw abundances (rarefaction at the minimum number of reads). A Mantel test between the 206
Bray-Curtis matrices based on the bacterial genera and fungal species was used to evaluate 207
similarities in the distribution of the samples. A Mantel test was done between the Bray-Curtis 208
matrix based on either the bacterial or the fungal diversity and the Euclidean distance matrix 209
based on the chemical variables or meteorology to evaluate the similarities in the distribution 210 of the samples. 211 212 213 Results 214
Temporal distribution of airborne microbial communities 215
Airborne microbial abundance. Airborne bacterial and fungal concentrations (estimated by 216
the number of 16S rRNA and 18S rRNA gene copies) were positively correlated (r=0.77, 217
pvalue=7.9×10⁻¹¹) and varied between 1.8×10³ and 2.1×10⁷ cells per cubic meter of air and 3 218
10 and 1.0×10⁵ cells per cubic meter of air, respectively. Neither bacteria nor fungal abundance 219
significantly varied with season (pvalues=0.20 and 0.38, respectively), but the highest 220
concentrations observed occurred in spring and summer for both bacteria and fungi (Table 1 221
and Fig. S4). 222
223
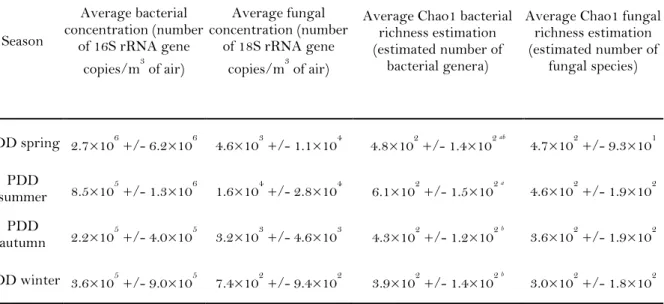
Table 1. Microbial concentration and richness estimations depending on the season. 224
Concentrations of bacterial and fungal ribosomal gene copies and associated richness (number 225
of bacterial genera and fungal species) averaged for each season and relative standard 226
deviation. Reference letters indicate the group membership based on Tukey’s HSD post hoc 227
tests (done only for the estimated bacterial richness as the ANOVA showed differences 228
between the groups). 229 Season Average bacterial concentration (number of 16S rRNA gene copies/m3 of air) Average fungal concentration (number of 18S rRNA gene copies/m3 of air)
Average Chao1 bacterial richness estimation (estimated number of
bacterial genera)
Average Chao1 fungal richness estimation (estimated number of fungal species) PDD spring 2.7×10⁶ +/- 6.2×10⁶ 4.6×10³ +/- 1.1×10⁴ 4.8×10² +/- 1.4×10² ab 4.7×10² +/- 9.3×101 PDD summer 8.5×10⁵ +/- 1.3×10⁶ 1.6×10⁴ +/- 2.8×10⁴ 6.1×10² +/- 1.5×10² a 4.6×10² +/- 1.9×10² PDD autumn 2.2×10⁵ +/- 4.0×10⁵ 3.2×10³ +/- 4.6×10³ 4.3×10² +/- 1.2×10² b 3.6×10² +/- 1.9×10² PDD winter 3.6×10⁵ +/- 9.0×10⁵ 7.4×10² +/- 9.4×10² 3.9×10² +/- 1.4×10² b 3.0×10² +/- 1.8×10² 230
Airborne microbial richness. The observed richness varied between 150 and 674 genera of 231
bacteria, and 84 and 649 species of fungi. The estimated richness (Chao1) varied between 234 232
and 897 bacterial genera and 97 and 820 fungal species. The estimated bacterial richness was 233
higher in summer compared to winter and autumn (pvalue=4.5×10⁻⁴; Table 1). The estimated 234
fungal richness also was highest in summer, while not significant due to relatively higher 235
11 variability (pvalue=0.18; Table 1). A rough correlation was found between the estimated 236
richness estimations and concentration estimations for both bacteria and fungi (r=0.41, 237
pvalue=3.0×10⁻³ and r=0.50, pvalue=4.6×10⁻⁴, respectively). 238
Consistently with highest richness, summer had the highest percentage of unique bacterial 239
genera (16% or 198/1239 of the genera in summer were only present in this season), followed 240
by autumn (4.5% or 39/873), spring (4.4% or 42/953) and winter (4.3% or 37/864) (Fig. S5). 241
This was also observed for unique fungal species with the highest percentage observed in 242
summer (28.4% or 457/1606), followed by autumn (17.4% or 191/1097), spring (14.4% or 243
172/1196) and winter (8% or 63/786) (Fig. S5). The majority of the bacterial genera and 244
fungal species observed was present throughout the year, (i.e. they were shared by all the 245
seasons; Fig. S5). 246
The five most abundant bacterial genera were Bacillus (15.6% in average) (Firmicutes), 247
Hymenobacter (9.2%) (Bacteroidetes), Sphingomonas (7.4%) (Alphaproteobacteria), 248
Methylobacterium (5.1%) (Alphaproteobacteria) and Thermoactinomyces (4.6%) 249
(Firmicutes). Their relative abundance varied over the year: Bacillus was abundant throughout 250
the year and dominated the community from summer to spring, while Hymenobacter 251
increased in autumn and winter (19.2% and 13.9% respectively). The twenty-five most 252
abundant bacterial genera and fungal species observed in each season are listed in Table S2. 253
In fungi, the five most abundant species were Pseudotaeniolina globosa (11.5% in average), 254
Cladophialophora proteae (7.9%), Alternaria sp. BMP_2012 (4%), Cladophialophora 255
minutissima (4%) and Naevala minutissima (3.1%). Similar to bacteria, their relative 256
abundance varied seasonally: Cladophialophora proteae represented 13.3% of the community 257
in winter and only 0.3% in summer, when Alternaria dominated (10.8%); autumn was 258
dominated by Pseudotaeniolina globosa and Cladophialophora proteae (16.4% and 15.6%, 259
12 respectively), while Naevala minutissima was detected only in spring and summer, 260
dominating in spring (10.1%). 261
Airborne microbial structure. The hierarchical cluster analyses of the samples based on both 262
the bacterial (genus level) and fungal (species level) community structures are shown in Fig. 263
2; these were highly similar (r=0.50 and pvalue<0.001). The samples tended to group by 264
season (anosim r=0.30 and r=0.49 with pvalues=0.001 for bacterial and for fungal 265
communities, respectively; Fig. 2) with season explaining 17% and 22% of the variability in 266
the community structures, respectively (pvalues=0.001). The distribution of the summer 267
samples based on fungal species was different between 2016 and 2017 (pvalue=0.001). The 268
intraseasonal variability in community structure was greatest in spring and smallest in 269
summer for bacteria and conversely greatest in autumn and smallest in winter for fungi 270
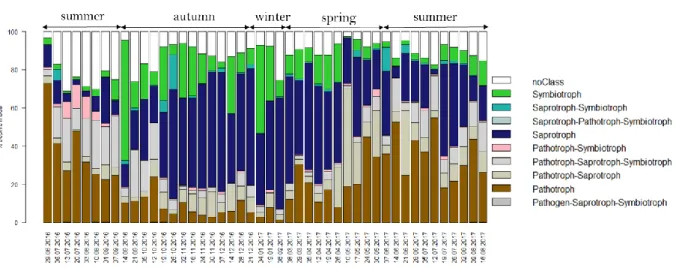
(Table S3). The relative abundances of fungal saprotrophs and symbiotrophs (like Balospora 271
myosura, Strobilurus albipilatus, Pseudotaeniolina globosa) (Fig. 3) were greater in autumn 272
and winter than during the rest of the year (pvalue=4.3×10⁻⁵ and 0.5 for saprotrophs and 273
symbiotrophs, respectively). The relative abundance of fungal pathotrophs was greater in the 274
spring and summer periods (pvalue=0.51 – Fig. 3). Examples of phytopathogens increasing in 275
relative abundance during the summer and/or spring are Mycosphaerella graminicola (wheat 276
plant pathogen – Fig. S6), Microdochium majus (cereal pathogen – Fig. S6), Blumeria 277
graminis (powdery mildew pathogen – Fig. S6), Ustilago hordei (maize pathogen – Fig. S6), 278
Botryotinia fuckeliana (gray mold disease) and Erysiphe alphitoides (powdery mildew on oak 279
trees). However, the number of fungal species associated to pathogenic and saprophytic 280
trophic modes was greatest in spring and summer, whereas symbiotrophs were mostly found 281
in summer and autumn (Table S4). 282
13 284
285
286
Fig. 2. Distribution of the samples based on the microbial community structure. 287
Hierarchical cluster analysis (average method) of airborne community structures of bacteria 288
(16S rRNA gene – a.) and fungi (ITS region – b.) based on Bray-Curtis dissimilarity matrices. 289
The season corresponding to each sample is indicated as a frieze (black=winter, 290
blue=summer, green=spring and brown=autumn) that has been split into three based on the 291
three major clusters observed on the hierarchical cluster analyses. 292
14 294
Fig. 3. Distribution of the trophic modes of the fungal species identified. Each fungal 295
species detected was associated to either a specific trophic mode, different trophic modes or 296
no trophic mode (« noClass ») using the FUNGuild software, then the proportions of species 297
belonging to each trophic mode were summed. 298
299 300
When looking at the fifty most abundant bacterial genera and fungal species of the dataset that 301
mainly controlled the distribution of the samples based on the microbial community structure 302
(they represented 79.6% or 881898 sequences/1107323 and 71.8% or 367440 303
sequences/511738 of all the bacterial and fungal sequences, respectively), we observed three 304
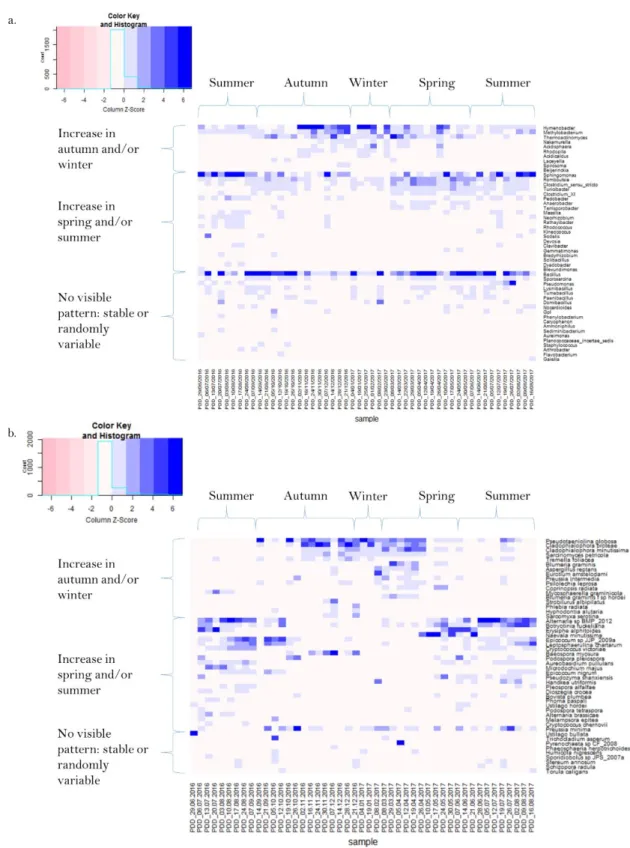
different patterns in the temporal variation of their relative abundance (Fig. 4 and 5). The 305
period during which the relative abundance increased varied in length and depended on the 306
microorganism. First, some taxa were mostly abundant during the cold period of the year: 307
20% (10/50) of the bacterial genera and 34% (17/50) of the fungal species showed a higher 308
relative abundance in winter and/or autumn compared to the other seasons. This was the case 309
with Hymenobacter and Pseudotaeniolina proteae for example, whose relative abundances 310
suddenly increased between November 2016 and February 2017, and between October 2016 311
and April 2017, respectively (Fig. 4a). Fungal taxa belonging to this group were almost 312
15 exclusively saprotroph and/or pathotroph (Table S5). Second, some taxa were mostly 313
abundant during summer and/or spring: 42% (21/50) of the bacterial genera and 46% (23/50) 314
of the fungal species. For example, Sphingomonas and Alternaria sp. BMP_2012 relative 315
abundances started to decrease in late summer/early autumn and increased again in the late 316
spring (Fig. 4b). Fungal taxa belonging to this group were pathotroph, symbiotroph or 317
saprotroph (Table S5). Finally, some taxa had no clear pattern in their relative abundance (i.e. 318
stable or randomly variable over the year): 38% (19/50) of the bacterial genera and 20% 319
(10/50) of the fungal species (e.g., Bacillus and Phaeosphaeria herpotrichoides) (Fig. 4c). 320
Fungal taxa belonging to this group were mostly saprotroph (Table S5). 321
16 323
324
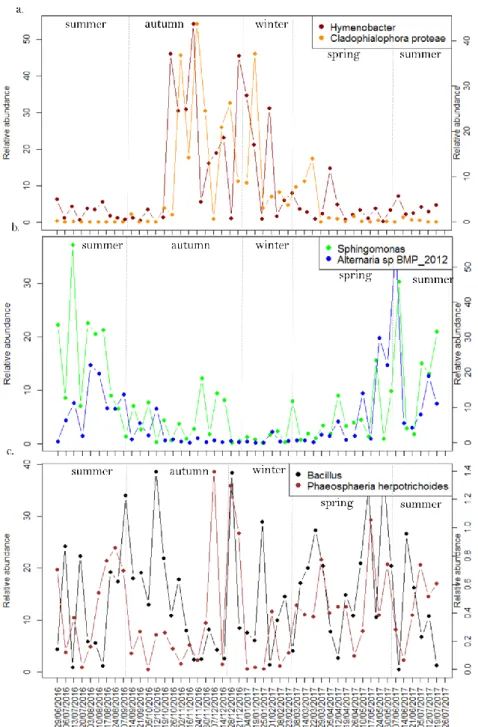
Fig. 4. Temporal evolution of the relative abundance of several fungal species and 325
bacterial genera among the airborne communities over the year. 326
a) Higher relative abundance in autumn and winter: examples of the fungal species 327
Cladophialophora proteae (right y scale) and the bacterial genus Hymenobacter (left y 328
scale); 329
17 b) Higher relative abundance in spring and summer: examples of the fungal species 330
Alternaria sp. BMP 2012 (right y scale) and the bacterial genus Sphingomonas (left y 331
scale); 332
c) No trend of the relative abundance over the year: examples of the fungal species 333
Phaeosphaeria herpotrichoides (right y scale) and the bacterial genus Bacillus (left y 334 scale). 335 336 337 338
18 339
Fig. 5. Temporal evolution of the relative abundances of the dominant microbial taxa. 340
Heatmaps showing the temporal evolution of the relative abundances (centered and scaled) of 341
the fifty most abundant bacterial genera (a.) and fungal species (b.) in the dataset. The 342
microbial taxa are grouped based on the three general trends exemplified in Fig. 4. 343
19 344
345
Atmospheric PM10 chemistry 346
The hierarchical cluster analysis of the samples based on the PM10 chemical profile is shown 347
in Fig. S7. Chemical concentrations varied significantly with season (pvalues<0.05) for all the 348
compounds measured except Cl-, NO3-, NH4+ and rhamnose (pvalues>0.05) (Table S6). 349
Seasons explained 38% of the variance in the distribution of the samples based on the 350
chemical composition (pvalue=0.001). When looking at the weekly variation of the 351
concentrations of the different compounds, we observed general trends of seasonal variations 352
(as observed for microbial communities). Some increased during autumn/winter compared to 353
spring/summer (galactosan, levoglucosan and mannosan), while some others decreased 354
(erythriol, glucose, trehalose, sorbitol, xylitol, inositol, SO42-, OC, MSA) (Fig. S8). The 355
sample distribution based on bacterial and fungal community structures were correlated to 356
their distribution based on the overall PM10 chemistry (Mantel test r=0.25 pvalue=0.001 and 357
0.41 pvalue=0.001, respectively) (see RDA analyses in Fig. S9). Specific chemical 358
compounds were the main contributors to these correlations (i.e. the polyols, MSA and Na+ 359
for the fungal communities, and organic carbon, Na+, Cl- and erythriol for the bacterial 360
communities). Consistent with seasonal patterns observed for both microbial community 361
structures and chemical composition, we observed strong positive and negative correlations 362
between the concentration of some chemical compounds and the relative abundances of 363
bacterial genera or fungal species. For examples, mannitol-arabitol and Alternaria sp. 364
BMP_2012 (r=0.73 and pvalue=4.8×10⁻⁹) and mannitol-arabitol and Pseudotaeniolina 365
globosa (r=-0.66 and pvalue=5.6×10⁻⁷)(Table S7). 366
367
Weather characteristics: local meteorology and air mass geographical origin 368
20 Temperature, wind speed and UV radiation (weekly averages) varied over the year 369
(pvalue<0.05), conversely to wind direction and relative humidity. The mean weekly 370
temperature varied between -5.5°C and 17.6°C (Fig. S3) and was significantly correlated to 371
the season (pvalue=1.4×10⁻¹¹ – Fig. S10). Wind speed varied between 2.8 and 13.5 m/s on 372
average, and this was significantly higher in winter compared to summer and spring 373
(pvalue=2.1×10⁻³, Fig. S10), and significantly more variable in winter compared to the other 374
seasons (pvalue=5.4×10⁻⁴). Wind speed and direction were positively correlated (r=0.44, 375
pvalue=0.001) with stronger winds coming from West. Nevertheless, the mean wind direction 376
was not significantly different between seasons (pvalue=0.11) and the air mass origins were 377
only partially correlated to the seasons (16% and 14% of the variance explained, 378
pvalue=0.013). The wind roses and the backtrajectory density plots for each season are 379
presented in Fig. S10 and Fig. S11. The seasonal weekly variability in wind conditions, 380
temperature and relative humidity are shown in Table S3. 381
Bacterial concentration correlated best with UV radiation (r=0.38, pvalue=5.4x10⁻³) and 382
fungal concentration correlated best with temperature (r=0.38, pvalue=5.6×10⁻³) (Table S8). 383
A significant and strong correlation was also found between both the bacterial and fungal 384
community structures and the overall meteorology (i.e. temperature, relative humidity, wind 385
direction and speed) (r=0.57 pvalue=0.001 and r=0.48 pvalue=0.001). Bacterial richness was 386
strongly correlated with temperature (r=0.52, pvalue=7.7×10⁻⁵) while fungal richness best 387
correlated with wind direction (r=0.50, pvalue=4.6×10⁻⁴) (Table S8). 388
389
Discussion 390
Seasonal variation in airborne microbial community composition due to changes in local 391
landscapes 392
21 Previous investigations of the temporal variations of airborne microbial communities have 393
consistently shown a seasonal shift in both cell concentration and community structure2,9–12. 394
This was explained mainly by changes in the surrounding landscape condition10,11,27 (e.g., 395
vegetation in summer, snow cover in winter etc.), local meteorology2,9 and/or the origin of the 396
air masses (i.e. changes in the global air circulation)9. Our data showed that seasonality was 397
correlated to the temporal distribution of airborne microbial community structure at puy de 398
Dôme. With these results, we demonstrated the importance of local regional sources (i.e. 399
within 50 km) even at relatively elevated sites such as puy de Dôme. Puy de Dôme is mainly 400
surrounded by croplands and/or natural vegetation (> 80% of the surface within a 50 km 401
perimeter based on MODIS satellite images; Fig. 1) that undergo strong changes over the year 402
at such latitudes (see puy de Dôme monthly satellite images in Fig. S1 for an overview). 403
These changes are partly associated with crops (mainly wheat and grain maize) and vegetation 404
that cycle through their different phases on an annual basis. Changes in landscape 405
characteristics are themselves under direct influence of climatic conditions, including 406
precipitation rate, temperature and sunlight exposure. This consequently has a critical 407
influence on the surface microbial communities28,29. Over the year, different microorganisms 408
with different trophic modes were likely aerosolized (Fig. 3). Fungal phytopathogens (like 409
Ustilago hordei) and leaf-associated fungi (like Naevala minutissima) increased in relative 410
abundance during the spring and summer periods when the crop plants grew and trees were 411
green; while saprotrophs (like Cladophialora protea) increased in relative abundance during 412
the autumn and winter periods after crop harvesting and when dead and decomposing 413
biological material covered terrestrial surfaces. Similar to fungi, soil-associated bacterial taxa 414
(like Hymenobacter) were observed in higher relative abundance in autumn and winter and 415
bacterial phytopathogens and leaf-associated bacteria (like Sphingomonas) were observed in 416
higher relative abundance in spring and summer. The three general trends (i.e. an increase of 417
22 specific taxa in autumn/winter; an increase of other taxa in summer/spring; stable or randomly 418
variable microbial taxa over the year – Fig. 4) might have driven the distribution of the 419
samples based on both the airborne bacterial and fungal community structures in two major 420
clusters (i.e. an autumn/winter cluster versus a spring/summer cluster observed in Fig. 2). In 421
addition, the period during which we observed an increase in the relative abundance of a 422
winter or summer-associated microbial taxon varied in length and might have been specific to 423
the life strategy of the given taxon. Microbial taxa whose relative abundance remained stable 424
or varied randomly over the year might partly belong to taxa associated to decomposing 425
matter (the trophic mode of all the fungal taxa present in this group was saprotroph) that is 426
present the whole year. Airborne fungal community structure showed a stronger seasonal 427
variation than bacterial community structure did, likely related to a higher number of fungal 428
taxa showing a seasonal pattern as compared to bacterial taxa (40/50 and 31/50 for fungi and 429
bacteria, respectively). The stronger seasonal shift observed in airborne fungi might be 430
explained by a greater influence of vegetation on fungi as compared to bacteria30. 431
432
Role of local meteorology in the intraseasonal variability of airborne microbial community 433
composition 434
Local meteorology might also play a role in the temporal distribution of airborne microbial 435
communities at puy de Dôme especially on their intraseasonal variability. In a previous study 436
considering numerous sampling sites1, we highlighted the importance of local meteorology 437
(especially wind speed, wind direction and temperature variability over time) on the 438
variability of airborne microbial communities when the site was surrounded by a variety of 439
landscapes. Puy de Dôme is characterized by strong wind speeds and highly variable 440
meteorological conditions partly explained by its central position and its high elevation within 441
the Chaîne des Puys mountain range (+1465 m altitude above sea level and up to 500 m above 442
23 surrounding landscapes). The wind direction changed rapidly both within and between the 443
weeks. The relative humidity and temperature also showed a high variability within and 444
between the weeks within the same season (Table S3). While the correlation between 445
meteorological parameters and airborne microbial communities at puy de Dôme is mainly 446
explained by seasonality, local meteorological parameters might have also affected airborne 447
microbial structures by influencing the aerosolization process as discussed in Tignat-Perrier et 448
al. (2019)1. For example, specific temperatures might activate the sporulation of specific 449
fungi31. The high correlation observed between temperature and airborne bacterial richness 450
might be explained by the increased turbulence in air, a higher microbial diversity in the 451
sources (i.e. surrounding landscapes)32–35 as well as a drier surface favoring cell and biofilm 452
detachment. Wind parameters were the meteorological parameters that best correlated to 453
airborne fungal richness. Stronger winds are obviously more likely to aerosolize particles 454
from surfaces. 455
456
Minor contribution of distant sources in the temporal variation of airborne microbial 457
communities 458
Weekly averages of wind direction and origin of the air masses did not drastically change 459
throughout the seasons and were highly and randomly variable over the year (Fig. S10 and 460
S11). We did not observe correlations between airborne microbial community structure and 461
the origin of the air masses. In winter, during which free troposphere air masses, and thus 462
potentially long-range transport, have a larger influence36–38, the variability in the bacterial 463
community structure was not the highest. Marine air masses have been shown to prevail 464
(72%) during winter at puy de Dôme38. One sample showed an especially strong marine 465
signature in terms of chemistry (February 2nd, 2017). However, this sample has similar 466
proportion of marine bacterial genera (Corialomargarita, Rubritalea, Aquimarina) as other 467
24 samples. Whenever present, the identified specific marine bacterial genera were very rare 468
(they were represented by only 2 or 3 sequences over > 20000 sequences per sample). Unlike 469
previous suggestions for cloud water-associated microorganisms at this site, microbial 470
communities in the dry phase did not seem to mainly originate from oceanic sources27. Uetake 471
et al. (2019)2 investigated airborne (not cloud-associated) microbial communities in Tokyo 472
(Japan) over a year and also highlighted the absence of oceanic related bacteria (i.e. SAR 473
group, Oceanospirillales) that would have suggested transport of airborne microbial cells 474
from the Pacific Ocean to Tokyo. 475
We also observed a seasonal change in the particulate matter chemistry (PM10 chemistry) 476
(Fig. S7). At puy de Dôme, changes in PM10 chemistry throughout the seasons were 477
correlated to changes in air mass origins (local and distant) and changes in the vertical 478
stratification of the atmospheric layers (such as the increase of the height of the mixed layer in 479
summer)36,37. We observed specific and strong correlations between some chemical species 480
and microbial taxa (Table S7) and this could explain the overall correlation between the 481
overall PM10 chemistry and airborne microbial structure. In particular, we observed 482
correlations between specific microbial taxa and polyols. The concentration of atmospheric 483
polyols might be due to the presence of airborne green plant debris as well as specific 484
microbial taxa and especially fungal taxa which produce polyols39–42. Our sampling strategy 485
(one-week sampling) might not have been adapted to identify microbial long-range transport 486
events that, if they occurred, might have been greatly diluted by the local sources. 487
Investigations on the temporal variability of airborne microbial communities that concluded 488
the significant contribution of distant sources in the composition of airborne microbial 489
communities9,13 had either a different sampling strategy than ours (i.e. shorter sampling 490
duration such as 24 h9) or did not sample microorganisms of the dry phase of the 491
troposphere13. 492
25 493
494
Conclusion 495
We investigated changes in airborne microbial community concentration and structure at the 496
elevated continental site puy de Dôme in the Massif Central of France (+1465 m altitude 497
above sea level) as a function of the local meteorology and particulate matter chemistry. We 498
showed that puy de Dôme airborne microbial community structure likely shifted throughout 499
the year in relation to the seasonal changes in surface conditions of the surrounding landscape 500
of the mountain that was characterized mainly by croplands and natural vegetation. The 501
microbial taxa that drove the seasonal distribution of airborne microbial communities showed 502
different trends throughout the seasons depending on their trophic mode. Crop-associated 503
microorganisms and especially crop pathogens were in higher relative abundance in 504
spring/summer while soil-associated microorganisms and dead material-associated 505
microorganisms were found in higher relative abundance in autumn/winter. Changes in the 506
vertical stratification of the atmospheric layers throughout the seasons (such as the increase of 507
the height of the mixed layer in summer) might also play a role in the seasonal shift of puy de 508
Dôme airborne microbial communities. Within the different seasons, the temporal variability 509
observed in the composition of airborne microbial communities was likely associated to the 510
variable and windy meteorological conditions observed in puy de Dôme. 511
512
Acknowledgements 513
This program was funded by ANR-15-CE01-0002–INHALE, Région Auvergne-Rhône Alpes 514
and CAMPUS France. The chemical analyses were performed at the IGE AirOSol platform. 515
We thank L.Pouilloux for computing assistance and maintenance of the Newton 516
supercalculator. 517
26 518
Competing interests 519
The authors declare no competing interests. 520
521
Data availability 522
Sequences reported in this paper have been deposited in
ftp://ftp-adn.ec-523
lyon.fr/aerobiology_Puy-de-Dome_amplicon_INHALE/. A file has been attached explaining 524
the correspondence between file names and samples. 525
526
Author contribution 527
AD, PA, CL and TMV designed the experiment. PA, AT, MJ and KS conducted the sampling 528
field campaign. RTP did the molecular biology, bioinformatics and statistical analyses. RTP, 529
AD, CL, TMV analyzed the results. RTP, TM, AD, PA and CL wrote the manuscript. All 530
authors reviewed the manuscript. 531
532
References 533
1. Tignat-Perrier, R. et al. Global airborne microbial communities controlled by surrounding 534
landscapes and wind conditions. Sci Rep 9, 1–11 (2019). 535
2. Uetake, J. et al. Seasonal changes of airborne bacterial communities over Tokyo and influence of 536
local meteorology. bioRxiv 542001 (2019) doi:10.1101/542001. 537
3. Amato, P. et al. A fate for organic acids, formaldehyde and methanol in cloud water: their 538
biotransformation by micro-organisms. Atmospheric Chemistry and Physics 7, 4159–4169 (2007). 539
4. Vaïtilingom, M. et al. Contribution of Microbial Activity to Carbon Chemistry in Clouds. Appl 540
Environ Microbiol 76, 23–29 (2010). 541
5. Ariya, P. A., Nepotchatykh, O., Ignatova, O. & Amyot, M. Microbiological degradation of 542
atmospheric organic compounds. Geophysical Research Letters 29, 34-1-34–4 (2002). 543
27 6. Pöschl, U. et al. Rainforest Aerosols as Biogenic Nuclei of Clouds and Precipitation in the
544
Amazon. Science 329, 1513–1516 (2010). 545
7. Brown, J. K. M. & Hovmøller, M. S. Aerial dispersal of pathogens on the global and continental 546
scales and its impact on plant disease. Science 297, 537–541 (2002). 547
8. Mhuireach, G. Á., Betancourt-Román, C. M., Green, J. L. & Johnson, B. R. Spatiotemporal 548
Controls on the Urban Aerobiome. Front. Ecol. Evol. 7, (2019). 549
9. Innocente, E. et al. Influence of seasonality, air mass origin and particulate matter chemical 550
composition on airborne bacterial community structure in the Po Valley, Italy. Sci. Total Environ. 551
593–594, 677–687 (2017). 552
10. Bowers, R. M., McCubbin, I. B., Hallar, A. G. & Fierer, N. Seasonal variability in airborne 553
bacterial communities at a high-elevation site. Atmospheric Environment 50, 41–49 (2012). 554
11. Bowers, R. M. et al. Seasonal variability in bacterial and fungal diversity of the near-surface 555
atmosphere. Environ. Sci. Technol. 47, 12097–12106 (2013). 556
12. Franzetti, A., Gandolfi, I., Gaspari, E., Ambrosini, R. & Bestetti, G. Seasonal variability of 557
bacteria in fine and coarse urban air particulate matter. Appl. Microbiol. Biotechnol. 90, 745–753 558
(2011). 559
13. Cáliz, J., Triadó-Margarit, X., Camarero, L. & Casamayor, E. O. A long-term survey unveils 560
strong seasonal patterns in the airborne microbiome coupled to general and regional atmospheric 561
circulations. Proc. Natl. Acad. Sci. U.S.A. 115, 12229–12234 (2018). 562
14. Amato, P. et al. Metatranscriptomic exploration of microbial functioning in clouds. Sci Rep 9, 1– 563
12 (2019). 564
15. Amato, P. et al. Active microorganisms thrive among extremely diverse communities in cloud 565
water. PLOS ONE 12, e0182869 (2017). 566
16. Amato, P. et al. Survival and ice nucleation activity of bacteria as aerosols in a cloud simulation 567
chamber. Atmospheric Chemistry and Physics 15, 6455–6465 (2015). 568
17. Vaïtilingom, M. et al. Potential impact of microbial activity on the oxidant capacity and organic 569
carbon budget in clouds. PNAS 110, 559–564 (2013). 570
28 18. Dommergue, A. et al. Methods to investigate the global atmospheric microbiome. Front.
571
Microbiol. 10, (2019). 572
19. Masella, A. P., Bartram, A. K., Truszkowski, J. M., Brown, D. G. & Neufeld, J. D. PANDAseq: 573
paired-end assembler for illumina sequences. BMC Bioinformatics 13, 31 (2012). 574
20. Wang, Q., Garrity, G. M., Tiedje, J. M. & Cole, J. R. Naive Bayesian Classifier for Rapid 575
Assignment of rRNA Sequences into the New Bacterial Taxonomy. Applied and Environmental 576
Microbiology 73, 5261–5267 (2007). 577
21. Deshpande, V. et al. Fungal identification using a Bayesian classifier and the Warcup training set 578
of internal transcribed spacer sequences. Mycologia 108, 1–5 (2016). 579
22. Nguyen, N. H. et al. FUNGuild: An open annotation tool for parsing fungal community datasets 580
by ecological guild. Fungal Ecology 20, 241–248 (2016). 581
23. Draxler, R. R. & Hess, G. D. An Overview of the HYSPLIT_4 Modelling System for Trajectories, 582
Dispersion, and Deposition. 25. 583
24. Carslaw, D. Tools for the Analysis of Air Pollution Data. (2019). 584
25. Dray, S., Dufour, A.-B. & Thioulouse, J. Analysis of Ecological Data: Exploratory and Euclidean 585
Methodsin Environmental Science. (2018). 586
26. Harrell, F. E. & Dupont, C. Harrell Miscellaneous - Package ‘Hmisc’. (2019). 587
27. Amato, P. et al. An important oceanic source of micro-organisms for cloud water at the Puy de 588
Dôme (France). Atmospheric Environment 41, 8253–8263 (2007). 589
28. Zhang, Q. et al. Alterations in soil microbial community composition and biomass following 590
agricultural land use change. Scientific Reports 6, 36587 (2016). 591
29. Constancias, F. et al. Mapping and determinism of soil microbial community distribution across 592
an agricultural landscape. Microbiologyopen 4, 505–517 (2015). 593
30. Sun, S., Li, S., Avera, B. N., Strahm, B. D. & Badgley, B. D. Soil Bacterial and Fungal 594
Communities Show Distinct Recovery Patterns during Forest Ecosystem Restoration. Appl 595
Environ Microbiol 83, (2017). 596
31. Pickersgill, D. A. et al. Lifestyle dependent occurrence of airborne fungi. Biogeosciences 597
Discussions 1–20 (2017) doi:https://doi.org/10.5194/bg-2017-452. 598
29 32. Dennis, P. G., Newsham, K. K., Rushton, S. P., O’Donnell, A. G. & Hopkins, D. W. Soil bacterial 599
diversity is positively associated with air temperature in the maritime Antarctic. Sci Rep 9, 1–11 600
(2019). 601
33. Zhou, J. et al. Temperature mediates continental-scale diversity of microbes in forest soils. Nature 602
Communications 7, 12083 (2016). 603
34. Nottingham, A. T. et al. Microbes follow Humboldt: temperature drives plant and soil microbial 604
diversity patterns from the Amazon to the Andes. Ecology 99, 2455–2466 (2018). 605
35. Tittensor, D. P. et al. Global patterns and predictors of marine biodiversity across taxa. Nature 606
466, 1098–1101 (2010). 607
36. Venzac, H., Sellegri, K., Villani, P., Picard, D. & Laj, P. Seasonal variation of aerosol size 608
distributions in the free troposphere and residual layer at the puy de Dôme station, France. 609
Atmospheric Chemistry and Physics 9, 1465–1478 (2009). 610
37. Bourcier, L., Sellegri, K., Chausse, P., M. Pichon, J. & Laj, P. Seasonal variation of water-soluble 611
inorganic components in aerosol size-segregated at the puy de Dôme station (1,465 m a.s.l.), 612
France. Journal of Atmospheric Chemistry 69, (2012). 613
38. Freney, E. J. et al. Seasonal variations in aerosol particle composition at the puy-de-Dôme 614
research station in France. Atmospheric Chemistry and Physics 11, 13047–13059 (2011). 615
39. Medeiros, P. M., Conte, M. H., Weber, J. C. & Simoneit, B. R. T. Sugars as source indicators of 616
biogenic organic carbon in aerosols collected above the Howland Experimental Forest, Maine. 617
Atmospheric Environment 40, 1694–1705 (2006). 618
40. Ruijter, G. J. G. et al. Mannitol Is Required for Stress Tolerance in Aspergillus niger 619
Conidiospores. Eukaryot Cell 2, 690–698 (2003). 620
41. Solomon, P. S., Waters, O. D. C. & Oliver, R. P. Decoding the mannitol enigma in filamentous 621
fungi. Trends Microbiol. 15, 257–262 (2007). 622
42. Lewis, D. H. & Smith, D. C. Sugar alcohols (polyols) in fungi and green plants. New Phytologist 623
66, 143–184 (1967). 624
30 626