HAL Id: hal-00853108
https://hal.inria.fr/hal-00853108
Submitted on 21 Aug 2013HAL is a multi-disciplinary open access
archive for the deposit and dissemination of sci-entific research documents, whether they are pub-lished or not. The documents may come from teaching and research institutions in France or abroad, or from public or private research centers.
L’archive ouverte pluridisciplinaire HAL, est destinée au dépôt et à la diffusion de documents scientifiques de niveau recherche, publiés ou non, émanant des établissements d’enseignement et de recherche français ou étrangers, des laboratoires publics ou privés.
Implications of Inconsistencies between fMRI and dMRI
on Multimodal Connectivity Estimation
Bernard Ng, Gaël Varoquaux, Jean-Baptiste Poline, Bertrand Thirion
To cite this version:
Bernard Ng, Gaël Varoquaux, Jean-Baptiste Poline, Bertrand Thirion. Implications of Inconsistencies between fMRI and dMRI on Multimodal Connectivity Estimation. MICCAI - 16th International Conference on Medical Image Computing and Computer Assisted Intervention - 2013, Kensaku Mori, Sep 2013, Nagoya, Japan. �hal-00853108�
adfa, p. 1, 2011.
© Springer-Verlag Berlin Heidelberg 2011
Implications of Inconsistencies between fMRI and dMRI
on Multimodal Connectivity Estimation
Bernard Ng1,2, Gael Varoquaux1, Jean Baptiste Poline1, and Bertrand Thirion1 1Parietal team, Neurospin, INRIA Saclay, France
2FIND Lab, Stanford University, United States
Abstract. There is a recent trend towards integrating resting state functional
magnetic resonance imaging (RS-fMRI) and diffusion MRI (dMRI) for brain connectivity estimation, as motivated by how estimates from these modalities are presumably two views reflecting the same underlying brain circuitry. In this paper, we show on a cohort of 60 subjects that conventional functional tivity (FC) estimates based on Pearson’s correlation and anatomical connec-tivity (AC) estimates based on fiber counts are actually not that highly corre-lated for typical RS-fMRI (~7 min) and dMRI (~32 gradient directions) data. The FC-AC correlation can be significantly increased by considering sparse partial correlation and modeling fiber endpoint uncertainty, but the resulting FC-AC correlation is still rather low in absolute terms. We further exemplify the inconsistencies between FC and AC estimates by integrating them as priors into activation detection and demonstrating significant differences in their de-tection sensitivity. Importantly, we illustrate that these inconsistencies can be useful in fMRI-dMRI integration for improving brain connectivity estimation.
Keywords: brain activation, connectivity, dMRI, fMRI, multimodal integration
1
Introduction
Recently, there is a growing interest in integrating resting state functional magnetic resonance imaging (RS-fMRI) and diffusion MRI (dMRI) for brain connectivity esti-mation [1, 2]. This is motivated by how connectivity inferred from these modalities are presumably two views resembling the same underlying wiring structure of the brain. To enable meaningful integration, it is important to understand the relationships between brain function and structure and the degree to which these relationships are reflected by the connectivity estimates derived from RS-fMRI and dMRI data. A number of studies suggest a strong positive correlation between RS-fMRI and dMRI connectivity estimates [3-5], but it is unclear how much this correlation depends on the data acquisition and analysis methods.
Pearson’s correlation is, by far, the most widely-used estimate of functional con-nectivity (FC) for RS-fMRI studies. Due to confounds, such as head motions, scanner noise, and physiological artefacts, as well as the typically small sample size as limited by data acquisition rate of standard pulse sequences, Pearson’s correlation is subject
to a high degree of estimation error [6]. Also, Pearson’s correlation cannot distinguish direct from indirect connections, which complicates connection structure identifica-tion [6]. As for inferring anatomical connectivity (AC) from dMRI data, fiber count and the average fractional anisotropy (FA) along fiber tracts between pairs of brain areas are typically used as estimates [7]. Approaches for estimating the probability of diffusion between brain area pairs have been put forth [7], but do not scale well com-putationally to whole-brain analysis. In general, the fundamental limitations of fiber tractography pose great challenges to accurate AC estimation [7], especially when applied to typical dMRI data with limited number of gradient directions due to acqui-sition time restrictions. Besides the problem of crossing fibers, which harms the accu-racy of the fiber tracts’ trajectories, the location of the fiber endpoints holds high un-certainty, since the diffusion orientation is ambiguous near white-gray matter inter-face and tractography often terminates before reaching gray matter tissues [7].
In this paper, we assess the impact of the aforementioned limitations in data acqui-sition and analysis techniques on the consistency of FC and AC estimates. On typical RS-fMRI (~7 min) and dMRI (32 gradient directions) data collected from a cohort of 60 subjects, we take the correlation between conventional FC and AC estimates based on Pearson’s correlation and fiber count as baseline, and examine the effects of using sparse partial correlation [8] as the FC estimate, which controls for estimation errors and reduces indirect influences. We also propose a simple post-processing scheme for modeling fiber endpoint uncertainty and examine its influence on the FC-AC correla-tion. These comparisons are performed to determine whether and to what extent methodological improvements can compensate for limitations in data acquisition. In addition, we describe how these FC and AC estimates can be meaningfully incorpo-rated as priors for task activation detection to further evaluate their consistency. The implications of combining the FC and AC estimates are also explored.
2
Methods
In this work, we are interested in contrasting Pearson’s correlation against sparse partial correlation as FC estimates (Section 2.1) and examining the effects of model-ing the uncertainty in fiber endpoint location when estimatmodel-ing AC (Section 2.2). Con-sistency between various FC and AC estimates is evaluated based on their correlation and their impact as priors on task activation detection (Section 2.3).
2.1 Functional Connectivity Estimation
Pearson’s correlation. Let Z be a t×d matrix with normalized RS-fMRI time courses
(i.e. demeaned with unit standard deviation) of d brain areas along the columns. The Pearson’s correlations between all brain area pairs are given by: C = ZTZ/(t ̶ 1). For typical RS-fMRI data, t < d, thus C will contain high estimation errors [6]. Also, ele-ments in C are assumed independent from each other, which renders separation of direct connections from indirect connections impossible [6]. These limitations can be alleviated by adopting sparse partial correlation as an FC estimate, as discussed next.
Sparse partial correlation. Given a d×d empirical covariance matrix, S, computed
from samples drawn from a centered multivariate Gaussian distribution, we can esti-mate a well-conditioned sparse invariance covariance matrix, Λˆ, by minimizing the negative log-likelihood over the space of positive definite matrices, Λ > 0, and impos-ing an l1 penalty on the off diagonal elements of Λ [8]:
1
0 ( ) logdet( )
min SΛ Λ Λ
Λ tr . (1)
Sparse partial correlation, Γˆ, can then be computed by applying a simple normaliza-tion on Λˆ: ΓˆijΛˆij ΛˆiiΛˆ jj for i ≠ j and Γˆ = 1 for i = j. The level of sparsity ij
on Λˆ is governed by λ, which we select using a refined grid search strategy combined with cross-validation as in [1]. (1) can be efficiently solved using e.g. the QUadratic Inverse Covariance (QUIC) algorithm [8]. In the context of FC estimation, S corre-sponds to C of a given subject. We highlight that enforcing sparsity serves the dual purpose of controlling for estimation errors and imposing our prior knowledge that the connection structure of the brain is sparse [1]. Also, partial correlation provides a measure of connectivity between two brain areas with the effects from all other brain areas partialled out, thus discriminates direct connections from indirect connections.
2.2 Anatomical Connectivity Estimation
The fiber count between a pair of brain areas is widely-used as an estimate of AC, since this measure presumably reflects the anatomical capacity for functional interac-tions. This AC estimate requires the fiber tracts to terminate in gray matter brain ar-eas. For terminating a fiber tract, low FA (e.g. 0.15) and large curvature (e.g. 45o) are typically used as the criteria [7]. Although gray matter tissues have relatively lower FA than white matter tissues, voxels containing crossing fibers or near white-gray matter boundaries also have low FA. Thus, fiber tracts might not necessarily termi-nate in gray matter voxels. One simple way to deal with this limitation is to extrapo-late along the tangent direction of the fiber endpoints (e.g. < 10 mm from the end-points) until the fiber tracts reach a gray matter voxel (Fig. 1(a), option 2). However, the location of the resulting endpoints could very well be incorrect, especially if the original fiber endpoints are near gyri (Fig. 1(a)) [7]. In fact, the restriction on curva-ture during tractography would bias fiber tracts towards option 2 in Fig. 1(a) if track-ing is not prematurely terminated by low FA [7].
To model the uncertainty in fiber endpoint location, we propose the following schem: Let ωp be a 27×1 weight vector associated with an endpoint p of a fiber tract.
We assign a weight of 1 to the endpoint and a weight of exp(-Δps) to its 26-connected
neighbors but only if the neighbors are gray matter voxels. If no neighboring gray matter voxels are present, the given fiber is discarded. Δps is the distance between the
endpoint p and the neighbor s in voxel units. We then normalize ωp such that its
giv-en tract in ggiv-enerating ωq. For each pair of elements ωp(k) and ωq(l) in which the two
corresponding voxels lie in brain area i and j, respectively, we add ωp(k)·ωq(l) to A ij,
where Aij is the (i,j)th element of the fiber count matrix, A. In effect, we are placing a
Gaussian kernel at each endpoint and partitioning a tract across spatially proximal brain areas to model endpoint uncertainty. If all neighbors of endpoint p lie within the same brain area i and all neighbors of endpoint q lie within the same brain area j, the scheme above reduces to simple fiber count. Note that the resulting AC estimates would depend on the choice of neighborhood size and the drop off rate of the Gaussi-an kernel. We defer sensitivity Gaussi-analysis on these parameters to future work.
2.3 Connectivity Consistency Assessment
We evaluate the consistency between the various FC and AC estimates described in Section 2.1 and 2.2 using two criteria. The first is simply the correlation between the FC and AC estimates averaged over subjects. The second is based on the incorpora-tion of the FC and AC estimates as priors for task activaincorpora-tion detecincorpora-tion using the model that we proposed in [9]. The assumption is that if the FC and AC estimates are consis-tent, then using them as priors should result in the same brain areas detected as acti-vated. To safely base our assessment on activation detection, we employed the maxi-mum-t permutation test [10] to enforce strict control on false positive rate. Under the model in [9], the maximum a posteriori mean of the activation effects is given by:
1
1 1 1 1 2 1 1 V V V YXT XXT M , (2)where Y is a d×n matrix containing task fMRI time courses of d brain areas of a given subject. X is a m×n regressor matrix, where m is the number of experimental condi-tions. V1 and V2 are d×d covariance matrices of Y and the activation effects, respec-tively. We assume V1 = Id×d as conventionally done and V2 is where we inject differ-ent connectivity priors. The influence of the prior on M is controlled by α, which we optimize based on model evidence [9]. We note that the model in [9] assumes V2-1 is positive definite, hence theoretically, only FC estimates, Λˆ, generated by (1) can be directly employed for this model. In practice, even if V2-1 is only positive semi-definite, with V1 = Id×d, the optimal α derived based on model evidence would ensure
V1-1 + αV2-1 is invertible. This observation is particularly important, since as we will now show, it enables fiber count, ill-conditioned Pearson’s correlation matrix, and combinations of these connectivity estimates to be integrated into activation effect estimation. Specifically, let W be a d×d matrix with non-negative elements, Wij,
re-flecting the connectivity between brain areas i and j, and L = D ̶ W be the corre-sponding weighted graph Laplacian, which is always positive semi-definite. D is a d×d diagonal matrix with Dii = ΣjWij. We claim here that L is a useful prior that
per-mits connectivity estimates to be meaningfully integrated into activation effect esti-mation when substituted into V2-1. For intuition, consider the simplified scenario in which m = 1 and the columns of X are orthonormal. One can easily show that the negative log posterior distribution of the activation effects comprises a term aTLa,
where a corresponds to activation effects. Since aTLa = (Σ
ij(ai ̶ aj)2Wij)/2,
minimiz-ing the negative log posterior probability penalizes discrepancies between the activa-tion effect estimates of connected brain areas. Given this setup, AC estimates can be easily integrated into activation effect estimation by setting W to fiber count. For Pearson’s correlation, C, one would normally take the matrix inverse and directly assign it to V2-1. However, since t < d for typical RS-fMRI data, matrix inversion would be unstable. We thus propose zeroing the negative elements of C and using the resulting matrix as W. The rationale is that negative FC estimates are usually associ-ated with less anatomical support, i.e. lower fiber count, hence we hypothesize that they are more likely to be false correlations [5]. Building on this intuition, further zeroing elements of C with no anatomical support might help remove some of the noise-induced correlations. Conversely, spurious fiber tracts induced by tractography errors have no functional relevance. Thus, retaining only elements of the fiber count matrix with functional support based on the sparsity pattern of Λˆ might improve activation detection. We assess the effectiveness of these simple FC-AC integration schemes by setting W to the corresponding connectivity estimates.
3
Materials
60 healthy subjects were recruited and scanned at multiple centers. Each subject per-formed 10 experimental tasks similar to those in [11], as fMRI data were acquired over a duration of ~5 min. ~7 min of RS-fMRI data were also collected. Scanning was performed using 3T scanners from multiple manufacturers with TR = 2200 ms, TE = 30 ms, and flip angle = 75o. The task fMRI data were corrected for slice timing and head motions, temporally detrended, and spatially normalized using the SPM8 soft-ware. The RS-fMRI data were similarly preprocessed except a band-pass filter with cutoff frequencies at 0.01 to 0.1 Hz was applied. White matter and cerebrospinal fluid confounds were regressed out from the gray matter voxel time courses.
We divided the brain into N = 500 parcels by concatenating RS-fMRI time courses across subjects and applying hierarchical Ward clustering. The gray matter voxel time courses within each parcel were averaged to generate parcel time courses. The time courses were then normalized by subtracting the mean and dividing by the standard deviation to account for scanner variability across imaging centers. The choice on N was based on a recent brain surface analysis and macaque monkey studies [12]. From the perspective of stable FC estimation with limited time samples, setting N to a lower value would be more suitable. We defer investigation on how to draw a balance be-tween functional localization and stable FC estimation for future work.
dMRI data were collected from the same 60 subjects with TR = 15000 ms, TE = 104 ms, flip angle = 90o, 32 gradient directions, and b-value = 1300 s/mm2. After correcting for eddy currents and head motions using FSL, tensor estimation and fiber tractography based on a single-tensor model were performed using MedINRIA. To better deal with crossing fibers, we also employed the unscented Kalman filter (UKF) tractography algorithm with a two-tensor model [13] for comparison. We warped our parcel template onto each subject’s B0 volume for fiber count computation.
Fig. 1. Connectivity estimate comparisons. (a) Fiber endpoint near gyri has high uncertainty.
(b) Pearson’s correlation vs. fiber count. (c) Correlation between FC and AC estimates.
4
Results and Discussion
The correlation between various FC and AC estimates are summarized in Fig. 1(c). Fiber count based on tracts generated by MedINRIA with endpoint extrapolation is taken as the baseline AC estimate. Conventional Pearson’s correlation and fiber count are not very consistent (Fig. 1(b)) with an average correlation of only 0.1223 across subjects, which is much lower than that reported in [4]. In fact, for the same estimated AC, the estimated FC vary substantially. This finding suggests a high variability in the degree of functional interactions for the same anatomical capacity, but could also be attributed to limitations of the conventional connectivity estimates and data acqui-sition. Using sparse partial correlation as an FC estimate to control for estimation errors and indirect effects significantly increased the FC-AC correlation based on a Wilcoxon signed rank test (p-value < 0.01). Modeling fiber endpoint uncertainty fur-ther increased the FC-AC correlation (p-value < 0.01), but the overall correlation is still low compared to [4], in which RS-fMRI data of 35 min and dMRI data with 128 gradient directions were acquired from 5 subjects. Our results thus indicate that meth-odological improvements might not be adequate to compensate for the fundamental limitations in data acquisition. Further examining this point, we employed UKF trac-tography, which exploits tracking history to improve fiber estimation [13], but the resulting FC-AC correlation was lower than MedINRIA. We suspect that the number of gradient directions in our data was insufficient to benefit from UKF tractography.
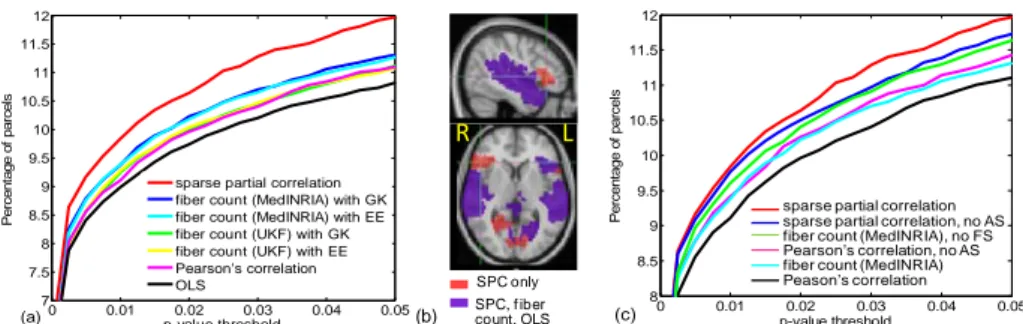
FC-AC consistency results with activation detection as the assessment criterion are shown in Fig. 2. We used maximum-t permutation [10] to strictly control false posi-tive rate, so that more detections would imply higher sensitivity. The average percent-age of parcels detected over 10 experimental conditions and 21 contrasts between these conditions using ordinary least square (OLS) is taken as the baseline. Integrating FC estimated using Pearson’s correlation significantly increased sensitivity (Fig. 2(a)) based on a permutation test described in [1]. Minor improvement over Pearson’s cor-relation was observed at lower p-value thresholds by incorporating AC priors with tracts extracted using UKF tractography. A greater increase in sensitivity was found using AC priors with tracts generated by MedINRIA, which was slightly improved by modeling endpoint uncertainty. Overall, highest sensitivity was achieved with sparse inverse covariance as an FC prior. These differences in detection sensitivity again
1? 2? 3? (a) 0 20 40 60 80 100 -0.5 0 0.5 1 Fiber count P ear s on' s c o rr el at io n (b) (c)
Fig. 2. Activation detection results. (a) % of parcels found activated vs. p-values with FC and
AC estimates separately incorporated as priors. GK = Gaussian kernel, EE = endpoint extrapo-lation. (b) Activation map for an auditory task, p-value < 0.01. SPC = sparse partial correextrapo-lation. (c) FC and AC estimates combined. AS = anatomical support, FS = functional support.
indicate that the FC and AC estimates are not very consistent. In fact, using AC priors generally detected less distant bilateral activation (Fig. 2(b)), which is likely due to difficulties in tracking fibers across the two hemispheres [7]. Removing Pearson’s correlation with no anatomical support significantly increased sensitivity compared to directly using Pearson’s correlation as an FC prior (Fig. 2(c)). We speculate that this increase arises from more false correlations and indirect effects being eliminated compared to true correlations on average. Retaining only fiber count with functional support also significantly enhanced sensitivity, which is likely due to spurious tracts being removed. However, when we zeroed out Λˆij that has no anatomical support, detection sensitivity actually reduced. This suggests that the sparse inverse covariance estimates have false correlations and indirect effects reasonably controlled, thus nul-ling Λˆij with no anatomical support actually removed important connections missed by the AC estimates. Hence, determining the presence of a functional connection completely based on AC estimates could be detrimental. Instead, penalizing FC esti-mates with no anatomical support [1] or probabilistically modeling the absence of anatomical connections [2] are likely better strategies for FC-AC integration.
5
Conclusions
We showed on a cohort of 60 subjects that FC and AC estimates are not very consis-tent for typical RS-fMRI and dMRI data. Integrating them as priors for task activation detection further demonstrated their inconsistencies. Importantly, we illustrated that isolating fibers with functional support as well as removing Pearson’s correlation with no anatomical support enhanced activation detection compared to directly using fiber count and Pearson’s correlation as priors. This suggests that the inconsistencies actu-ally make integration of FC and AC estimates all the more valuable for connectivity estimation. However, when Λˆij with no anatomical support was nulled, activation
detection worsened. Thus, FC and AC estimates should be combined with caution.
0 0.01 0.02 0.03 0.04 0.05 7 7.5 8 8.5 9 9.5 10 10.5 11 11.5 12 p-value threshold P e rc en tage of par c e ls
sparse partial correlation fiber count (MedINRIA) with GK fiber count (MedINRIA) with EE fiber count (UKF) with GK fiber count (UKF) with EE Pearson's correlation OLS (a) R L SPC only SPC, f iber count, OLS (b) 0 0.01 0.02 0.03 0.04 0.05 8 8.5 9 9.5 10 10.5 11 11.5 12 p-value threshold P e rc ent ag e of par c e ls
sparse partial correlation sparse partial correlation, no AS fiber count (MedINRIA), no FS Pearson’s correlation, no AS fiber count (MedINRIA) Peason’s correlation
Acknowledgements
This work was supported by the Genim ANR-10-BLAN-0128 grant, NSERC, and the Berkeley-INRIA-Stanford grant. The data were acquired within the IMAGEN project. Jean Baptiste Poline was partly funded by the IMAGEN project, which receives fund-ing from the E.U. Community's FP6, LSHM-CT-2007-037286. This manuscript re-flects only the authors’ views and the Community is not liable for any use that may be made of the information contained therein.
References
1. Ng, B., Varoquaux, G., Poline, J.B., Thirion, B.: A Novel Sparse Graphical Approach for Multimodal Brain Connectivity Inference. In: Ayache, N., Delingette, H., Golland, P., Mo-ri, K. (eds.) MICCAI 2012. LNCS, vol. 7510, pp. 706—713, Springer, Heidelberg (2012) 2. Venkataraman, A., Rathi, Y., Kubicki, M., Westin, C.F., Golland, P.: Joint Modeling of
Anatomical and Functional Connectivity for Population Studies. IEEE Trans. Med. Imag-ing 31, 164—182 (2012)
3. Damoiseaux, J.S., Greicius, M.D.: Greater than the Sum of its Parts: A Review of Studies Combining Structural Connectivity and Resting-state Functional Connectivity. Brain Struct. Funct. 213, 525—533 (2009)
4. Honey, C.J., Sporns, O., Cammoun, L., Gigandet, X., Thiran, J.P., Meuli, R., Hagmann, P.: Predicting Human Resting-state Functional Connectivity from Structural Connectivity. Proc. Nat. Acad. Sci. 106, 2035—2040 (2009)
5. Skudlarski, P., Jagannathan, K., Calhoun, V.D., Hampson, M., Skudlarska, B.A., Pearlson, G.: Measuring Brain Connectivity: Diffusion Tensor Imaging Validates Resting State Temporal Correlations. NeuroImage 43, 554—561 (2008)
6. Marrelec, G., Krainik, A., Duffau, H., Pelegrini-Issac, M., Lehericy, S., Doyon, J., Benali, H.: Partial Correlation for Functional Brain Interactivity Investigation in Functional MRI. NeuroImage 32, 228—237 (2006)
7. Jbabdi, S., Johansen-Berg, H.: Tractography: Where Do We Go from Here? Brain Connec-tivity 1, 169—183 (2011)
8. Hsieh, C.J., Sustik, M.A., Dhillon, I.S., Ravikumar, P.: Sparse Inverse Covariance Matrix Estimation Using Quadratic Approximation. In: Advances in Neural Information Pro-cessing Systems. 24, 2330—2338 (2011)
9. Ng, B., Abugharbieh, R., Varoquaux, G., Poline, J.B., Thirion, B.: Connectivity-informed fMRI Activation Detection. In: Fichtinger, G., Martel, A., Peters, T. (eds.) MICCAI 2011. LNCS, vol. 6892, pp. 285—292, Springer, Heidelberg (2011)
10. Nichols, T., Hayasaka, S.: Controlling the Familywise Error Rate in Functional Neuroi-maging: a Comparative Review. Stat. Methods Med. Research 12, 419—446 (2003) 11. Pinel, P., Thirion, B, Meriaux, S., Jober, A., Serres, J., Le Bihan, D., Poline, J.B., Dehaene,
S.: Fast Reproducible Identification and Large-scale Databasing of Individual Functional Cognitive Networks. BioMed. Central Neurosci. 8, 91 (2007)
12. Van Essen, D.C., Ugurbil, K.: The Future of the Human Connectome. NeuroImage 62, 1299—1310 (2012)
13. Malcolm, J.G., Shenton, M.E., Rathi, Y.: Filtered Multitensor Tractography. IEEE Trans. Med. Imaging 29, 1664—1675 (2010)