HAL Id: hal-00464860
https://hal-mines-paristech.archives-ouvertes.fr/hal-00464860
Submitted on 18 Mar 2010HAL is a multi-disciplinary open access
archive for the deposit and dissemination of sci-entific research documents, whether they are pub-lished or not. The documents may come from teaching and research institutions in France or abroad, or from public or private research centers.
L’archive ouverte pluridisciplinaire HAL, est destinée au dépôt et à la diffusion de documents scientifiques de niveau recherche, publiés ou non, émanant des établissements d’enseignement et de recherche français ou étrangers, des laboratoires publics ou privés.
Damage assessment on buildings using very high
resolution multimodal images and GIS
Anne-Lise Chesnel, Renaud Binet, Lucien Wald
To cite this version:
Anne-Lise Chesnel, Renaud Binet, Lucien Wald. Damage assessment on buildings using very high resolution multimodal images and GIS. 5th International Workshop on Remote Sensing for Disaster Management Applications, Sep 2007, Washington, DC, United States. �hal-00464860�
Damage assessment on buildings using very high resolution multimodal
images and GIS
A.-L. CHESNEL†, R. BINET†, L. WALD‡
† D´epartement Analyse et Surveillance de l’Environnement, Commissariat `a l’Energie Atomique,
Bruy`eres-le-Chˆatel, France
‡ Centre Energ´etique et Proc´ed´es, Ecole des Mines de Paris, Sophia-Antipolis, France
Emails: anne-lise.chesnel@cea.fr, renaud.binet@cea.fr, lucien.wald@ensmp.fr
Abstract
Satellite images are more and more used to prevent natural disasters and mitigate their impact on populations. Their analysis is usually manually conducted by operators. Automatic processing of very high resolution (VHR) images is critical when the images to analyse are acquired with very different acquisition angles; however, this situation is frequent in an operational scope of a natural disaster. We propose a method to assess damage on buildings using a pair of VHR images whose dates of acquisition encompass the disaster, and a geographical information system that contains the buildings footprints. It takes into account the acquisition parameters of the images. We assess its robustness as a function of the difference between the acquisition angles of the images. For this purpose, we adopt the framework of an operational scope and use six different VHR images that have been acquired successively before and during the period of interest. We show that the rate of false-alarms increases with this difference of acquisition angles. However, even in extreme conditions, damaged buildings are well detected. Our methodology leads to a global performance of the damage detection from 69 % with a difference angle of 80o
, to 90 % for a difference angle around 24o
.
1
Introduction
Natural disasters have an increasing impact in terms of economical and human losses. This is due to the increasing population and to its migration in areas that are prone to disasters like seacoasts. Local authorities of the affected area need to know rapidly the disaster extent (Allenbach et al., 2005) to limit its impact on population and material. For this purpose, remote sensing is useful, as acknowledged by the creation of the International Charter Space and Major Disasters (International-Charter, 2007) by 2000, and by initiative like Unosat (UNOSAT, 2007). In this operational scope, the required information is generally manually extracted from the images acquired by satellites: an archive image - the reference image - is compared to an image acquired after the disaster - the crisis image. The processing time has to be as short as possible, hence the need of an automatization to speed it up. Automated methods applied to medium to high resolution images have been proposed, but their performances are hardly addressed, no ground-truth being available. Very High Resolution (VHR) images allow such an assessment. However, the multitemporal analysis of these VHR images exhibits more natural changes that are not related to damage (Adams et al., 2004; Bitelli et al., 2004; Chen and Hutchinson, 2005; Sakamoto et al., 2004), like shadow changes, vegetation modifications and other changes due to human activities. Another major difficulty is the registration of the VHR images. When they are not acquired with the same acquisition angles, difficulties are encountered notably for objects higher than bare-ground. All these changes have to be corrected or filtered out. We adopt an object-oriented approach. We focus on the buildings, more precisely on their roofs because they are most often visible by means of remote sensing. It avoids false alarms due to natural changes that occur around the buildings, on the roads for example. For that purpose, we use a Geographical Information System (GIS) built from an archive image of the studied area.
We propose in this work to use a method of damage assessment that includes a preliminary subpixel registration of the buildings roofs. It takes into account the acquisition angles of the images. We applied this method on the case of study of Beirut, in Lebanon. Some buildings in the area of Haret Hreik have been destroyed in summer 2006, following bombings. This event is particularly of interest for our study because several QuickBird images, acquired with very different acquisition angles, are available: two reference images and three crisis images. It allows to investigate the
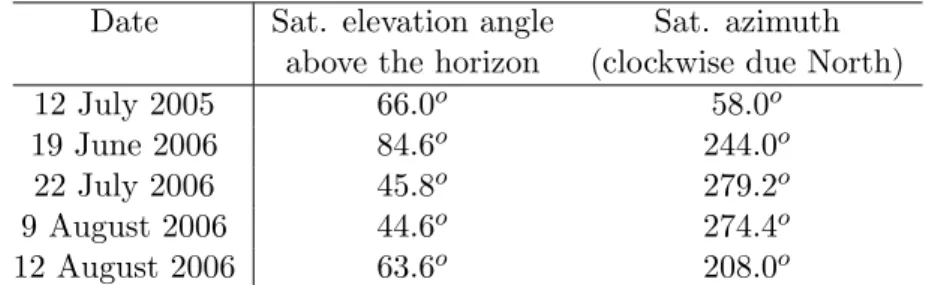
Table 1: Acquisition angles of the QuickBird images used as input in this study.
Date Sat. elevation angle Sat. azimuth above the horizon (clockwise due North)
12 July 2005 66.0o 58.0o
19 June 2006 84.6o 244.0o
22 July 2006 45.8o 279.2o
9 August 2006 44.6o 274.4o
12 August 2006 63.6o 208.0o
Table 2: Base to height ratio (B/H) for the six different images pairs used as input.
Crisis images
22 July 2006 9 August 2006 12 August 2006
Reference 12 July 2005 1.34 1.40 0.91
images 19 June 2006 0.90 0.93 0.42
robustness of our method in a dense urban area with high buildings, as a function of the acquisition conditions.
The data used in this study are presented in a first step. The registration method is explained in a second part. The method to detect the damage is presented in a third part. Finally, the results are analysed and conclusions are drawn.
2
Data used
The images used in this study are panchromatic QuickBird images, acquired before and after the bombings of Beirut, that occurred from 12th of July 2006 to 14th of August 2006. We studied more specifically the area of Haret Hreik, where extensive destructions are observable. Two reference images acquired by QuickBird without clouds have been found. Then, three successive crisis images are available, the last acquired at the end of the conflict (table 1). From these images, different pairs of images reference/crisis can be used to detect damage. To quantify the difference of acquisition parameters for each pair, the base to height ratio (B/H) is computed (table 2). The larger the B/H ratio, the more different the acquisition angles.
First, we note that none of the available images have the same acquisition parameters (table 1). This is confirmed by the table 2: the B/H ratio varies from 0.42 to 1.40; it represents absolute difference angles from 24.3o to 80.1o. Note also that the two first crisis images (22 July 2006 and
9 August 2006) present very low elevation angles. This is often the case for the very first images acquired after a disaster, because they are acquired as soon as possible, without waiting for ideal conditions. Figure 2 illustrates the problem of registration with the reference image of 19 June 2006 (a), and the crisis images of 9 August 2006 (b) and 12 August 2006 (c). The three images are registered according to the ground, as confirmed by the red mark on the left: it is at the same location in the three images. A high building in the centre is highlighted: the higher the B/H ratio, the larger the shift between the two images. We also see that a low building (on the right of the images) can be hidden by a higher one (figure 2b), preventing its analysis.
We also use in this study a Geographical Information System (GIS) as input data. It contains the footprints of the building roofs, in agreement with the reference image. This GIS has been built manually; however, the footprints of the building roofs could have been retrieved by other means: a Digital Elevation Model with fine spatial resolution, or an segmentation and classification of the reference image.
The extraction of the building roofs is limited to the reference image; then the same GIS is used with the three pairs of images that correspond to the three crisis images. In this way, a monitoring of a site of interest at successive dates is possible. By comparison with the crisis images, we have identified the buildings of the area that have been destroyed. It will represent a ground-truth to which we will compare the result of our damage detection method. The GIS, overlaid on the reference
(a) Reference image (19 June 2006) (b) Crisis image (9 August 2006)
Figure 1: In red, three marks are drawn in (a): on the ground (left), on the roof of a high building (centre) and
on the roof of a low building (right). They are reported in the crisis images (b and c) using the geographical coordinates. The mark on the ground (left) is correctly registered for both crisis images, whereas the buildings roofs are shifted. – Note in (b) that the low building on
the right is hidden by another one.
(c) Crisis image (12 August 2006)
image is presented in figure 2.
Figure 2: Area of Haret Hreik, in Beirut, Lebanon. Image acquired in 19 June 2006 (reference image). The footprints of the 430 buildings contained in the GIS, used as additional input, is overlaid. The green corresponds to intact or not detectable damage (325 buildings); the yellow to buildings destroyed between the 19 June 2006 and the 22 July 2006 (74 buildings); the red to buildings destroyed between the 22 July 2006 and the 9 August 2006 (21 buildings); the blue is for buildings destroyed between the 9 August and the
12 August 2006 (10 buildings).
3
Registration
To compare the images in an automatic way, they have to be precisely registered. Registration methods found in the literature (Brown, 1992; Zitova and Flusser, 2003) are not adapted to VHR images with different acquisition angles. Most of them aim to build a model of the transformation from the master image to the slave image; deformations in VHR images are difficult to model, because of the discontinuity of the surface elevation due to the presence of buildings. Thus we propose to register the images in two steps.
First we register the images according to the ground (image registration). As seen in figure 2, the top of the buildings are still not registered: a method of subpixel registration of the building roofs is then applied, using the GIS (roof registration). The GIS is already registered to the reference image.
Image registration The original images are ortho ready standard images. We assigned to the reference image of the 16 June 2006 the role of master image, and registered all the others to this image. We orthorectified the images using the Rational Polynomial Coefficients provided with the data and the SRTM Digital Terrain Model. We registered the images to the master image with a set of four Ground Control Points.
Roof registration In addition to the registration of the images, we propose a method to register each building roof precisely. Our registration method estimates the maximum a posteriori of the correlation computed on the group of pixels held in the roof footprints in both images. The footprint defined in the reference image by the GIS is translated in the crisis image by a quantity ~o estimated by the algorithm of roofs registration (equation 1). Let R1 and R2 be respectively the reference and the crisis images with zero mean. Let c and l be respectively the column and the line coordinates, and kcand klbe respectively the shift value of the roof footprint in the crisis image along the columns
and along the lines.
~ o= arg max kc,kl X c,l R1(c, l).R2(c + kc, l+ kl).H(c, l) s X c,l R21(c, l).H(c, l). s X c,l R22(c + kc, l+ kl).H(c, l) (1) where H(c, l) = ( 1 if R1(c, l) ∈ roof footprint 0 otherwise
The function H(c, l) may be defined by the means of a segmentation or an extraction of buildings footprint. In our case, its values are assigned by the means of the GIS. The position (kc∗, k∗l) of the maximum correlation yields the offset ~o.
The offset ~o can be written as the sum of a ground offset ~og due to the ground misregistration
and a height offset ~oh due to the unknown building height: ~o = ~og + ~oh . Let ~o⊥ be such that
~
og∧o~⊥= ~0. The ground offset ~og has no expectable orientation. On the contrary, the height offset
~
oh is solely dependent on the viewing angles for both images and on the building height. For intact
buildings, this offset is observed in the epipolar direction.
Equation (1) is applied to a limited search area. The height offset ~oh is due to the height of the
constructions, so its amplitude differs for each building. On the contrary, we will suppose that the ground offset does not vary much. These differences are exploited to define an unique search area. Note that a 2D search is necessary due to the unpredictability of the ground offset, reducing the relevance of an epipolar image projection. The search interval is set along the ~o⊥ axis as a function
of the expected registration error of the ground between the images, and along the ~oh axis as a
function of the estimated maximum height of all the buildings.
4
Damage detection
The correlation coefficient that corresponds to the best offset (k∗
c, kl∗) for each building yields
in-formation about the similarity quality of the roof between the two considered images. We use this coefficient associated to each building to decide whether it is damaged or not. The correlation coefficient spans between −1 and +1. Different tests have shown that depending on the test case (different areas, damage types, building types, atmospheric conditions. . . ), the optimal threshold for the correlation coefficient between intact and damage building differs. So a threshold adapted to a given disaster has to be decided. For this purpose, we chose a supervised classifier based on Support Vector Machines (SVM) (Vapnik, 1995; Burges, 1998). To meet the requirements of an operational scope, the required training set is constrained to be small, with five examples of intact buildings and five other examples of damaged ones.
5
Results and discussion
The methodology is applied to each of the six images pairs. The computation for the registration and the damage detection is fast (a few minutes). The 10 training samples (5 per class) for the classification with SVM are randomly chosen among the buildings of the GIS, according to the class they belong. The performances are evaluated on the whole dataset.
The classification performances are given as a function of the B/H ratio in figure 3. The rates of good classification for the intact buildings and for the damaged buildings appear separately (respectively in green and in red), along with the mean performance (in black).
0.4 0.6 0.8 1 1.2 1.4 1.6
Base to height ratio 0 10 20 30 40 50 60 70 80 90 100 Performance All buildings Intact buildings Damaged buildings
Figure 3: Rate of good classification for the buildings as a function of the B/H ratio. Lines result of a linear regression for intact buildings (green), destroyed buildings (red) and whole dataset (black).
There is a clear trend of performance decrease when the B/H ratio increases (figure 3). Consider-ing the intact and the damaged class separately, we observe that the damaged class is detected with a better accuracy than the intact one. Moreover, its associated performance is less affected by a high B/H ratio. Few damaged buildings are not detected. The main origin of the classification errors is false-alarms, i.e. the intact buildings that are classified as destroyed. A precise analysis shows that a large part of these errors are due to registration errors, for example buildings that are hidden by another one or located in its shadow. Figure 4 illustrates one of this situation. No information can be retrieve from these occluded buildings. We also point out that a lower satellite elevation leads to a coarser spatial resolution; a large difference of spatial resolution between the reference and the crisis image could also explain a decrease of similarity, even for intact buildings.
(a) (b)
Figure 4: Classification result – Extracts of the 19 June 2006 reference image (a) and the 22 July 2006 crisis image (b). Green corresponds to intact buildings, red corresponds to destroyed ones; Solid fill means correct classification, contrary to the footprint with no fill. The building in the center is intact but is classified as
destroyed because it is hidden by another building: an important change is detected.
6
Conclusion
Following a disaster, it is most of the time not possible to chose the acquisition angles of the very first crisis images available. However, the analysis of crisis images is often conducted in comparison
to a recent ante-disaster image. Thus one cannot make sure that both images will have the same acquisition parameters. One needs to use methods of analysis adapted to such situations.
We propose a method to detect damage on buildings that takes into account this consideration. We evaluate in this paper the robustness of this method, as a function of the difference in acquisition angles. For that purpose, we use six different pairs of VHR images, and evaluate the quality of the damage detection.
First, we show that our method is efficient to detect damage for a moderate B/H ratio. Our method is specifically more efficient for damaged buildings (from 77 % to 97 % of correct classifica-tion), even in extreme situation where difference between the acquisition angles represents 80o. The
difficulty is to limit the false-alarms rate. We observe that this rate increases with the difference between the acquisition angles. A precise analysis shows that the difficulty is due to registration errors. Particularly, occluded buildings represent a large part of these errors.
More work on this topic is required to improve the results; several possibilities could be consid-ered. One of these is to detect such occluded buildings, and to base the classification decision on the state of the buildings in its neighbourhood. It could be adapted to the case of a widespread disaster, like a hurricane, an explosion or a tsunami.
References
Adams, B., C. Huyck, B. Mansouri, R. Eguchi, and M. Shinozuka (2004). Appli-cation of high-resolution optical satellite imagery for post-earthquake damage as-sessment: The 2003 boumerdes (algeria) and bam (iran) earthquakes. Research Progress and Accomplishments 2003-2004, Buffalo: MCEER. Available online at: http://mceer.buffalo.edu/publications/resaccom/04-SP01/12 Eguchi.pdf (accessed 15 Febru-ary 2007).
Allenbach, B., R. Andreoli, S. Battiston, C. Bestault, S. Clandillon, and K. Fellah (2005, July). Rapid eo disaster mapping service: Added value, feedback and perspectives after 4 years of charter actions. In IEEE Proceedings of International Geoscience And Remote Sensing Sym-posium 2005, Volume 6, pp. 4373–4378.
Bitelli, G., R. Camassi, L. Gusella, and A. Mongnol (2004, July). Image change detection on urban area: the earthquake case. In XXth ISPRS Congress, Istanbul, Turkey, pp. 692.
Brown, L. (1992, December). A survey of image registration techniques. ACM Computing survey (CSUR) 24 (4), 325–376.
Burges, C. (1998). A tutorial on support vector machines for pattern recognition. Data Mining and Knowledge Discovery 2 (2), 121–167.
Chen, Z. and T. C. Hutchinson (2005). Urban damage estimation using statistical processing of satellite images: 2003 bam, iran earthquake. Proceedings SPIE 5667, 289–300.
International-Charter (2007). International charter Space and Major Disasters. Available online at: http://www.disasterscharter.org/ (accessed 15 February 2007).
Sakamoto, M., Y. Takasago, K. Uto, S. Kakumoto, Y. Kosugi, and T. Doihara (2004, September). Automatic detection of damaged area of iran earthquake by high-resolution satellite imagery. In IEEE Proceedings of International Geoscience and Remote Sensing Symposium 2004, Vol-ume 2, pp. 1418–1421.
UNOSAT (2007). United nations institute for training and research (unitar) operational satellite applications programme. Available online at: http://unosat.web.cern.ch/ (accessed 2 August 2007).
Vapnik, N. (1995). The nature of statistical learning theory. New York, NY, USA: Springer-Verlag New York, Inc.
Zitova, B. and J. Flusser (2003). Image registration methods: a survey. Image and vision comput-ing 24, 997–1000.