by
BARTLETT W. PAULDING, JR.
Geol. Eng., Colorado School of Mines (1959)
SUBMITTED IN PARTIAL, FULFILLMENT OF THE REQUIREMENTS FOR THE DEGREE OF
DOCTOR OF PHILOSOPHY at the
MASSACHjUSETTS INSTITUTE OF TECHNOLOGY June 1965
Signature of Author
Departmenit of Geology an4' Geophysics, February 9, 1965
Certified by...
Thesis
Supervisor-Accepted by ....
Chairman,
Departmental Committee on Graduate Students
-S IST. TEC, L I SRA' LIN DGRE~N
MITLibraries
Document Services
Email: [email protected]http,//Iibraries.mit.,edu/doosDISCLAIMER OF
QUALITY
Due to
the condition of the original material, there are unavoidable
flaws in this reproduction. We have made every effort possible to
provide you with the best copy available. If you are dissatisfied with
this product and find it unusable, please contact Document Services as
soon as possible.
Thank you.
Title: Crack Growth During Brittle Fracture in Compression. Author: Bartlett W. Paulding, Jr.
Submitted to the Department of Geology and Geophysics February 9, 1965 in partial fulfillment of the
requirements for the degree of Doctor of Philosophy at the Massachusetts Institute of Technology.
Photoelastic analysis of several two-crack arrays pre-dicts that compressive fracture is initiated at cracks
oriented in a particular en schelon manner. Observation of partially-fractured samples of Westerly granite, obtained during uniaxial and confined compression tests by stopping the fracture process, indicate that fracture is initiated by en echelon arrays of biotite grains and pre-existing, trans-granular, cracks. Crack growth is predominantly parallel with the direction of maximum compression and the partial fractures incorporate both grain boundaries and trans-granular cracks. The porosity due to crack growth was determined by compressibility tests. Crack growth was found to be time dependent. Certain characteristics of the volumetric strain vs maximum stress difference curves for several rocks indicate that crack growth is initiated at a stress difference of about half the compressive strength. Therefore, neither the Griffith theory nor the McClintock-Walsh modification can be expected to predict the strength of common rocks. However, good agreement exists between the McClintock-Walsh modification and the stress difference at
the onset of crack growth. Because of the volume increase due to crack growth about 15 per cent of the work required to fracture a specimen in compression goes into work against the pressure medium.
Thesis Supervisor: William F. Brace
Associate Professor of Geology Title:
ABSTRACT .... ... 2 INTRODUCTION .... ... 7 PHOTOELASTIC TESTS Introduction ...
14
Experimental Procedure ... 15 Experimental Results ... 21Discussion of Experimental Results ... 30
II UNIAXIAL COMPRESSION TESTS Introduction ... 32
Experimental Procedure ... 34
Experimental Results ... 35
Discontinuous Tests ... 36
Cyclic Tests .. ... 41
Tests Indicating Effect of Strain Rate ...
45
Discussion of Experimental Results ... 48
Discontinuous Tests ... 48
Cyclic Tests ... 51
Tests Indicating Effect of Strain Rate ...
58
Experimental Procedure ... 70 Experimental Results ... 72 Discussion of Experimental Results ... 76
IV CONFINED COMPRESSION TESTS
Introduction ...
77
The Onset of Crack Growth and theMcClintock-Walsh Modification ... 77 The pdV Work Associated with Crack
Growth ...
78
Experimental Procedure...
79
Experimental Results ... 83
Discussion of the Experimental Results 91
Stress Difference Required to
Initiate Crack Growth ... 91
Work Done Against the Pressure
Medium ... ... ... 92 Description of the Fractured
Specimens ... 93
V CONCLUSIONS
Introduction ... 105
Evaluation of Experimental and
Interpretative Techniques ... 106 Stiffening Element ... 106 Sample Shape ... 106 Determining Onset of Crack Growth
with Plot of V
V -vs
(Y
-
c")...107
31The Process of Brittle Fracture Microscopic ... 108 Macroscopic ...
114
VI ACKNOWLEDGEMENTS ... 120 VII BIBLIOGRAPHY Cited References ... 121 Supplementary References ... 124 VIII APPENDICIES1. Critical Orientation of Elliptical Openings in a Compressive Stress
Field ... 126
2. Design of the Stiffening Element ... 127 3. Limitations of a Press of Finite
Stiffness ... 140
4. Preparation of Samples ... 143
5.
Design and Calibration of theLoad Cell ... 146 6. Recording Instrumentation ... 152 7. Calculation of -- from Two Strain
Gages .... ... 154 8. Error Analysis ...
158
9. Use of Compressibility Tests inDetermining the Porosity Due to
11. Jacketing of Samples ... 169 12. The McClintock-Walsh Modification of
the Griffith Theory ... 172 13. Determination of ( -
(
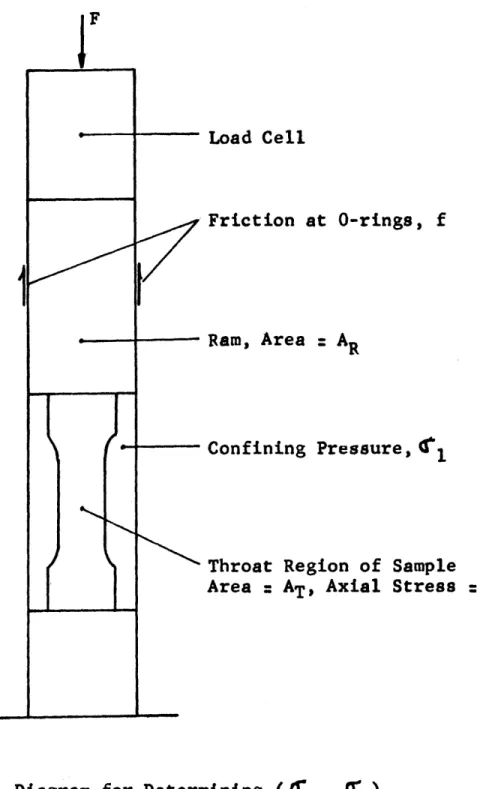
1) inConfined Compression Tests ... 176 14. Friction at 0-rings During Confined
Compression Tests ... 179
15. Analysis of Elastic Stability of
Sample ... 181 IX BIOGRAPHY OF THE AUTHOR ... 183
183
Even though the mechanical properties of rock have been extensively studied, we are still severely limited in predicting the behavior of rocks under crustal conditions or in interpreting the conditions present during the develop-ment of geologic features such as folds, joints, and faults. Since one cannot hope to extrapolate experimental data to geologic dimensions and time intervals, the solution of these problems requires a general theory of the mechanical behavior of rocks.
Of the many phenomena which are important during de-formation, brittle fracture is best understood at present because of the limited number of microscopic processes which occur.
Up to now the study of the mechanics of brittle frac-ture of rocks has been primarily oriented toward determining the applicability of the Griffith theory (Griffith, 1921, 1924). Griffith postulated that materials contain flaws or cracks and that large tensile stresses exist on the surface of certain critically oriented cracks when the material is stressed. Griffith proposed that fracture occured when the most severely stressed crack propagated.
close under pressure. Once a crack has closed, frictional stresses exist along the crack surfaces. These frictional stresses tend to resist additional deformation of the
crack and, as a result, the maximum stress concentration near the ends of the cracks is less than for a similar crack whose walls are not in contact. Therefore, their analysis predicts higher strengths than Griffith's.
The McClintock-Walsh modification gives the confined compressive strength in terms of the uniaxial compressive strength, the coefficient of friction of the crack sur-faces, and the stress normal to a crack which is required to close it. They find good agreement with the
experi-mental results of several investigators when the coefficient of friction is taken to be unity and the cracks are
considered to close at stresses which are negligible when compared with the strength.
Brace (1960) showed that for a coefficient of friction of about unity, the McClintock-Walsh modification is nearly identical with the empirical Coulomb failure law observed for rocks during compression.
By considering the straight segments of grain
boundaries as Griffith cracks, Brace (1961) found that the uniaxial compressive strength and maximum grain size for
length. In addition, Brace (1964) found that the tensile strength of certain rocks could be predicted to within a factor of two by substituting measured values of Young's modulus, surface energy and crack length (i.e., maximum grain size) into Griffith's equation
Te = (2 .
Further evidence that a mechanism such as suggested by Griffith is operative was obtained by Brace (1964) from examination of partially fractured specimens. He found
that grain boundaries became loosened as the stress was increased prior to failure and the rock appeared to be a
crack-filled material as envisaged by Griffith. Further-more, Brace found that the fracture often grew from an en echelon array of cracks.
Brace and Bombolakis (1963) studied the growth of cracks in a uniaxial compressive stress field. Their
general method consisted of introducing critically-oriented cracks into homogeneous materials and stressing the sample until the crack propagated. They found that the point of maximum tensile stress on the surface of the most critical crack did not occur at the very end of the crack, as in tension (Wells and Post, 1958), but in the sector between
the long axis of the crack and the direction of maximum compression. Initial growth was normal to the crack surface at the point of maximum tension. The crack then continued to propagate along a curved path which approached the direction of uniaxial compression. Crack growth
stopped after the crack had attained a length of two to three times the original length. This evidence, of a critically-stressed crack growing into a stable position, was the first indication that the process of fracture in compression might not be as suggested by Griffith.
A second fundamental question of the applicability of the Griffith theory arose from a photoelastic study by Bombolakis (1963). He found that the magnitude of the maxi-mum tensile stress on the surface of an elliptical slit was strongly dependent on the relative position of neighboring slits. Griffith's theory is based on Inglis' (1913) solu-tion of the stress condisolu-tions around an isolated, elliptical, opening. Since Brace and Bombolakis showed that cracks must be quite close in order to coalesce, the stress conditions derived by Inglis might not be applicable to the actual case.
Even though evidence was beginning to accumulate which seriously questioned if the Griffith theory should predict the compressive strength of rocks, his idea that brittle fracture is due to the growth of cracks had gained support.
This investigation was undertaken to obtain a better understanding of the mechanics of crack growth during
brittle fracture. This involved several experimental techniques: photoelastic analysis, uniaxial compression tests, compressibility tests and confined compression tests.
The purpose of the photoelastic analysis was to determine the stress conditions of a crack when in the proximity of another crack. Several two-crack arrays were studied to investigate the relationship between the geometry of an array and (1) the magnitude of the maximum tensile stress on the surface of each crack, and (2) the principal stress directions.
Uniaxial compression tests on Westerly granite were next undertaken to see if the growth of cracks corresponded to the results of the photoelastic analysis. Westerly
granite was chosen as a typical, siliceous, crystalline rock which was known to be brittle (Brace, 1964). In addi-tion, experimental technique could be checked by comparing Young's modulus and compressive strength with earlier
results (Brace, 1964).
It was decided to obtain partially-fractured speci-mens in order to study the development of cracks leading to a macroscopic fracture. Since it was felt that a large amount of crack growth occured during the final stress
increments, the samples had to be loaded to just below the fracture strength and yet be recovered, intact. This re-quired that the press-rock system remain stable even though the load carrying ability of the sample decreased.
Walsh (1965a) showed that the porosity due to narrow cracks could be measured by means of a compressibility test. Compressibility tests were conducted to find the porosity due to crack growth which occured during the
uni-axial compression tests. In addition, the compressibility tests proved useful in determining the predominant direction of crack propagation.
Measurement of the axial and lateral strains allowed computation of the volumetric strain. The onset of crack growth was determined by noting certain characteristics of the plots of volumetric strain vs maximum stress difference. Certain characteristics of crack growth during the uniaxial compression tests suggested that the investigation should be extended to include confined compression tests.
The influence of confining pressure on the maximum stress difference required to initiate crack growth was com-pared with the McClintock-Walsh modification of the Griffith theory. The stress difference at the onset of crack growth was substituted for their stress difference at fracture.
The Pronounced volume increase which occurred during the uniaxial compression tests suggested that if crack
growth in confined compression tests causes a significant increase in volume then some of the work required to frac-ture a specimen may go into work against the confining pressure. In order to determine the importance of the work against the pressure medium, the total work and pdV work were compared.
The text is divided into five chapters: PHOTOELASTIC TESTS, UNIAXIAL COMPRESSION TESTS, COMPRESSIBILITY TESTS, CONFINED COMPRESSION TESTS, and CONCLUSIONS, in that order. The first four chapters are divided into Introduction,
Experimental Procedure, Experimental Results, and Discussion of Experimental Results. The implications of the results of this study toward the brittle fracture of rocks and suggestions for further investigation are presented in the last chapter.
PHOTOELASTIC TESTS
Introduction
For homogeneous materials such as glass it has been found (Griffith, 1921) that, in tension, the stress re-quired to initiate crack growth is, in fact, the strength of the material. This is because a critically orientated crack grows normal to the direction of applied tension (Wells and Post,
1958),
becomes increasingly more critical and immediately leads to fracture.In contrast, Brace and Bombolakis (1963) showed that a crack does not propagate much further than its original length when subjected to uniaxial compression. Their re-sults suggest that fracture in compression requires the activation of more than one crack and for a fracture to develop from the coalesence of cracks, the cracks must initially be within a distance of approximately one crack length of each other.
Griffith based his theory on a solution of the stress state around an isolated, elliptical, opening (Inglis, 1913). Bombolakis (1963) showed that the magnitude of the maximum tensile stress on the boundary of an elliptical opening was strongly influenced by the relative position of neighboring
ellipses. Since cracks must be quite close in order to coalesce, the stress conditions derived by Inglis for an isolated crack might not be applicable to the actual case.
It was decided to systematically study the stress concentration factor of cracks in several different arrays to determine the relationship between the magnitude of the maximum tensile stress and the geometry of the array.
Several parameters are necessary for describing the geometry of an array and it was hoped that some consistent behavior would become apparent whereby one or more parameters neces-sary for a critical array would be known.
Experimental Procedure
Photoelasticity was chosen in preference to analytic methods of solution because of the mathematical diffi-culties associated with a multiply-connected body. A brief discussion of the photoelastic phenomena is presented for
a better understanding of the experimental method and results. A detailed description may be found in Frocht (1941).
In general, a photoelastic model consists of a plate of isotropic plastic which has been cut to the shape of the prototype. The model is then loaded and observed in a
polariscope, The isotropic plastic becomes temporarily doubly-refracting when stressed and the amount of
bire-fringence is proportional to the magnitude of the shear
stress. Under certain light conditions, the points of equal shear stress appear dark. Lines composed of these points are called interference fringes. As the model is loaded several interference fringes may emanate from a point of high stress. The fringes are consecutively numbered as they emerge and this number is called the order, n, of the interference fringe. The magnitude of the principal stress difference is given by
07 -- 1= F. C.n
3-1
t (Equation 1)where F.C. = fringe constant of the material and t = thickness of the model.
The absolute value of the tangential stress at a boundary may be determined from Equation 1, since the normal stress
is zero.
The photoelastic plastic also appears dark if the transmission planes of the polarizer and analyzer of the polariscope are parallel, respectively, with the principal stress directions. The lines composed of these dark points are called isoclinics. The complete isoclinic pattern is obtained by simultaneously rotating the analyzer and polar-izer by small increments, e.g., 10 degrees, and mapping the isoclinics at each position.
It is convenient to choose a material of low fringe constant when mapping interference fringes in order to avoid the necessity of high loads. On the other hand, it is convenient to choose a material of high fringe constant when mapping isoclinics to minimize or eliminate the pres-ence of interferpres-ence fringes which tend to obscure the isoclinics. In this investigation identical models were cut from Columbia resin (No. 39) and plexiglass, to study, respectively, interference fringes and isoclinics.
Cracks were represented by slots which consisted of parallel sides and semicircular ends. Slots were chosen in preference to ellipses to facilitate preparation.
Bombolakis (1963) showed that the stress around a slot is nearly the same as the stress around an elliptical hole in the region of the tensile stress concentration.
Two-slot arrays were used to study the influence of the relative position of cracks on the magnitude of the
maximum tensile stress of a crack. The parameters necessary for describing a two-slot array are shown in Figure 1. The
length and width of the slots are a, and b, respectively. The distance between the centers of curvature of the nearest
ends of the two slots is d. '_ is the inclination from vertical of the long axis of the slot and [ is the
inclina-tion from vertical of the line joining the centers of curvature of the nearest ends of the two slots. Negative
Parameters Used in Describing the Geometry of a Two-Slot Array
The plate was placed in a loading frame designed to apply a uniform compressive stress along the horizontal
edges of the model. For a description of the loading frame, see Bombolakis (1963, Appendix B, p. 8). Each plate was calibrated by recording the loads at which a fringe emerged from the two points on the horizontal diameter of a cir-cular hole. The magnitude of the compressive stress at
such points is three times the applied compressional stress, (Timoschenko and Goodier,
1951).
A straight line wasobtained by plotting load vs fringe order. The slope of this line is denoted by (f)circle. A slot was then cut which included the calibration circle and the plate was again loaded. The load was recorded as the fringes emerged from the points of maximum tension, The approximate loca-tion of the maximum tensile stress on the boundary of an inclined slot in a plate subjected to uniaxial compression is shown in Figure 2. The tensile stress concentration factor of the slot, K, was found according to
K = (3Ecircle
n slot (Equation 2)
where
(E)slot
slope of load vs fringe order for the slot.An additional slot was then cut to form the two-slot array and the K of the array was determined. Several arrays
P
P
Points of Maximum Tensile Stress on an Inclined Slot
in a Plate Subjected to Uniaxial Compression
were studied from one plate by alternately enlarging the slots and plotting load vs fringeorder.
The isoclinic pattern was found by tracing the iso-clinics at each ten-degree interval. The stress trajectories were found by placing a piece of tracing paper over the
isoclinic pattern and drawing the stress directions as dictated by the isoclinics.
Experimental Results
The value of K for the isolated slots was determined photoelastically for comparison with K when the slots are
in an array. The results are presented in Table 1. The uncertainty of 13 per cent was determined by comparing the
ratio of the stress concentration factors at the points on the horizontal and vertical diameters of the circular hole.
The value of K was determined for about 50 different
two-slot arrays. In these tests a varied from
}
to inches, b from 1 to)g
inches and 0 from 10 to -50 degrees. S and d were held constant at 35 degrees and 1 of an inch,respectively. The dimensions were chosen to give the maxi-mum possible number of arrays and yet restrict the overall size of the array. The value of 35 degrees was chosen as representative of the most critical orientation for the range of studied (Appendix I).
TABLE 1
Stress Concentration Factor of Isolated Slots
4
1.26 1 0.165
1.60 1 0.21 6 1.95 1 0.25 7 2.13 2 0.28The results of the photoelastic tests of the two-slot arrays are presented in Table 2. The values of a, b, and , are presented in the first three columns. The
values of K for the arrays of different 0 are presented in the first half of each succeeding column. Normalized K, KN' is found by dividing the K of the array by the K of the isolated slot. KN was tabulated to provide a convenient comparison of the effect of neighboring slots on the K of
a slot for different values of 9.
The variation of K with g for different values of a is shown in Figure 3. In each case b was of an inch. The maximum value of K consistently occurred at about
j=
-20 degrees.The smallest distance between two slots was (d - b).
In order to determine if the relationship between KN and (d - b) followed the same rule as the decrease in stress with distance from a crack (Irwin,
1958),
the values of KN were plotted against (d a b )0.5. This is shown forg
equal to -20 and -30 degrees in Figurei
4.
The behavior of KN a b)0.5 was approximately linear for all values ofj
and the slopes of the straight lines drawn through the points are presented in Table 3.One set of the stress trajectories for an isolated slot of ( = 6 and '. 35 degrees is shown in Figure
5.
The stress trajectories for a two-slot array with 2 = 6,Stress Concentration Factor of Two-Slot Arrays 0 =10 0 = 0 0 = -10 0 = -20 0 = -30 0 = -40 0 = -50 a b a K KN K KN K KN KKN K KN KKN KKN 1 1 2 - 4 1.11 0.88 1.13 0.89 1-39 1.10 1.82 1.44 1.73 1.37 1.67 1.32 1.53 1.21 5 1.37 0.68 1-55 0.97 1.88 1.17 2.06 1.39 1.94 1.21 1-75 1.09 1.53 096 6 1-57 0.80 1-93 0.99 2.14 1.10 2-53 1-30 2.32 1.19 1.77 0-91 1.58 o.81 7 1.90 0.89 1.84 0.86 2.35 1.10 2.84 1-33 2.87 1.35 2.02 0.95 1.82 0.85 - 6 2.28 1.17 2-57 1-32 2.68 1-37 3.09 1.57 2.82 1.45 2.38 1.22 2.06 1.06 16 32 - - 7 2.70 1.27 3-20 1-50 2.97 1.40 3.06 1.44 2-53 1.19 2.63 1.23 --- ---32 32 19 6 1.32 1.32 3.00 1.54 3.00 1.54 3.52 1.83. 3.28 1.68 2.79 1.43 2.28 1.17
K 2.0 -___ ___ --- 1.0--3 .0 -K 2.0-1.0 a=6 b 3 .0 --1.0 -4 K 2.0 - -1.0 0.5-10 ( -10 -20 -10 -40 -0, degrees
Stress Concentration Factor,K, vs 0 Dashed Line is K for Isolated Slot
Vertical Bars Indicate Maximum Error
2.0 KN 1.0 0 2.0 1.0
0=
-200
Ox-300
1.0 1.5(v).5
Normalized K vs (a .5 Figure 4 K N 2.0TABLE
3
Slope of 1 KN vs ad b) Slope 100 0.55 0 0.68 -1 00 0.50 -200 0.57 -300 0.52-40 0
0.55
-50*0
0.44
Stress Trajectories r-6, 11-350
Stress Trajectories
gw6, 06-204, Ye354
Discussion of Experimental Results
The increase in relief, with increasing a , of the
plots presented in Figure 3 and the consistent maximum at = -20 degrees suggests that the most critical array of actual cracks of high b may be an en echelon arrangement with 0 equal to about -20 degrees. Simple superposition of the stress states around a rectangular opening of =
5
and = 30 degrees (Savin, 1961) indicates that the most critical orientation is somewhere between 9 = -20 degrees and -30 degrees, but this is probably coincidental since the stress conditions around a two-slot array are not, in general, the sum of the individual stress states.The decrease in K when 0 is positive agrees with the results of Bombolakis (1963). This behavior, i.e., a de-crease in K when overlap occurs, suggests that a partial fracture, which is composed of a few connected cracks, tends to decrease K of cracks which it overlaps and there-fore decreases their chance of propagating.
The plots of KN v (d b)0.5 do not follow the relationship found by Irwin (1958) for the decrease in stress with distance from the end of a crack. This is not surprising since Irwin stated that the relationship was true only if the distance were small compared to the radius of curvature of the crack tip. However, the plots of KN vs ( d )0.5 are approximately linear, especially for
= 6 and 7, and the slope of the straight lines for the
different 0 values are more or less consistent (Table 3). It is expected that the slope will decrease for decreasing
d - b) since the value of KN must equal unity when the cracks are isolated.
For b- = 0.27, the value of K for the most critical d
arrays, i.e., (= -20 degrees, was abput 35 per cent greater than for an isolated slot. This increase was apparently
in-dependent of the a ratio. This suggests that actual cracks
in such arrays would propagate when the applied stress is about 75 per cent of that required to cause growth of an isolated crack.
Comparison of the stress trajectories, shown in Figures
5
and 6, indicates that the directions of the principal stresses in the vicinity of a slot in an array were only slightly different than when the slot was isolated. This may be a reason why Bombolakis (1963) found that the direc-tion of crack growth was not influenced by the proximity of other cracks.UNIAXIAL COMPRESSION TESTS
Introduction
It was decided that partially-fractured samples should be obtained to study the growth of cracks leading to frac-ture. A considerable amount of crack growth occurs during the final stress increments and it is very important that the press-rock system remain stable so that intact speci-mens may be obtained. This stability was achieved by
incorporating a stiffening element into a conventional hydraulic press. The stiffening element, which was a
simply-supported beam, was placed in parallel with the rock specimen as shown in Figure 7. The beam was designed to carry most of the applied load and to limit the advance of the ram during fracture, (Appendix 2). There is a limit
to how closely one may approach fracture. Any system of finite stiffness would become unstable when the slope of the decreasing portion of the load vs deflection curve for the sample is greater than the load vs deflection curve of the entire system, (Appendix 3).
The samples used in this study were simplified modifi-cations of those used earlier, (Brace, 1964). and consisted of cylinders with a reduced central section (Appendix
4).
Sample in Parallel with Stiffening Element
Shaped samples were chosen in preference to the common straight cylinders to avoid the barrelling and fractures induced by the elastic mismatch at the ends of the specimen
(Seldenrath and Gramberg,
1958,
Salmassy, et al.,1955).
Experimental Procedure
Two strain gages were placed on each sample, one
parallel with, the other normal to, the direction of applied compression. In the initial uniaxial compression tests, the heads of the sample failed along a vertical fracture which passed through the fillets. In the subsequent tests, steel rings, as shown in Figure 7, were positioned around the heads of the sample to prevent the premature failure. The sample was placed on a load cell and the stiffening element was positioned between the hydraulic ram and the specimen, The load cell consisted of a short cylinder of hardened steel to which four strain gages had been attached. It was calibrated to give the load on the sample in terms of the resistance changes of the strain gages, (Appendix
5).
The stiffening element is only of value during the later stages of the fracture process. Therefore, in order to minimize the total force exerted by the ram, the sample was ground to a final length such that the steel beam did not come in contact with the steel supports until the rock had been stressed to about 75 per cent of its fracture strength.The leads from the load cell and the two strain gages mounted on the specimen were connected to a three-channel recording system which gave a graphic trace of strain vs load, (Appendix 6). A convenient scale of the graphical tracing was obtained by calibration of the recorder prior to each test.
The stress was applied by manually pumping the
hydraulic ram, Since it was felt that the growth of cracks might be time-dependent, the stress application during most tests was interrupted at various stress levels for periods of about five minutes.
The stress was decreased when excessive lateral
strain and pronounced surface cracks indicated that fracture was impending. A plastic tube, slightly shorter than the steel supports, was positioned around the sample to protect the observer in the event of an explosive fracture.
Experimental Results
The experimental results of the uniaxial compression tests are grouped according to the manner in which the test was performed and the resulting deformational characteristics of the sample. The three groups, in order of presentation, consist of the results of (1), discontinuous tests, i.e. the stress was held nearly constant at various stress levels
for a few minutes; (2), cyclic tests, where each cycle went to a higher stress; and (3), tests which indicate the effect of strain rate.
Discontinuous Tests
In these tests the sample was continuously stressed to somewhat greater than one-half the fracture strength before the stress was held essentially constant for five-minute periods. The stress was then further increased by an arbitrary amount and again held nearly constant. This process was continued for some samples to just below the fracture strength. The load was then decreased discon-tinuously, the waiting periods occurring at the same stress levels as during the stress build-up.
A typical example of the stress-strain curves obtained from samples tested in this manner is shown in Figure 8. Both the lateral and axial strain are plotted as a function of stress.
The deformation which occurred during the five-minute waiting periods is represented by the rather large lateral strains at nearly constant stress and the relatively small axial strain. As the fracture strength was approached, the lateral strain increased .rapidly with stress whereas the axial strain retained a relatively near-linear relationship
Stress vs StraiO Uniaxial Compression Saimple W-11 2500 301 Strain, x 106 500 1000 1500
with stress. On the return curve, i.e., decreasing stress, there was essentially no detectable time-dependent deforma-tion. After the stress had been completely removed, there was a substantial permanent lateral strain (about 0.1 per
cent or of the order of one-third the maximum lateral strain), but little or no permanent axial strain.
The volumetric strain, AV , was calculated from the
axial and lateral strains. In this study, the lateral strain gages extended nearly halfway around the circum-ference of the sample. This is necessary for determining
the volumetric strain of an anisotropic material, (Appendix 7). The plot of volumetric strain vs uniaxial compressive stress corresponding to the stress-strain diagram of Figure 8 is presented in Figure 9.
In general, the volume decreased rather rapidly during the initial stress build-up and then decreased at a rather constant rate with stress up to about
5o
per cent of the fracture strength. From this point, to about 75 per cent of the fracture strength, the rate of volume decrease de-creased with increasing stress. At about 75 per cent of the fracture strength, the volume was a minimum. It thenincreased with further increase in the applied stress. At just below the fracture strength the volumetric strain passed through zero and became positive. The greater part of this increase in volume was retained when the stress was
Stress, kb Figure 9 2500 -2000 1500 1000 50 0--500 -1000 -1500
-TABLE 4
Results of Discontinuous Uniaxial Compression Tests
Slope of
Linear Stress at
maximum Portion of Permanent Departure Maximum Young's
Av_
C~ . lmetric FromStress Modulus rn Linearity
Sample (kb) (mb) (mb
)
(x 10-6) (kb) W-81.52
0.58o 0.64 2250.90
W-9 1.07 0.562 0.79 50 0.95 W-11 2.28o.582
0.60
1800 1.10 W-12 2.28 0.5680.76
16001.15
W-14 2.18 0.576 0.71 1800 0.92 (0.574t
(0.70 + (1.00t
0.012) 0.10) 0.15)there was a pronounced increase in volume during the five-minute waiting periods.
The results of the discontinuous uniaxial compression tests are presented in Table 4. The maximum error,
(Appendix
8),
of the maximum stress and maximum Young'smodulus are about 2 and
4
per cent, respectively. The maxi-mum error of the slope of the linear portion of vs IfV -
3
and the permanent volumetric strain are about t and 6 per cent, respectively. The maximum error of the stress at the departure of the 7V vs Cr- curve from linearity is
approxi-3
mately 10 per cent.Cyclic Tests
In these tests the sample was discontinuously stressed to a certain magnitude and then unloaded. It was then again stressed in similar manner but to a greater stress. This cyclic procedure was repeated until the sample had been
stressed to about 90 per cent of the fracture strength. Figure 10 are the stress-strain curves obtained from these cyclic tests. Both the axial and lateral strain were recorded as a function of stress.
The volumetric strain was computed from the axial and lateral strains. The plots of AV vs T are presented in
r
13
Figure 11.All the plots of vs G_ show a rather rapid
V
-
3
decrease in volume during the initial stress build-up. After this rapid decrease, the variation of vs T~ was
T -
3
essentially linear up to the maximum stress of the previous cycle. For example, the A
V
vs plot for the cycle to
-1.38 kb remains linear up to approximately 1.03 kb, the
maximum stress to which the sample was previously cycled. The slope of the linear portion of the curves decreased markedly for the last two cycles.
During the stress release, the plots of - vs G
V -
3
were linear during a substantial amount of the unloading portion of the curve. The last three cycles showed a pro-nounced permanent volumetric strain after the load was
completely released.
The results of the cyclic uniaxial tests are presented in Table
5.
The maximum errors, (Appendix 8), are the same as reported for the discontinuous uniaxial compression tests.1.5 LATERAL A*IAL Stress kb 1.00.5 -Stress v4 Strain Uniaxial Compressioni Sample W-17 0 0 800 1600 2400 3200 4000 4800 Strain x 10 6 Axial strains are negatitve
TABLE
5
Results of Discontinuous Cyclic Uniaxial Compression Tests
Sample W-17
Slope of
Linear Stress at
Maximum Portion of Permanent Departure
Maximum Young's vs r3 Volumetric From
Stress Modulus v - 3 Strain Linearity
Cycle (kb) (mb) (mb~) (x 10-6) (kb) 1 0.69 0.558 --- 50 2 1.03 0.572 0.74 100 ---3 1.38
0.565
0.74 160 1.04
1.72 0.593 0.47 350 1.35
2.11 0.558 0.30 1200 1.6 (0.572t
0.021)1500 1000 500 -500 -1000 -1500 2.0 0 0.5 1.0 1.5 Stress, kb
Tests Indicating Effect of Strain Rate
The stress vs strain and volumetric strain vs stress curves for the samples stressed discontinuously have been presented (Figures 10 and 11, respectively). For these tests, the average axial strain-rate was about
10~
min~1 . The vs 6'3 curves for a sample which was cyclically stressed at an axial strain rate of about 10-3 min~ to ever-increasing values of the maximum stress are presented in Figure 12.Compared with the pronounced hysterisis of the vs
T' curves for the discontinuous tests, the sample stressed at the faster strain rate experienced relatively little non-elastic deformation.
The results of the cyclic tests conducted at an axial strain rate of about 10-3 min~1 are presented in Table 6. The maximum errors, (Appendix 8), are the same as reported for the discontinuous uniaxial compression tests.
500 -Volumetric Strain vs Strlss &V6--x106 Sample W-16 0 500 --1000- -VI -1500 0 0.5 1.0 1.5 2.0 Stress, kb
TABLE 6
Results of Continuous Cyclic Uniaxial Comprssion Tests
Sample W-16
Slope of
Linear Stress at
Maximum Portion of Permanent Departure Maximum Young's Vvs ' rVolumetric From
Stress Modulus Linearity
Cycle (kb) (mb) (mb~ (x 10-6) (kb) 1 0.54 --- --- 0 2 0.81 0.585 --- 0 ---3 1.09 0.570 0.72
50
---4
1.37 0.582 0.74 60 1.05 5 1.66 0.582 0.71 85 1.25 6 1.94 0.583 0.65 190 1.70 (0 577 + 0.008)Discussion of Experimental Results
The results of the uniaxial compression tests have provided insight into the stress at the onset of crack
growth, the direction of propagation, and the effect of new cracks on the subsequent deformational behavior of the
sample.
The discussion of the experimental results is divided into two parts. The first contains detailed interpretations of the stress vs strain and volumetric strain vs stress
curves in terms of the mechanics of crack growth. This first section follows the same order of presentation as in the
preceding section. The second part is a description of the thin and polished sections of the fractured specimens.
Discontinuous Tests
The stress-strain diagram , Figure 8, is characteristic
of this type of test. The stress vs axial strain curves show a generally linear behavior, little or no permanent strain, and a moderate hysteresis loop. The stress vs lateral strain curves, on the other hand, show that the strain increased markedly with stress, especially near the fracture strength, and that there was a large hysteresis loop and permanent strain.
The characteristics of the volumetric strain vs
stress diagram, shown in Figure 9, are felt to be signifi-cant and are interpreted as follows: Up to about
0.55
kb the volume decreased rather rapidly. This was due to the closing of cracks oriented so as to close under the applied stress. Similar effects due to the closing of cracks have been reported by various investigators: Brace (1965) ex-plained the initially low value of Young's modulus andhigh compressibility, characteristic of certain rock types, as due to the closing of cracks under low values of the applied stress, and Birch (1961) accounted for the rapid increase in the velocity of sound with applied pressure as due to a decrease in porosity.
Above approximately 0.55 kb the variation of the volumetric strain with stress was essentially linear up to a stress of about 1.10 kb. Walsh (1965b) has studied the case of an isotropic crack-filled solid. When such a material is stressed uniaxially, one does not obtain the
intrinsic values of Young's modulus and Poisson's ratio because of the frictional sliding of opposing crack faces.
However, according to Walsh's analysis, the volumetric strain experienced by the sample during a uniaxial stress increase is one-third that experienced by the intrinsic material during a bulk compressibility test when the confining
compressibility of Westerly granite is about 2 mb~ (Brace, 1965).,Therefore, the slope of the linear portion of the
vs plot should have a slope equal to 0.66 mb~ .
The average of the slopes for
5
tests was 0.70 + 0.10 mb-1, (Table4).
The onset of crack growth occurred at the point
where AV vs 0 departed from the linear portion of the
curve. For the Westerly granite, the average value of the axial stress at the onset of crack growth was 1.00
t
0.15
kb or roughly50
per cent of the fracture strength. This fact has important implications with regard to the Griffiththeory of fracture. The Griffith theory or its present
modification (McClintock and Walsh, 1962) cannot be expected to predict the compressive strength of materials if crack growth occurs in such materials at stresses less than the fracture strength.
As the stress was increased, the departure of the Vvs0"' curve from the tangent to the linear portion in-creased. Thus, crack growth continued as the stress was raised. The fact that the growth of cracks was time-depen-dent.was established by noting the increase in volume during the five-minute intervals of essentially constant stress. In room temperature tests on silicate materials, such as Westerly granite, this increase in volume could only be
As the fracture strength was approached, the volume increased rapidly with increasing stress. This volume increase represents the increase in the amount of crack growth which occurred prior to fracture.
There was a significant permanent increase in volume of the sample after the load had been completely removed. This was a result of the extensive crack growth which occurred during the deformation of the sample. Referring to the stress-strain diagrams, one notes that the permanent change in volume was almost entirely accounted for by a permanent increase in the cross-sectional area of the speci-men, i.e., there was little or no permanent axial strain. This suggests that the predominant direction of crack growth was vertical, i.e., parallel to the direction of the applied stress. The fact that crack growth was vertical was esta-blished by performing a compressiblity test on the sample before and after the uniaxial test. It was found (Chapter III) that the linear compressibility in the axial direction was essentially unchanged but the lateral compressibility was much greater subsequent to the uniaxial test.
Cyclic Tests
The cyclic uniaxial test, with each cycle proceeding to a higher stress level than the preceding test, provided insight into the effect of crack growth on the deformational
behavior of the material. The stress vs strain diagrams, and the volumetric strain vs stress diagrams, are presented in Figures 10 and 11, respectively.
The maximum value of Young's modulus was computed from the slope of the stress vs axial strain diagrams. The maximum values of Young's modulus for each cycle are
presented in Table
5.
It is interesting to note thatYoung's modulus was nearly the same for each cycle even though extensive crack growth had occurred as shown by the plots of A vs .
Unlike Young's modulus, certain characterisitics of the plots of volumetric strain vs stress changed with each cycle. As anticipated, from the results of the discon-tinuous tests, the plots of Vvs 3 for the cycles up to
V -
3
0.69 and 1.03 kb indicated no crack growth. The A 4vs3
V -
3
plot for the cycle up to 1.38 kb departed from the linear portion at approximately 1.0 kb, indicating the onset of crack growth. The plot of A _vs T for the next cycle,
N
3
however, departed from the linear portion at the maximum stress to which the sample had been previously stressed, i.e., about 1.3 kb. Similarly, the curve for cycle to 2.11 kb departed from the linear portion at about 1.6 kb.
These results indicate that new crack growth did not occur until the previous maximum stress had been exceeded. Therefore, the average axial strain rate of about
10~4
min 1was slow enough to permit almost complete crack growth to occur at each stress level.
When the sample was stressed to a value less than required to initiate crack growth, the slope of the linear portion of the A vs 07 curve is approximately equal to
V -
3
one-third the intrinsic bulk compressibility, (Table
5).
However, once crack growth had occurred, the slope of the linear portion decreased with each cycle. This means that the lateral strains at each stress level (above approxi-mately 0.55 kb) were greater than in the previous cycle. The compressibility tests (Chapter III), performed between each of these uniaxial cycles, show that the new crack growth was essentially vertical, i.e., parallel to the direction of uniaxial compression, and that crack growth was more extensive at the conclusion of each sub-sequent cycle.
Thus, the evidence indicates that during the tests to 1.38 kb and above, the sample contained newly-formed vertical cracks which open during the stress build-up and that new crack growth did not occur until the maximum stress of the preceding tests had been exceeded.
The actual configuration of these vertical cracks is not absolutely clear. It is important in choosing a model for theoretical studies to know if the vertical cracks are
the thin and polished sections (presented later in this
section) does not provide conclusive evidence. However, the plots of A Vscvs suggest that some vertical cracks have grown out of inclined cracks. The evidence for this con-clusion can be better appreciated after considering the deformation of these two types of cracks when subjected to a uniaxial compressive stress.
Consider first the case of an isolated crack which is parallel to the direction of the uniaxial compressive stress. For purposes of discussion, such a crack may be approximated as a narrow ellipse as shown in Figure 13.
Inglis (1913) has shown that the maximum lateral dis-placement, EL ' of a crack so oriented is related to the crack dimensions, Young's modulusand the applied stress according to
L = A .a
where A is a constant of proportionality of about unity.
The deformation of such a crack is completely reversible. If the difference between the actual and intrinsic volu-metric strain during the linear portions of the A vs
I
\
I'l
I I
'
Elliptical Crack in Uniaxial Compressive Stress Field
would expect a smooth curve as the stress was released. In addition, the slope of the linear portion during increasing stress of each cycle should agree with the slope of the descending curve of the preceding cycle.
The second case, of vertical cracks which have grown out of inclined cracks, is more complex and no analytic solu-tion exists which provides the deformasolu-tion of such a crack when subjected to stress. When the applied stress is very small the inclined portion of such a crack would be open,
(Figure lha). As the stress is increased, the inclined por-tion of the crack closes until the crack surfaces are in frictional contact (Figure 14b). As the stress is further increased, frictional sliding may occur so that the vertical portions of the crack open, (Figure
14c).
If the inclined portion is at an.angle such that frictional sliding is im-possible, the vertical portions of the crack might behave as isolated vertical cracks. The frictional stresses along the surfaces of the inclined crack change direction when the stress is released. As a result, the deformation of these cracks is not reversible simply by unloading and the vertical portions remain open at stresses less than that required to open them during the stress increase. Eventually the stress reaches a point at which the inclined portions of the crack open and the vertical segments are essentially as they were prior to the test. The permanent volumetric strain would be a result of the growth of new cracks and the incomplete closing of vertical cracks which had formed during an earlier cycle.a.
b.
c.
Schematic Behavior of an Inclined Crack with Vertical Extensions Subjected to Uniaxial Compression
The plots of
6
V- vs F (Figure 11) do not show the 3 (Fgri)features which would be expected if the material contained only isolated vertical cracks. The slope of linear portions during increasing stress was generally greater than the
slope of the descending curve of the preceding cycle and the curves during decreasing stress were not continuous, especially for the last two cycles. The frictional sliding associated with the inclined portion of the second type of crack would account for these characteristics.
Tests Indicating the Effect of Strain Rate
In general, the plots of vs for the samples stressed at an axial strain-rate of about 10~4 min 1 show a hysteresis loop and permanent volumetric strain (Figures 9 and 11). These characteristics are much less pronounced
during the tests at an axial strain rate of approximately 103 min-' (Figure: 13).
Direct comparison can be made between the results of the two samples which were cyclically stressed to
ever-increasing values of the maximum stress. The results of the samples stressed at average axial strain-rates of 10~4 min-1 are presented in Tables
4
and5,
respectively. The effect of axial strarate on the extent of crack growth is in-dicated by the difference in slopes of the linear portions of the A vs G. curves and the permanent volumetric strain.The slope of the linear portion of the A vs T
V -
3
curves for the faster tests remained essentially constant. In contrast, the slope of the linear portions for the slower tests decreased markedly, especially after the third cycle. This decrease in slope is attributed to the opening of
vertical cracks, either isolated or associated with in-clined cracks, and indicates that crack growth was more extensive during the slower tests.
The maximum stress of the cycles at the different strain rates did not correspond exactly. However, it is apparent that a considerably greater amount of permanent volumetric strain occurred during the tests conducted at an average axial strain rate of
10~4
min 1 . This is additional evidence that crack growth was more extensive during the slower tests.Description of Fractured Samples
After the uniaxial compression tests, the samples were cast into a mold (Stycast 1916) and sawed in half normal to the fracture surface so that both a thin sec-tion and a polished secsec-tion could be obtained from each sample. In the partially fractured samples the orientation of the potential fracture surface was indicated by the sur-face cracks.
There was pronounced crack growth along the edge of the thin sections which corresponded to the region of the surface cracks observed during the test. However, it was impossible to distinguish between the crack growth which occurred during the test and that due to preparation of the thin section. There was no discernable crack growth in the central region of the partially fractured specimens.
The details of crack growth and partial fractures were best shown by the thin and polished sections of sample
W-4.
Even though the sample completely fractured, the polished end pieces clearly revealed the development of partial fractures, as shown in Figure 15. The zig-zag whitelines are the partial fractures filled with polishing
abrasive. The darkening of the sample in the region of the fracture is probably due to intrusion of the casting material. An enlarged view of the fracture region is shown in Figures
16 and 17.
Figure 16 is particularly interesting since it shows the development of two partial fractures approximately parallel with the fracture surface. In addition, the par-tial fractures and the fracture surface are roughly equally-spaced, reminiscent of parallel, equi-distant faults. The partial fractures are composed of inclined and near-vertical segments. The most common inclination, from vertical, of the inclined segments is about 40 degrees. On the whole, the inclined segments are en echelon.
Photographs of the thin section made from the other half of the end piece shown in Figure 16 are presented in Figure 18. They were obtained along a traverse of the two partial fractures. The direction of 0- is vertical. Exact
3
correlation between the thin and polished sections cannot be expected because of the intervening material removed during sawing and polishing. Even so, agreement is good and indicates that the shape of the partial fractures did
1
not change appreciably over a distance of about 67of an inch. This distance is equal to about three times the average grain diameter.
It can be seen that the partial fractures follow a rather tortuous path through and around the individual grains. The inclined segments are sometimes along grain boundaries as shown by the manner in which the partial
frac-ture on the left passes around the grain in the upper third of Figure 18. The linear nature of the inclined
trans-granular cracks suggests that they existed prior to the uni-axial test since we have no reason to assume that, in
compression, a crack will grow in a direction other than nearly parallel with T. This is shown, for example, by the manner in which the partial fracture on the right, hand side passes through a grain in the lower third of Figure 18. Photographs of a partial fracture in sample W-16 are shown
in Figure 19. The direction of gd is vertical. Here,
par-3
One is restricted in drawing conclusions on the development of a fracture without knowledge of the third demension. However, the agreement between the thin and polished sections, with regard to the shape of the partial fractures, suggests that the views shown in Figure 18 are, in general, representative, at least for a distance of a few grain diameters.
For additional descriptions of fractured specimens the reader is referred to the Discussion of Experimental Results, Chapter IV. The interpretation of the features observed in the fractured material is presented in Chapter V, CONCLUSIONS.
Detail of Crack Growth Sample W-4
b Microscopic View
COMPRESSIBILITY TESTS
Introduction
Walsh (1965a) made a theoretical study of the effect of cracks on the compressibility of rocks. He considered rock to be an elastic isotropic material containing randomly-oriented narrow cracks. With this model he derived an
expression for the effective compressibility in terms of the compressibility of the solid material and the rate of change of porosity with external pressure. His analysis led to the result that the porosity of a rock containing narrow cracks could be determined from the compressibility curve by extending the linear portion of the curve back to zero pressure and noting the intercept on the volumetric strain axis, (Appendix 9). The linear portion of the com-pressibility curve represents the comcom-pressibility of the
solid material.
Brace (1965) measured the linear compressibility of several rocks up to 10 kb. For the Westerly granite he found that the initial compressibility was greatest normal to the direction of the longest grain boundaries.
Con-sidering grain boundaries as narrow cracks, Brace found that the relative initial linear compressibility was related to
Observation of the thin sections used by Brace in determining the grain boundary pattern revealed the exis-tance of numerous trans-granular cracks. The thin sections were mapped and it was found that the cracks had a preferred orientation, (Appendix 10). The preferred orientation
could qualitatively account for the directional charac-teristics of the initial linear compressibility determined by Brace. In particular, the most compressible direction was most nearly normal to the preferred direction of cracks.
The results of Walsh and Brace suggested that the com-pressibility test would be a useful technique in determining two characteristics of crack growth which occur during the uniaxial compression tests. The direction of crack growth
could be established by comparing the linear compressibilities before and after a uniaxial test. The compressibility should be greater normal to the direction of crack growth than it was prior to the uniaxial test. In addition, support for
the idea that the permanent volumetric strain associated
with uniaxial compression tests is caused by new crack growth could be established by measuring the increase in porosity due to cracks. The increase in porosity should agreg, with the permanent volumetric strain if the pressure is increased sufficiently to close all the new cracks.
It was decided to subject the sample to several uni-axial compressive tests with each test carried to a higher
stress. The presence of new cracks could then be determined by comparing the compressibility of the undeformed rock with
the compressibilities obtained after each uniaxial test.
Experimental Procedure
The samples were circular cylinders with a reduced central section and of the same dimensions as used during the uniaxial compression tests (Appendix
4).
Axial and lateral strain gages were attached directly to the specimen and the entire sample was jacketed with silicone rubber(Appendix 11). The sample was placed in the triaxial cham-ber shown in Figure 20 which was filled with kerosene or machine oil.
The linear compressibility of the virgin sample was measured to 1 kb. The silicone rubber was then removed from
the heads of the specimen and the sample was subjected to a uniaxial compressive stress of 0.69 kb. The heads were rejacketed and the second compressibility test was run. This process was repeated five times. The maximum uniaxial stress of each subsequent cycle was increased by approxi-mately 0.35 kb. The maximum pressure of the compressibility tests was 1 kb. This value was chosen to avoid the diffi-culties associated with higher pressures and because Brace
(1965) found that most of the porosity due to narrow cracks
To hand pump
Intensifier-separator
Piston
Sleeve
Side closure
containing electrical leads and pressure transducer
Pressure vessel
O-ring
Triaxial Chamber
(Taken from Brace, 1964)