HAL Id: hal-02064988
https://hal.archives-ouvertes.fr/hal-02064988v2
Submitted on 19 Jun 2019
HAL is a multi-disciplinary open access
archive for the deposit and dissemination of
sci-entific research documents, whether they are
pub-lished or not. The documents may come from
teaching and research institutions in France or
abroad, or from public or private research centers.
L’archive ouverte pluridisciplinaire HAL, est
destinée au dépôt et à la diffusion de documents
scientifiques de niveau recherche, publiés ou non,
émanant des établissements d’enseignement et de
recherche français ou étrangers, des laboratoires
publics ou privés.
Experimental demonstration of three-photon Coherent
Population Trapping in an ion cloud
Mathieu Collombon, Cyril Chatou, Gaétan Hagel, Jofre Pedregosa-Gutierrez,
Marie Houssin, M. Knoop, Caroline Champenois
To cite this version:
Mathieu Collombon, Cyril Chatou, Gaétan Hagel, Jofre Pedregosa-Gutierrez, Marie Houssin, et
al.. Experimental demonstration of three-photon Coherent Population Trapping in an ion cloud.
Physical Review Applied, American Physical Society, 2019, 12, pp.034035.
�10.1103/PhysRevAp-plied.12.034035�. �hal-02064988v2�
cloud
M. Collombon, C. Chatou, G. Hagel, J. Pedregosa-Gutierrez, M. Houssin, M. Knoop, and C. Champenois∗
Aix Marseille Univ, CNRS, PIIM, Marseille, France (Dated: June 18, 2019)
A novel protocol of interrogation based on coherent population trapping in an N -level scheme atomic system leads to dark resonances involving three different photons. An ensemble of several hundreds of radio-frequency trapped Ca+ions is probed by three lasers simultaneously locked onto
the same optical frequency comb, resulting in high-contrast spectral lines referenced to an atomic transition in the THz domain. We discuss the cause of uncertainties and limitations for this method and show that reaching a sub-kHz resolution is experimentally accessible via this interrogation protocol.
PACS numbers:
The quantum interferences between two excitation paths which are responsible for coherent population trap-ping (CPT) are an example of a quantum effect based on atomic coherences [1]. When this interference occurs in a Λ-scheme atomic system, the atomic population is trapped in a coherent superposition of the two ground sub-states, dressed by the coupling photons. If the two ground dressed sub-states are stable, the excited state is no more populated. This population trapping can be ob-served by a dark resonance in the fluorescence signal [2] or by the cancellation of the laser absorption [3]. Two-photon CPT has proven its relevance as a resource for high precision measurement in magnetometry [4, 5] and in the so-called ”CPT-microwave clock” where no mi-crowave cavity is needed anymore [6–8]. The best re-ported performances concerning short term stability are reached with vapour cell clock with fractional frequency stability of few 10−13/√τ [9, 10]. Cold atom clocks are expected to perform better regarding long term stability and an instability of the order of 3 ×10⁻¹³after one hour of averaging time is reported in [11]. In this paper, we report the observation of a three-photon CPT in a cold cloud of trapped ions and discuss its main causes of shift and broadening.
In CPT-microwave clocks, two phase-coherent lasers perform optical spectroscopy of the GHz-transition be-tween hyperfine sub-levels of the heaviest alkalies Rb and Cs. When the laser difference frequency matches the ground-state splitting, the atomic population is trapped in a dark state and the optical signal is used to reference this frequency difference to the GHz-transition. Sub-Doppler spectroscopy is reached by exploiting the Lamb-Dicke effect [12] which provides a first-order Doppler can-cellation whenever the displacement of the absorbers over successive excitation is smaller than λ/(2π) with λ the transition wavelength, of the order of centimeters for mi-crowave transition and micrometers for optical
transi-∗[email protected]
tions. Experimental results in room temperature cells where the atom mean-free-path is reduced to millimeter scale by filling with buffer gas or by scaling the cell size to millimeter prove that the Lamb-Dicke regime can be reached for the microwave transition even if it is excited by means of two lasers operating in the optical range. The contrast of the dark line is then limited by the re-laxation of the coherence between the two sub-states. It can be induced by the collisions of the atoms with the buffer gas and/or the cell glass [13] and by the noise on the relative phase between the optical fields [11, 14].
We investigated in [15] a three-photon CPT which oc-curs in a four-level atomic system showing a N -shaped laser interaction scheme, where three out of the four in-volved states are stable or metastable. Extending from two to three lasers involved in the dark resonance con-dition allows the cancellation of the first order Doppler effect by a geometric phase matching of the three laser wave-vectors [16–20], simulating a Lamb-Dicke effect with an effective infinite wavelength. This example of N -level scheme can be found in the heaviest alkaline-earth ions Ca+, Sr+ and Ba+[15] and in alkaline-earth-metal neutral atoms like Sr and Yb [20]. We report here the first observation of a three-photon dark resonance in a cloud of Ca+
ions, stored in a linear quadrupole trap, and laser-cooled by Doppler laser cooling. In this ion, the three optical fields required to build the coherent dark state lie in the optical and near infra-red domain, spanning more than one octave. Therefore, their phase coherence is insured by an ultra-stable laser through a simultaneous lock on an optical frequency comb (OFC) [21, 22]. The dark resonance condition defines a combina-tion of the three optical frequencies, which is referenced to a magnetic dipole transition at 1.82 THz.
In the following, we first present the experimental con-ditions for observing a three-photon dark resonance in the fluorescence of a cloud of trapped ions. We review the major effects which contribute to the linewidth, fre-quency shift and contrast of the dark line as there are the Doppler effect, the Zeeman effect and power-induced
2
effects.
CONDITION FOR OBSERVATIONS OF A THREE-PHOTON CPT
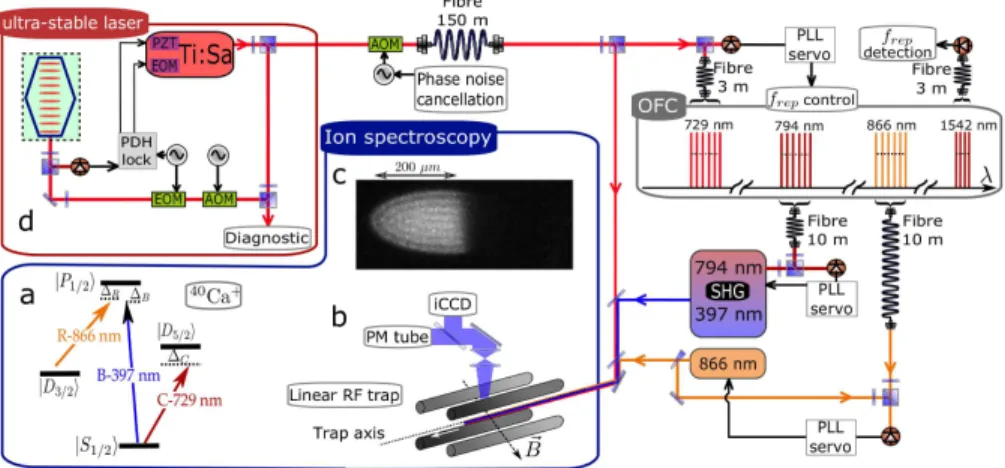
The three-photon dark line is observed in the laser-induced fluorescence emitted by a cloud of 40Ca+ ions, stored in a linear RF quadrupole trap. The calcium ions are Doppler laser-cooled on their resonance transition 4S1/2→ 4P1/2at 396.85 nm (label B). This transition is not closed and once in the excited state 4P1/2, the ions can decay to the metastable state 3D3/2 with a proba-bility β = 0.064 [23]. Keeping the ions within the cool-ing cycle thus implies a second ”repumpcool-ing” laser, tuned to the dipole transition 3D3/2 → 4P1/2 at 866.21 nm (label R). The third laser involved in the CPT pro-cess is resonant with the electric quadrupole transition 4S1/2 → 3D5/2 at 729.15 nm (label C, see Fig. 1, a for the transition scheme).
Because it is based on the second order expansion of the interaction Hamiltonian, this last transition has a typical coupling strength which is 8 orders of magnitude smaller than the one induced on the dipole transition in-volved in the laser cooling [24]. Despite of the weakness of the laser-atom interaction on this transition, it can play a major role in the internal state dynamics provided that a resonance condition is fulfilled [15]. By a partial diagonalisation of the system, this condition can be ex-trapolated from two-photon Λ-scheme dark resonances [1] and it writes
∆R= ∆B− ∆C− δC (1) where ∆R, ∆B, ∆C are the one-photon detunings of the three lasers and δC is the light-shift induced by the quadrupole coupling on the 729 nm transition [15] (see appendix ). The trapping state is a coherent superpo-sition of the three stable and metastable dressed states that is not coupled by laser excitation and once trapped in this state, the ions do not emit any photon.
When fulfilled, the three-photon resonance condition implies a strong relation between the three laser frequen-cies
ωR+ ωC− ωB+ δC= ωT Hz (2) with ωT Hz the frequency of the magnetic dipole tran-sition between 3D3/2 and 3D5/2, which appears as the reference transition. The frequency ωT Hz is 1.82 THz in Ca+
and its absolute value is known with a ±8 Hz uncer-tainty through Raman spectroscopy on a single trapped ion [25, 26]. Considering the typical intensity and detun-ing for the laser at 729 nm, δC is below 100 Hz and can be neglected in the results reported in the following.
In the experiments presented here, the three lasers co-propagate along the symmetry axis of a linear quadrupole
RF-trap (see Fig. 1,b) and the effective wave-vector ∆~k controlling the first order Doppler effect on the dark line is the one of the magnetic dipole transition kT Hz = 2π/λT Hz with λT Hz the 3D3/2-3D5/2 transition wave-length, equal to 165 µm. The quadrupole trap is de-scribed in [27, 28], its main characteristics are an inner radius of 3.93 mm for a rod radius of 4.5 mm [29] and an RF trapping frequency of 5.2 MHz. For the work pre-sented here, it is operated with an RF-voltage difference between neighboring rods of 826 Vpp (Mathieu parame-ter qx= 0.24) and a typical cloud contains a few tens to thousands ions. The Doppler-laser cooling drives the ion cloud from a gas, through the liquid, to a crystal phase [30] with a temperature estimated to be of the order of 10 mK. Once in the liquid and crystal phase, the ion cloud forms an ellipsoid [31, 32] with a diameter rang-ing from 80 to 280 µm and a length rangrang-ing from 120 to 740 µm for a number of ions comprised between 40 and 2750 (see Fig. 1,c). The 397 nm and 866 nm lasers have an elliptical cross-section, with an aspect ratio of 2 and a mean-squared diameter at the position of the cloud equal to 4.0 mm and 4.7 mm, respectively. The laser in-tensity and wave-vectors can be considered uniform all over the ion cloud. The 729 nm laser has the smallest size with a waist diameter measured to 300(±20) µm. It is still larger than the largest of the cloud diameters but its intensity is not uniform over the largest clouds. Keeping all the atoms inside the three laser beams cancels any broadening induced by finite interaction time due to atom motion, which is an identified broadening cause of two-photon CPT lines when observed on an atomic beam or a gas in a cell [7, 33, 34].
For the observation of the dark lines, the three involved lasers are admitted continuously on the cloud. As well-known for the two-photon CPT, the stability of the phase relation between the three dressing lasers is mandatory to reach a stationary dark state. To that purpose, we use a commercial OFC to transfer the phase stability be-tween the three lasers[22]. We take advantage of an ultra stable laser at 729 nm (relative Allan variance of 10−14at 1 s) to serve as a local reference for the offset-free OFC, produced by frequency difference in a non-linear crystal (TOPTICA DFC CORE+). The OFC repetition rate frep is 80 MHz and three dedicated coherent outputs at 729, 794 and 866 nm allow three simultaneous phase locks (the 397 nm radiation is produced by second harmonic generation). First, the OFC is locked onto the 729 nm laser by a phase-locked loop (PLL) using the beat signal of the ultra stable laser and the closest comb eigen-mode. Then, the 794 and 866 nm lasers are locked onto the OFC by the same technique. Their frequency measurement requires to identify the indexes NB,R,C of their closest eigen-mode emitted by the OFC, and to measure the rel-ative value of the laser frequency compared to this eigen-mode which is bound by ±frep/2. The indices NB,R,Care determined without ambiguity with the help of a
wave-FIG. 1. a : Transition scheme for the 3-photon CPT in Ca+
, b : Schematic of the experimental set-up : the three laser beams are propagating along the trap symmetry axis, the linear radio-frequency trap is represented by its four rods, the laser induced fluorescence is recorded on a photomultiplier (PM tube) for photon counting and a intensified CCD camera for spatial resolution of the fluorescence. c : picture of a cloud made of 710 (±35) ions, the ions shelved in the metastable D5/2 state or
trapped in the coherent superposition are dark and split from the bright ions because they do not feel the radiation pressure induced by the cooling laser on the bright ions. d: set-up for the laser phase-lock, based on an OFC locked onto an ultra-stable Ti:Sa laser. AOM : acousto-optic modulator, EOM : electro-optic modulator, PDH : Pound-Drever-Hall, PLL : phase-lock loop, SHG : second harmonic generation.
meter with an accuracy of ±10 MHz. The uncertainty on each laser frequency measurement lies in the kHz range and is due to NB,R,C × σrep with σrep the uncertainty of the repetition rate equal on average to 1.5 mHz (one standard deviation). The resulting uncertainty on the deduced THz frequency benefits from the combination (NB− NR− NC) × σrepwhich is of the order of 34 Hz, two orders of magnitude lower than the optical frequency uncertainty.
Spectra are observed when collecting the photons emit-ted at 397 nm on the 4P1/2→ 4S1/2transition while the frequency of the R-laser is scanned. Typical laser powers are 10 to 20 mW at 397 nm (PB), 0.5 to 5 mW at 866 nm (PR) and 5 to 25 mW at 729 nm (PC). A complete spec-trum width is larger than 100 MHz and figure 2 shows a portion of such a spectrum, selected around the three-photon resonance condition as given by Eq. 1. By com-paring the two plots of Fig. 2, showing the fluorescence signal with and without the C-laser exciting the weak transition, one can deduce that some ions are ”shelved” in the metastable D5/2 state [35], independently of any resonant condition. The narrow features superimposed to the reduced signal (blue line) are the signature of the three-photon CPT. They correspond to the trapping of a fraction of the ions from the cooling cycle to the dark state. With the chosen detection scheme, it is not possi-ble to quantify the number of ions transferred from the metastable state to the dark state. More than half of the ions remain bright and thus are laser-cooled. By sym-pathetic cooling of the dark atoms [36], the ion cloud remains in a liquid phase throughout the complete
fre-quency scan, even if the radiation pressure is responsible for a spatial separation of the bright and dark ions (see Fig. 1,c). This sympathetic cooling offers the great ad-vantage of keeping constant the number of ions inside the laser beam during the whole recording.
4 6 8 10 12 14 16 18 1200 1400 1600 1800 2000 2200 2400 2600 ∆R (MHz) counts/ms
FIG. 2. Laser induced fluorescence of a cloud of laser cooled 560 (±25) ions versus the detuning of the repumping R-laser. The top curve shows photon counts when the cooling and repumping lasers are on (PB= 10 mW, PR= 1 mW). For the
lower curve, the 729 nm laser is also applied (PC = 12.1 mW).
Background : 570(±25) counts/ms
The splitting of the dark line into several pairs of lines is due to the local magnetic field which lifts the de-generacy of the Zeeman sub-states. A magnetic field of the order of 1 Gauss is applied and the three laser polarizations are linear, perpendicular to the trap axis and nearly perpendicular to the local magnetic field. We label each transition by a number mT Hz accord-ing to its Zeeman shift on the THz transition frequency
4
δZ(mT Hz) = mT HzµBB. With g3/2 and g5/2, the Land´e factors of the D3/2 and D5/2 states, and mJ(D3/2) and mJ(D5/2) the Zeeman substates involved in the tran-sition, mT Hz = g5/2mJ(D5/2) − g3/2mJ(D3/2). Table I gathers the transitions based on the largest couplings (quantified by their relative Rabi frequencies) imposed by the chosen laser polarization, relative to the local mag-netic field and controlled by the selection rules of dipole and quadrupole transitions [37]. The stability of each line
TABLE I. Zeeman sub-states of the two metastable states giv-ing rise to the observed THz transitions. The correspondgiv-ing THz transitions are labelled by the number mT Hz, defined by
the Zeeman shift δZ(mT Hz) = mT HzµBB (for the labelling
only, mT Hzis rounded in the assumption of a Land´e g-factor
equal to 2 for the electron). ΩCand ΩRare the Rabi
frequen-cies relative to the one of mT Hz= ±21/5. All the transitions
share the same Rabi frequency on the B-transition. mJ(D3/2) mJ(D5/2) mT Hz ΩC ΩR ∓3/2 ±5/2 ±21/5 1 1 ±1/2 ±5/2 ±13/5 1 1/√3 ∓1/2 ±3/2 ±11/5 1/√5 1/√3 ±1/2 ±3/2 ±7/5 1/√5 p2/3 ±3/2 ±3/2 ±3/5 1/√5 1
center frequency is limited by the long term fluctuations (> 100 s) of the local magnetic field measured to 0.4 mG (pk-pk). It contributes an uncertainty proportional to mT Hz and of the order of 1 kHz. The short term fluctu-ations of the total local magnetic field are measured to 6 mG (pk-pk) and are responsible for a mT Hz-dependent broadening of the order of 20 kHz (pk-pk). The Doppler effect on the three-photon dark lines is 415 times smaller than the Doppler effect on the optical cooling transition at 397 nm. It broadens the three-photon dark lines by 20 kHz (FWHM) for a sample at 10 mK. On the spectrum of figure 2, the measured linewidths range from 42 kHz to 218 kHz.
DEMONSTRATION OF THE THREE-PHOTON RESONANCE CONDITION
To prove that these extra lines result from the 3-photon process and are referenced to the THz transition, we fo-cus on the dark line defined by mT Hz = −13/5 because of its high contrast. The R-laser frequency ωRis scanned for different values of ωC in an interval of 16 MHz, while ωB is kept constant. The frequency step is 1 kHz and signal is accumulated for 150 ms at each step. Each scan is reproduced 4 times and averaged. Each observed line profile is fitted to a Lorentzian profile and the center of the line ωc
R is pointed with an uncertainty of the or-der of 1 kHz (1 σ) conditioned by the frequency step
and the signal to noise ratio. The frequency combina-tion ∆RCB = ωc
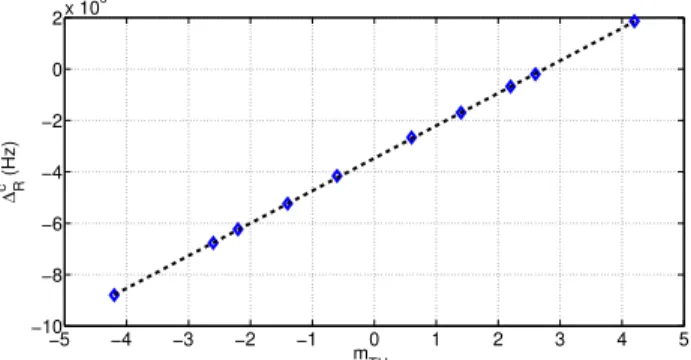
R+ ωC− ωB is expected to give access to the magnetic dipole transition frequency, once the experi-mental shifts removed, the Zeeman shift being the largest one identified. As some non-negligible light-induced ef-fects also shift the dark lines, and their dependence with the mT Hz number is not known, we do not use the aver-age frequency of the +mT Hz and −mT Hz line to deduce the unshifted frequency. We rather estimate the local magnetic field by exploiting several multiline spectra as the one of Fig. 2 and adjusting a linear fit of the dark resonance frequencies ωc
R(mT Hz) with the mT Hz values (see Fig. 3 where they are plotted with respect to the transition frequency ωP1/2D3/2 measured in [38]). The
−5 −4 −3 −2 −1 0 1 2 3 4 5 −10 −8 −6 −4 −2 0 2x 10 6 mTHz ∆R c (Hz)
FIG. 3. Dark resonance frequency ωc
R(mT Hz) of several
Zee-man transition versus their corresponding mT Hz factor. The
frequencies are plotted as detunings ∆cR(mT Hz), see text for
details. The black line is the linear fit used to calculate the averaged magnetic field seen by the ions.
Zeeman shift δZ(−13/5) of the mT Hz= −13/5 dark line is evaluated with an uncertainty of ±6 kHz dominating the total uncertainty of the THz frequency. As shown on Fig 4, the Zeeman corrected transition frequencies do not exactly match the 3D3/2 to 3D5/2 transition frequency fDD of reference [26] and are shifted from this reference value by amounts δf = ∆RCB− δZ(−13/5) − fDDwhich evolve between +5 and -15 (±6) kHz. These shifts are 3 orders of magnitude smaller than the range covered by the one-photon detuning ∆R and we consider that the three-photon resonance condition is demonstrated. Nev-ertheless, their plot against the mT Hz = −13/5 transi-tion detuning ∆ZR = ωRc − ωP1/2D3/2+ δ
Z
R(−13/5), with δR(−13/5) the Zeeman shift on the R-transition, showsZ a correlation between the shifts and the detunings that cannot be explained by any drifts in the experimental set-up, neither by the coupling on the quadrupole transi-tion δC. Dependence of the light-induced shift with the one-photon detuning is observed in two-photon CPT for a continuous laser excitation [7, 34, 39] and with a Ram-sey interrogation scheme [14, 40]. When they are not light-shifts induced by neighbour transitions, they are understood as induced by the relaxation of the
coher-ence between the stable and metastable states involved in the dark state. This relaxation can be due to collisions but most probably to laser relative phase diffusion in our cold atom system in ultra-high vacuum (with a pressure lower than 10−9 mbar). In the case of the three-photon CPT, the only light-shifts which can be responsible for a dark line frequency shifts are the one shifting the 3D3/2 or the 3D5/2Zeeman sub-states, as the other ones cancel in the three photon resonance condition (Eq. 1).
−8 −6 −4 −2 0 2 4 6 8 10 −3 −2 −1 0 1 2x 10 4 ∆RZ (MHz) δ f (Hz)
FIG. 4. Frequency shift δf on the 1.82 THz transition, for the mT Hz = −13/5 dark line observed for 5 different sets
of {ωC, ωB}, versus the one-photon detuning ∆ZR that fits
the three photon resonance condition. The Zeeman effect is removed from the shift and added to the measured one-photon detuning for the Zeeman shifted R-transition (Eq. 1). Fixed values : PB = 10 mW, PR = 2 mW, PC = 8 mW,
∆B= −24.94 MHz (errorbar= ±1 std).
POWER-INDUCED SHIFTS
In the case of a three-photon CPT, interpreted as a laser-mediated Λ-scheme [15], the relevant one-photon detuning is ∆R and the laser couplings on the two arms of the Λ-scheme are dominated by the laser excitation on the R-transition. This description of the N -level scheme is relevant for a strong enough coupling on the weak C-transition. This is confirmed by results reported on Fig. 5 where, contrary to a conventional light-shift effect, it takes a minimum laser power PC for the frequency shift to reach a value independent of this power. This behaviour is attributed to an ineffective Λ-scheme when the coupling on the quadrupole transition is too weak.
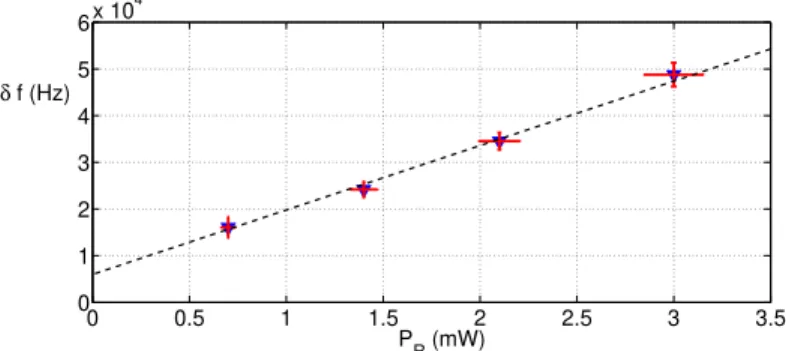
The dependence of the frequency shift with the power of the R-laser is shown on Fig. 6 for the mT Hz= −13/5 line. The results show a linear behavior of δf with PR which can be extrapolated for PR= 0 to 6.0(±3.4) kHz, showing that other experimental parameters are also re-sponsible for shifts. In the case of the mT Hz = −13/5 line, a light-shift effect can be induced by a small projec-tion of the R-laser polarisaprojec-tion along the magnetic field axis which then couples the 3D3/2, m = −1/2 sub-state to 4P1/2, m = −1/2 sub-state. The light-shift induced
4 6 8 10 12 14 16 18 20 4.5 5 5.5 6 6.5x 10 4 P C (mW) δ f (Hz)
FIG. 5. Frequency shift of the Zeeman sub-transition mT Hz=
−13/5 vs PC, the laser power on the quadrupole transition,
for one-photon detuning ∆Z
R=-10.6 MHz. The other laser
powers are PB=10 mW and PR=1 mW.
by the far detuned R-couplings to the 4P3/2 state is es-timated to values lower than 10 Hz. In the regime of pa-rameter used to observe the three-photon dark line, no significant dependence of the frequency shifts with the laser power PB could be observed, for power ranging 5 to 20 mW. Another kind of power-induced shifts have been identified in two-photon CPT-clock [39, 41]. They are due to the relaxation of the coherence between the stable and metastable states involved in the dark state and are proportional to the one-photon detuning. This extra ef-fect is certainly contributing to the total power-induced shift, due to the finite phase coherence of the three lasers [21, 22]. 0 0.5 1 1.5 2 2.5 3 3.5 0 1 2 3 4 5 6x 10 4 PR (mW) δ f (Hz)
FIG. 6. Frequency shift of the Zeeman sub-transition mT Hz=
−13/5 measured for different R-laser power PR (blue dots)
and for an effective one-photon detuning ∆Z
R= −7.74 MHz.
The dark line is a linear fit of this plots, with slope 13.8 ± 1.8 kHz/mW and limit shift for null power PRequal to 6.0 ±
3.4 kHz (1σ). The other laser powers are PB=19 mW and
6
METROLOGICAL PERFORMANCES
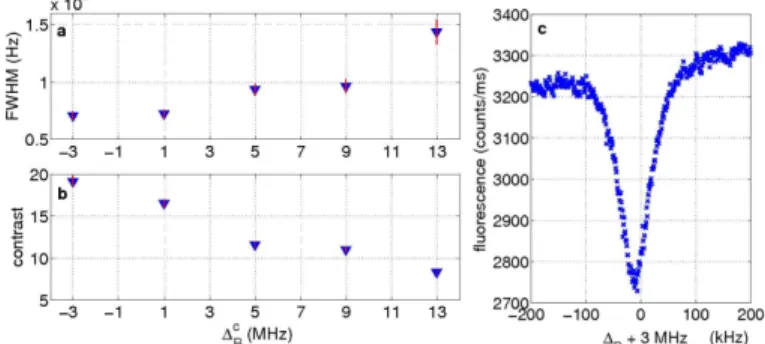
To quantify the metrological performances of the 3-photon CPT dark line as a THz reference, let’s assume these shifts are under control and focus on the linewidth, the absolute signal level as well as the contrast of the dark line. We recall that within the present experimental set-up, each line is broadened by a residual Doppler effect (estimated to a minimum of 20 kHz FWHM) and by a fluctuating Zeeman effect (estimated to 8.4 × mT Hz kHz pk-pk). Furthermore, in the range of our experimen-tal parameters, the observed power-induced broadening is only due to the coupling on the R-transition. The narrowest observed dark lines (linewidth of 45 kHz for PR = 0.7 mW) are the ones with the smallest coupling on the R-transition, identified by |mT Hz| = 11/5 and 13/5 (see table I). The maximum dark line contrast, reaching 25%, is observed for the lines |mT Hz| = 13/5 and 21/5 and they are the ones with the largest cou-pling on the C-transition. These two independent condi-tions point |mT Hz| = 13/5 as the transition of the best contrast/broadening compromise in the context of our present experimental set-up.
In Fig. 7, we have plotted the linewidth and contrast of the mT Hz= −13/5 dark line for the five different sets of {ωC, ωB}, as observed for Fig. 4. The data show a
depen-FIG. 7. FWHM (a) and contrast (b) of the mT Hz = −13/5
dark line observed for 5 different sets of {ωC, ωB}, vs ∆cR,
same experiments as for Fig. 4. (c) : line profile of the dark line showing the largest contrast and the smallest linewidth of these 5 observations. The background induced by stray light is 520 ± 25 counts/ms.
dence of the linewidth and contrast with the one-photon detuning ∆Rfor which the CPT occurs while all the laser powers are kept constant. We think that this effect can be explained by the relative position of the dark line in the broader fluorescence spectra profiles of the trapped ions, due to a competition with the strong transitions involved in laser cooling. Further studies are required to identify the best condition to reach the contrast/linewidth opti-mum but these curves open very positive perspectives as we find in the same detuning range the smallest shifts,
the largest contrast and the narrowest linewidth. Considering that the Doppler broadening can be can-celled by obeying the phase matching condition ~kB − ~kR− ~kC = ~0 [18], or alternatively by a Lamb-Dicke ef-fect on the THz-wavelength scale [42], the signal over noise ratio could be increased with a larger number of ions building the dark line. By expanding the size of the cloud, the position dependant systematic shifts are expected to broaden the spectroscopic lines [43–45]. Nev-ertheless, when varying the number of trapped ions from 60 to 400 ions, with all other parameters fixed, we ob-serve no variation of the THz-frequency shift, neither of the dark line width, within the 6 kHz resolution.
As the magnetic field fluctuations can be actively re-duced by a factor 50 and the sensitivity to these fluc-tuations can also be reduced by using the transitions mT Hz = ±1/5 if other laser polarisation and propaga-tion direcpropaga-tions are permitted by the set-up, a linewidth in the kHz range, or lower, together with a large contrast, seems to be very accessible. It would enable to identify effects, which are so far too small to be detected and to access a resolution in the 10−9 range, which is the state of the art in the THz precision spectroscopy [42, 46]. In-deed, in a system without any experimentally induced decoherence, one can show that sub-kHz linewidths can be observed [18]. Furthermore, with a 25% contrast and an average fluorescence signal of 4000 counts/ms which is the typical value for the fluorescence of one thousand trapped ions in the optimum condition for a narrow dark line, the signal to noise ratio at 1 ms reaches 16. Even with a kHz linewidth, such a large signal to noise ratio allows the resolution to be increased to the 10−11 range by averaging data over seconds.
CONCLUSION
The demonstrated 3-photon CPT has a large poten-tial for high-resolution spectroscopy. Very similar to 2-photon CPT, the interrogation protocole depends on numerous parameters that have to be further explored. In 2-photon CPT, they are strongly mitigated by the use of Ramsey-type pulsed protocol [47–49] and using a pulsed interrogation method for the 3-photon CPT is certainly a route to test. The originality of our approach allows to access the THz domain, an insufficiently ex-plored and very promising spectral domain, so far asso-ciated to rotational transitions in light molecules. Al-though the production of a continuous-waveTHz radia-tion from the three involved optical radiaradia-tions is still an issue, this configuration could be of use to transmit the 1.82 THz reference signal by optical means and to benefit from very efficient detectors. Indeed, because THz radi-ation hardly propagates along long distances in air, its phase-coherent transfer implies to coherently duplicate its phase information onto an optical carrier[50].
Build-ing a THz referenced signal from three coherent lasers avoids this duplication stage and allows its transmission over long distances through optical fibers. Independently of the frequency range of the reference transition, the demonstration that a narrow line can be produced in a mesoscopic sample by implementing a Doppler-free tech-nique opens the route to its implementation on a large variety of atomic systems.
This experiment has been financially supported by the Labex FIRST-TF (ANR-10-LABX-48-01), the A*MIDEX project (ANR-11-IDEX-0001-02), EquipEx Refimeve+ (ANR-11-EQPX-0039) all funded by the Investissements d’Avenir French Government program, managed by the French National Research Agency (ANR). Fundings from CNES (contract 151084) and R´egion PACA are acknowledged. MC acknowledges FIRST-TF for funding and stimulating scientific environ-nement, CyC acknowledges financial support from CNES and R´egion Provence-Alpes-Cote d’Azur.
Conditions for a three-photon dark resonance
The condition for a three-photon dark resonance im-plying the weak quadrupole transition in Ca+ is better explained in the dressed state picture where the sys-tem of interest is a motionless atom represented by its quantized internal states plus nB photons at 397 nm (energy nB × ~ωB), nR photons at 866 nm (energy nR× ~ωR) and nC photons at 729 nm (energy nC× ~ωC) (see Fig.1, a for the level scheme). The three atom-laser interactions are characterised by their Rabi fre-quencies ΩB, ΩR, ΩC which are linear with the local laser electric field, whatever the nature of this inter-action. The eigenvalues of the non-coupled hamilto-nian depend on each laser detuning which are defined like ∆B = ωB − ωP1/2S1/2, ∆R = ωR− ωP1/2D3/2, and
∆C = ωC − ωD5/2S1/2 with ωP1/2S1/2, ωP1/2D3/2 and
ωD5/2S1/2 the atomic transition frequencies. Like
fur-ther explained in [15], the dressed laser-coupled subsys-tem {(S1/2, nB, nR, nC), (D5/2, nB, nR, nC − 1)} can be diagonalised at the lowest order of the perturbation and the new eigenstates {|Si, |Qi} are then a coherent super-position of the two uncoupled states. {|Si, |Qi} are both coupled to the |P i state (P1/2, nB − 1, nR, nC) through the strong dipole transition excited by the 397 nm laser, but with a very different strength, depending on the de-tuning ∆C and the Rabi frequency ΩC, which control the proportion of the two uncoupled states in the new eigenstates. Including |Di = (D3/2, nB− 1, nR+ 1, nC), the subsystem {|Qi, |P i, |Di}, coupled by the two dipole transitions forms a Λ-scheme where the two feet are sta-ble or metastasta-ble. This scheme is the paradigm of the configurations giving rise to a coherent population trap-ping in a dark state when the two (meta)stable states are degenerated in the dressed state picture [1]. Because the
Λ-scheme was built by first diagonalising one of the in-teractions, this resonance condition implies here not two but three photons and writes
∆R= ∆B− ∆C− δC (3) where δC is the light-shift induced by the quadrupole coupling on the 729 nm transition [15]. The laser cou-plings on the effective Λ-scheme are ΩRand αCΩB with αC = ΩC/2∆C the mixing coefficient induced by the quadrupole coupling.
[1] E. Arimondo (Elsevier, 1996) p. 257.
[2] G. Alzetta, A. Gozzini, L. Moi, and G. Orriols, Il Nuovo Cimento B (1971-1996) 36, 5 (1976).
[3] O. Schmidt, R. Wynands, Z. Hussein, and D. Meschede, Phys. Rev. A 53, R27 (1996).
[4] A. Nagel, L. Graf, A. Naumov, E. Mariotti, V. Bian-calana, D. Meschede, and R. Wynands, Europhysics Let-ters (EPL) 44, 31 (1998).
[5] P. D. D. Schwindt, S. Knappe, V. Shah, L. Holl-berg, J. Kitching, L.-A. Liew, and J. More-land, Applied Physics Letters 85, 6409 (2004), https://doi.org/10.1063/1.1839274.
[6] N. Cyr, M. Tetu, and M. Breton, IEEE Transactions on Instrumentation and Measurement , 640 (1993). [7] R. Wynands and A. Nagel, Applied Physics B 68, 1
(1999).
[8] J. Vanier, Applied Physics B 81, 421 (2005).
[9] P. Yun, F. m. c. Tricot, C. E. Calosso, S. Micalizio, B. Fran¸cois, R. Boudot, S. Gu´erandel, and E. de Clercq, Phys. Rev. Applied 7, 014018 (2017).
[10] M. Abdel Hafiz, G. Coget, P. Yun, S. Gu´ erandel, E. de Clercq, and R. Boudot, Journal of Applied Physics 121, 104903 (2017), https://doi.org/10.1063/1.4977955. [11] X. Liu, E. Ivanov, V. I. Yudin, J. Kitching, and E. A.
Donley, Phys. Rev. Applied 8, 054001 (2017). [12] R. H. Dicke, Phys. Rev. 89, 472 (1953).
[13] J. Kitching, S. Knappe, and L. Hollberg, Applied Physics Letters 81, 553 (2002), https://doi.org/10.1063/1.1494115.
[14] P. R. Hemmer, M. S. Shahriar, V. D. Natoli, and S. Ezekiel, J. Opt. Soc. Am. B 6, 1519 (1989).
[15] C. Champenois, G. Morigi, and J. Eschner, Phys. Rev. A 74, 053404 (2006).
[16] G. Grynberg, F. Biraben, M. Bassini, and B. Cagnac, Phys. Rev. Lett. 37, 283 (1976).
[17] T. Hong, C. Cramer, W. Nagourney, and E. N. Fortson, Phys. Rev. Lett. 94, 050801 (2005).
[18] C. Champenois, G. Hagel, M. Houssin, M. Knoop, C. Zumsteg, and F. Vedel, Phys. Rev. Lett. 99, 013001 (2007).
[19] I. I. Ryabtsev, I. I. Beterov, D. B. Tretyakov, V. M. Entin, and E. A. Yakshina, Phys. Rev. A 84, 053409 (2011).
[20] D. S. Barker, N. C. Pisenti, B. J. Reschovsky, and G. K. Campbell, Phys. Rev. A 93, 053417 (2016).
[21] N. Scharnhorst, J. B. W¨ubbena, S. Hannig, K. Jakob-sen, J. Kramer, I. D. Leroux, and P. O. Schmidt, Opt. Express 23, 19771 (2015).
8
[22] M. Collombon, G. Hagel, C. Chatou, D. Guyomarc’h, D. Ferrand, M. Houssin, C. Champenois, and M. Knoop, Opt. Lett. 44, 859 (2019).
[23] M. Ramm, T. Pruttivarasin, M. Kokish, I. Talukdar, and H. H¨affner, Phys. Rev. Lett. 111, 023004 (2013). [24] M. Knoop, C. Champenois, G. Hagel, M. Houssin,
C. Lisowski, M. Vedel, and F. Vedel, Eur. Phys. J. D 29, 163 (2004).
[25] R. Yamazaki, H. Sawamura, K. Toyoda, and S. Urabe, Phys. Rev. A 77, 012508 (2008).
[26] C. Solaro, S. Meyer, K. Fisher, M. V. DePalatis, and M. Drewsen, Phys. Rev. Lett. 120, 253601 (2018). [27] C. Champenois, J. Pedregosa-Gutierrez, M. Marciante,
D. Guyomarc’h, M. Houssin, and M. Knoop, AIP Con-ference Proceedings 1521, 210 (2013).
[28] M. R. Kamsap, J. Pedregosa-Gutierrez, C. Champenois, D. Guyomarc’h, M. Houssin, and M. Knoop, Phys. Rev. A 92, 043416 (2015).
[29] J. Pedregosa, C.Champenois, M. Houssin, and M.Knoop, Int. J. Mass Spec. 290, 100 (2010).
[30] M. Drewsen, C. Brodersen, L. Hornekær, J. S. Hangst, and J. P. Schifffer, Phys. Rev. Lett. 81, 2878 (1998). [31] L. Turner, Phys. Fluids 30, 3196 (1987).
[32] L. Hornekær and M. Drewsen, Phys. Rev. A 66, 013412 (2002).
[33] J. E. Thomas, S. Ezekiel, C. C. Leiby, R. H. Picard, and C. R. Willis, Opt. Lett. 6, 298 (1981).
[34] S. Brandt, A. Nagel, R. Wynands, and D. Meschede, Phys. Rev. A 56, R1063 (1997).
[35] W. Nagourney, J. Sandberg, and H. Dehmelt, Phys. Rev. Lett. 56, 2797 (1986).
[36] D. J. Larson, J. C. Bergquist, J. J. Bollinger, W. M. Itano, and D. J. Wineland, Phys. Rev. Lett. 57, 70 (1986).
[37] I. Sobelman, Atomic spectra and radiative transitions (Springer-Verlag, 1992).
[38] F. Gebert, Y. Wan, F. Wolf, C. N. Angstmann, J. C. Berengut, and P. O. Schmidt, Phys. Rev. Lett. 115, 053003 (2015).
[39] T. Zanon-Willette, E. de Clercq, and E. Arimondo, Phys. Rev. A 84, 062502 (2011).
[40] J. W. Pollock, V. I. Yudin, M. Shuker, M. Y. Basalaev, A. V. Taichenachev, X. Liu, J. Kitching, and E. A. Don-ley, Phys. Rev. A 98, 053424 (2018).
[41] A. Nagel, S. Brandt, D. Meschede, and R. Wynands, Europhysics Letters (EPL) 48, 385 (1999).
[42] S. Alighanbari, M. G. Hansen, V. I. Korobov, and S. Schiller, Nature Physics 14, 555 (2018).
[43] K. Arnold, E. Hajiyev, E. Paez, C. H. Lee, M. D. Barrett, and J. Bollinger, Phys. Rev. A 92, 032108 (2015). [44] K. J. Arnold and M. D. Barrett, Phys. Rev. Lett. 117,
160802 (2016).
[45] J. Keller, T. Burgermeister, D. Kalincev, A. Didier, A. P. Kulosa, T. Nordmann, J. Kiethe, and T. E. Mehlst¨aubler, Phys. Rev. A 99, 013405 (2019).
[46] G. Hu, T. Mizuguchi, X. Zhao, T. Minamikawa, T. Mizuno, Y. Yang, C. Li, M. Bai, Z. Zheng, and T. Ya-sui, Science Report 7 (2017), 10.1038/srep42082. [47] T. Zanon-Willette, V. I. Yudin, and A. V. Taichenachev,
Phys. Rev. A 92, 023416 (2015).
[48] M. Abdel Hafiz, G. Coget, M. Petersen, C. Rocher, S. Gu´erandel, T. Zanon-Willette, E. de Clercq, and R. Boudot, Phys. Rev. Applied 9, 064002 (2018). [49] M. Abdel Hafiz, G. Coget, M. Petersen, C. Rocher,
S. Gu´erandel, T. Zanon-Willette, E. de Clercq, and R. Boudot, Phys. Rev. Applied 9, 064002 (2018). [50] S. Nagano, M. Kumagai, H. Ito, M. Kajita, and