ISSN : 2437-1114
www.aljest.org
A
LJEST
The isolation and characterization of yeast strains
saccharomyces cerevisiae cultivated on musts of common
dates: Physiological studies of the adaptation and the
resistance to ethanol
S. Chibi*, D. El Hadi
Laboratoire d'Analyse Fonctionnelle des Procédés Chimiques, Département de génie des Procédés, Université Blida 1 BP 270 - 09000 Blida, Algérie
*Corresponding author: s.chibi@univ-blida.dz ; Tel.: +21390 91 86 67; Fax: +213 25 43 36 31
ARTICLE INFO
ABSTRACT/RESUME
Article History:
Received : 13/11/2018 Accepted : 20/03/2019
Abstract:
The production of bio-alcohol from common dates need a
less sensitive microorganism to the initial concentration in the
ethanol, and consists on specific strains in this production. A total of
18 strains of Saccharomyces cerevisiae were isolated and identified
from 18 varieties of common dates, six strains were selected, purified
and tested for their abilities to perform efficient fermentation on
synthetic medium. The method of selection of the most successful
yeast strains that used is based on a physiological study of the
adaptation and the resistance to the ethanol. The physico-chemical
characterization including the moisture contents, the ash, dry matter,
azote nitrogen, total sugars and acids for each variety of dates. were
in the ranges of 13.04 in 15.81%; 1.78 in 2.74%; 81.64 in 86.15%;
2.25 in 2.64%; 64.0 in 78.64% and 0.23 in 1.65%, the pH varying
from 5.4 to 5.95. The physiological characterization allowed
selecting two from six strains of Saccharomyces cerevisiae, which
possess important potentialities for production of biomass with a
concentration of 18% ethanol. A better productivity of the maximal
biomass of 3.58 g/l, 3.52 g/l and 3.54 g/l was obtained with 8%, 10%
and 12% of ethanol for the strain S1, followed by S3 with 2.57g/l,
3.16 g/l and 3.23g/l and finally by the strain S2 with 3.43g/l, 2.66 g/l
and 1.47g/l. Contrary the stains S4, S5 and S6, the quantity of
biomass obtained is very low beyond 12% of ethanol. S1 and S3 are
the less sensitive to the ethanol because even at 14% of ethanol, the
maximal population was 1.38x10
+8UFC/ml for the strain S1 and 1.24
x10
+8UFC/ml for S3. In addition, the final population is still
significant even for 16% and 18% of the ethanol. It was concluded
that the strains S1 and S3 are more appropriate for the production of
the bio-ethanol on a large-scale.
Key Words: Isolation; Fermentation; Common dates; Metabolism; Stress; Saccharomyces cerevisiae. I. Introduction
The sector of dates is classified among the strategic sectors in Algeria, the agricultural activities and food industries generate some important quantities of waste rich in organic matter which ever could
constitute new materials for manyindustries. In Algeria,the phoeniciculture constitutes the pivot in the Saharaagriculture with an ascendancy of the palm trees which is about 22% of the total surface of plantations. The number of these trees knew a lightning expansion the last two decades; it passed
Copyright © 2019, Algerian Journal of Environmental Science and Technology, All rights reserved
common dates and offal’s of Deglet-Nour represents an average of 53% of the annual production of the palm trees [3]. Basing on the production of 750000 tons per year in 2011, we can estimate the annual tonnage of the common date by a simple calculation of 187.5x10³ tons per year. In these studies we estimated these results, justifying the study of their energy and food value, with the aim of using source of production of yeasts as biofuel energies, and even of the extraction of their essential oils. The fermented sugars in the Free State were better for the fermentation metabolism that was realized by the yeasts. The production of the ethanol from the sugars has a relatively simple kinetics which comprises only one phase of growth and production during which the carbohydrates are transformed into cell biomass, ethanol and CO2 [4].
The glucose plays a dual kinetic role; it is low-limiting and becomes inhibiter with high concentration [5]. As for ethanol, it becomes an inhibitor at high concentration [6]. The production of the biomass is the consequence of this inhibition and adds the ethanol and the CO2. In anaerobiosis,
the yeasts Saccharomyces cerevisiae often uses the glycolsis transforming the sugar into energy that can be used directly by the cell [7]. It is therefore perfectly established that a yeast strain selected as industrial leaven was a measure of resistance and growth of high concentration of ethanol, known for its antimicrobian effects during the period of production. Our study consisted at first of the physiochemical and biological characterization of dry selected date, and the isolation of six types of strains Saccharomyces cerevisiae from six scraps varieties of dates, and the selection of the most successful strains and more resistant to ethanol at different concentration (8%, 10%, 12%, 14%, 16% and 18%) v/v in a synthetic medium by an aerobically.
II. Materials and methods II.1. Vegetable Material
Six varieties of common dates from palm trees were used from different regions including Biskra, El oued and Ouargla, provinces located in the south of Algeria during the phoenicicole partner on 2013. The collected dates were in full maturity and were among the following varieties: Mech degla, Horra, Bamakhluf, Hamraya, kentichi and Degla Beida they were preserved at 4°C. The choice is justified
isolated from six varieties of dates by inoculation on the medium culture at 3 millions of yeast cells by milliliter. The strains S1, S2, S3, S4, S5 and S6 were isolated respectively from musts of date of Mech Degla, Horra, Degla Beida, Hamraya, Bamakhluf, Kentichi.
II.3. Isolation and purification of
Saccharomycescerevisiae
Six strains of Saccharomyces cerevisae S1, S2, S3, S4, S5 and S6 were isolated respectively from date juice of Mech-Degla, Horra, Degla-Beida, Hamraya, Bamakhluf, Kentichi, they were preserved at 4°C. The choice of the fruit used in this case was justified by their quality of taste, their abundance in the country and the preservation condition.
The isolation was realized using the musts of six varieties of date at the following steps:
1)The preparation of the extract of date of isolation: For the extract of date N°1, the dateswere
washed, destined and grounded. 300ml of hot water at 65°C were added to75g ofdate, homogenized and filtered date. For the extract of date N°2, the dates were washed by fresh cold water dried, pitted and diced; 62.5g of date and 15.5g of homogenized and filtered sucrose were added to 500ml of hot water at 65°C. The pH of juice N°1 and N°2 is fixed at 5 and sterilized to 120°C during 20 min.
2) The distribution of extract of dates of isolation: The extract of dates was divided in
toeight Erlenmeyer :1) 50ml extract N°1; 2) 50ml extract N°1; 3) 25ml extract N°1+25mlsolution of sucrose 6%; 4) 50ml extract N°1+25ml solution of sucrose 6%; 5) 50mlextract N°1 (Heated 30 min at 70°C); 6) 50ml extract N°2 (Heated 30 min at 70°C);7) 50ml extract N°2; 8) 50ml extract N°1 (Heated 30 min at 70°C); the erlenmeyers wereincubated at 30°C.
3) The identification: The identification was
required the realization of the following stages: Preparation of the basic medium (4g/l yeast extracts, 5g/l peptone, 25g/l glucose, 0.55g/l KH2PO4, 0.42g/l KCl, 0.12g/l CaCl2, 0.0025g/l
FeCl3, 0.0025g/l MgSO4, 50ml extract of date). The
preparation of medium was realized in test tubes at the rate of 9ml by tube, then autoclaved at 120°C during 20 min; five tubes of the medium of enrichment are showed by the positive culture then, and incubated at 30°C. The observations of the aspect of the culture were made after 48 h of
ISSN : 2437-1114
www.aljest.org
A
LJEST
incubation; Showed streaks had being the surface of theSabouraud chloramphenicol agar by means of a sterile handle dipped into each of thepositive tubes, then incubation at 30°C for 48 h. Transfer of the characteristic colonies(containing no pigment) of solid environment towards liquid environment (Basicenvironment), then incubation at 30°C for 48 h.After this stage, the culture was sowedat the same environment using the growth, but in 2% modified WLN(Wallestein Laboratoires Nutrient) agar. Thepreparation of the agar medium WLN was by mixing 100ml Basic environment; 22mgGreen of bromocresole, and 2g of agar.
4) The purification: This operation comes true
according to the stages: Transfer of the characteristic colonies (green, smoother and convex) of the WLN towards tubes containing the basic environment (of enrichment). Then incubation at 30°C during 48 h. The purification was made by the sowed streaks on the surface of the extract Sabouraud chloramphénicol agar, the incubation at 30°C during 48 h. Petri garbage showing a bacterial growth between 30 and 300 colonies, were used to account microorganisms contained in the various samples. The best isolated colonies underwent in the blue methylene and then observed by the microscope, the aim in this study was to verify the morphology and the homogeneity of cells.
II.4. AXACOLOR System
The taxonomy of yeasts was based on the determination of the cultural, morphological and biochemical characteristics [8]. Commercial kit AUXACOLORyeast identification system (Bio-Rad, lot 1C0152, French) was chosed for the identification of isolated strains [9]. The Auxacolorsystem provided rapidly, accurate results and displayed less inter observer variability. This test based on the principle of sugar assimilation. The growth of yeast is visualised by the colour changes of a pH indicator. The kit also includes 3 enzyme tests, including a test for detection of the phenoloxidase activity of Cryptococcus neoformans. According to our study which is related to the colonies each colon taken and elaborated in pure strain, so; inoculumsfrom 24 to 48 h culture on Sabouraud medium has been already prepared. Under sterile conditions, inoculate the suspension medium with a sufficient quantity of pure strain colonies to obtain an opacity equivalent to the opacity control supplied in the kit. Strict compliance with the opacity of the inoculum determines the quality of the results. Homogenize the suspension in a vortex. Using a pipette to collect and distribute 100 µl of inoculum to each one well of the microplate. Cover the microplate with the
adhesive film and incubate for 24 to 48 h at 30°C (± 2°C).
II.5. Study of resistance of bacterial strains to the initial concentration of ethanol
The preparation of the pre-culture is done in 2 stages of 35 h for each one (pre-yeast and leaven). The yeasts were taken from pure and fresh colonies isolated in LB (Luria Bertani) agar (5 g/l yeast extract, 10 g/l tryptone, 20 g/l glucose, 10 g/l NaCl, 15 g/l agar). These cells were used to inoculate Erlenmeyer of 25 ml containing 15ml of medium liquid YPD (Yeast Peptone Dextrose) (2% glucose, 1% peptone of casein and 0.5% yeast extract) adjusted to pH 4. The first stage consisted in re-activation of the yeasts in a medium liquid. So pre yeast was obtained. After incubation at 30°C, the contents of each Erlenmeyer were then transferred to another Erlenmeyer flask of 250ml containing 135 ml of synthetic medium (50 g/l glucose, 5 g/l KH2PO4, 2 g/l (NH4)2SO4, 0.4 g/l MgSO4 (H2O)7, 1
g/l yeast extracts). The second stage is used to inoculate the studying medium at 3x10⁶ CFU/ml at the end of the growth phase. The temperature is fixed at 30°C by a water bath, the pH was adjusted to 4.0 at the start of the fermentation before the sterilization and the stirring was set at 250 rpm.The criterion for selecting performant yeasts strains is their ability to withstand high concentration of ethanol [6]. Batch cultures were carried out in Erlenmeyer flask of 500 ml containing 300ml of synthetic medium inoculated with the precultures of the strains tested at a concentration of 3x10+6 CFU/ml and then sealed with silicone plugs to ensure anaerobiosis [5].
The escape of CO2 is made possible by the
installation of a sterile plastic piping, dipped in water and crossing the plugs. The concentration of alcohol in the synthetic medium was adjusted to 8%, 10%, 12%, 14%, 16% and 18% (v/v) by adding absolute ethanol (Sigma-Aldrich, Germany) were which added especially to the medium after sterilization. The growth of different strains of yeasts was controlled each day and their growth was followed by measuring every parameter which is detailed later. The alcoholic fermentation intrigues by the various strains of yeast was followed until total consumption of sugars or stop of consumption which corresponds, in fact, to the end of the fermentation.
II.6. Analytical methods
II.6.1 Biomass: The evolution of the biomass was
made by four different methods: counting hematimetric in cell of Molasses, after a coloring in the blue methylene of the microbial population
Copyright © 2019, Algerian Journal of Environmental Science and Technology, All rights reserved
diluted to the 1/20. The enumeration of colonies lately cultured is solid synthetic environment packaging in different concentration with ethanol, was realized and observed after 24 h of incubation at 30°C. At the end of the experiment a volume of 20ml of the medium culture was centrifuged type (Hettich universal 2S) at 4200 rpm during 15 min. The pellet is recovered and washed several times with distilled water, and then dried in an oven at 105°C for 24 h until a constant weight [10].
II.6.2. Humidity in (%): The content in water of
pulp and juice is determined by the simple method, 1g of flour of dates and 10 ml of juice were spread in a porcelain capsule then dried in a universal oven (UNE 400 Memmert, Germany) at 103°C for 24 h until a constant weight.
II.6.3. pH: The pH was determined by a pH-meter
of type (EUTECH INSTRUMENTS pH 510, Germany).
II.6.4. Titratable acidity: Was determined by assaying with 1N NaOH using phenolphthalein as an indicator.
II.6.5. Ashes in (%): The dosage of ashes is based
on the destruction of any organic matter under the influence of high temperature (550°C) in a muffle furnace (Nabertherm B180, Germany) until obtaining a white ash.
II.6.6. Azoth nitrogen in (%): The total nitrogen is measured by the method of KJELDAHL, the product is mineralized by sulfuric acid in the presence of a catalyst; the organic nitrogen is transformed into ammonia nitrogen; the ammonia is displaced by the caustic soda and dosed after being received in a solution of boric acid [11].
II.6.7. Total and reducing sugars: Total sugars
were measured according to the method of DUBOIS in the presence of phenol 5% and of concentrated sulphiric acid. It forms a yellow-orange complex the intensity of which is broyat of dates is proportional to the concentration of sugar. The optical density is determined after 30 min at a 490nm and the concentration in sugars was determined by means of a curve of calibration of 200µg of glucose [12]. Reducing sugars are determined by reaction of a soluble water portion of the sample with an excess of standard copper sulfate in alkaline titrate (Fehling's) solution under
musts of dates
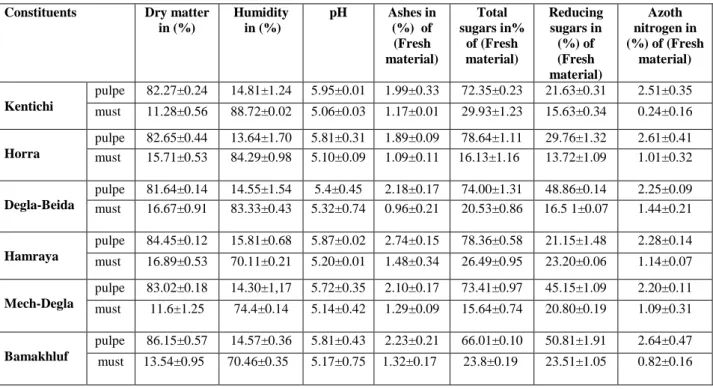
The table 1 represents the average values of the physicochemical characteristics of pulp and musts of the six varieties of the studied rubbish of dates. From the Table 1 we can see clearly that the dry matter contents on the products depends on the variety of the dates. The Bamakhluf cultivar has shown a relatively higher content 86.15% as compared to the soft Hamraya which comes second with 84.45% and 81.64% and 83.02% for the other four cultivars. Concerning the content of dry material of musts, the musts of Hamraya and Degla-Beida exhibit the highest levels 16.89% and 16.67%, while Horra and Bamakhluf were 15.71% and 13.54% respectively, the lowest level was recorded to 11.28% for Kentichi must. Generally dry matter levels in the different musts date were very important even though they are filtered. The water content of dates used in our experience was between 8.08% and 15.8%. From these results, the studied dates were dry because they have lower water content to 26% [13]. This low water content allows good product of shelves for a long period of storage at room temperature and in this area the humidity lower the water activities to 0.9 which are likely to inhibit the microbial growth [14]. Concerning the studies of musts of dates the water content varies between 83.33% and 88.72%. The pH is another parameter determining the ability for store foods. It is one of the main obstacles that the microbial flora must take to ensure its proliferation [15]. The pH of the six varieties of dates (pulp and extract date) was slightly acidic, but the date extracts were more acidic than the pulp, it was between 5.74 and 5.95 for the pulp and between 5.06 and 5.32 for different extracts. Comparing the pH of studied varieties to other varieties of date as Iraqi and Egyptian date, we can conclude that our results are similar [16], for Lulu varieties 6.5 and the variety Shahla 6.2, Bushibul 5.40, Khalas 5.68 and Bunaam 5.72 [17].The ash content is the total quantity of mineral salts present in the fruit, so the cultivar Hamraya is richer in minerals 2.74% compared to cultivars Bamakhluf, Mech- Degla, Kentichi, Horra and Degla-Beida with grades of 2.23%, 2.01%, 1.99%, 1.89% and 1.78% respectively. Many authors [18] claim that the date of closing ash contents is about 2%. In 2011, AMELLAL-CHIBANE [19] worked on some Algerian varieties, he found the contents between 1.9 and 2.13%. Saudi and Iraqi varieties contain [20] higher ash contents, between 2 and 4%.
ISSN : 2437-1114
www.aljest.org
A
LJEST
Concerning the variation in ash content between, the musts it is clearly visible. It is reported that the cultivar shows that Hamraya rate is the highest. In general the ash content in the different dates musts solutions are rich in ash though it has been filtered (Table 1). The sugars are the predominant constituents of the date [21-23]. They are also responsible for the sweetness of the food. The total sugar content varies; depending on the variety, the climate and the stage of maturity. From the results shown in Table 1, the sugar content in the pulp is
more important than that made from dates must. It is also seen that the wealth of the six varieties of dates tested in total sugars, varies from 64% to 78.64% of the fresh weight. Horra variety is the richest in sugar with a grade of 78.64% of the fresh weight. The variety Degla-Beida is less sweet 64%. However, the date’s musts were rich in a sugar which is a favorable substrate for the growth of yeast.
Table 1. Biochemical composition of pulpe and musts of dates for six varieties of date.
III.2. Resistance of S. cerevisiae strains to
ethanol at different concentrations
Although ethanol is the final product of the fermentation, it becomes a factor of important stress while accumulating in the medium. It is known as an inhibitor of the growth of micro-organisms. Once produced by the yeast, it diffuses through the plasma membrane and inhibits the growth [24], decreases the viability of the cells, and significantly affect the functions and the physicochemical properties of the plasma membrane. Thus reducing the yield of ethanol [25]. The impact of this stress on our strains was studied on synthetic medium with different concentration of ethanol at 30°C. The kinetic evolution of the total
population of 6 strains studied for six contents in ethanol is presented by Figure 1. The yeasts S1, S3, S4 and S5 present a classical kinetics of the growth of microbes with these 4 phases when we pass from 8% to 10% of content of ethanol.
Constituents Dry matter
in (%) Humidity in (%) pH Ashes in (%) of (Fresh material) Total sugars in% of (Fresh material) Reducing sugars in (%) of (Fresh material) Azoth nitrogen in (%) of (Fresh material) Kentichi pulpe 82.27±0.24 14.81±1.24 5.95±0.01 1.99±0.33 72.35±0.23 21.63±0.31 2.51±0.35 must 11.28±0.56 88.72±0.02 5.06±0.03 1.17±0.01 29.93±1.23 15.63±0.34 0.24±0.16 Horra pulpe 82.65±0.44 13.64±1.70 5.81±0.31 1.89±0.09 78.64±1.11 29.76±1.32 2.61±0.41 must 15.71±0.53 84.29±0.98 5.10±0.09 1.09±0.11 16.13±1.16 13.72±1.09 1.01±0.32 Degla-Beida pulpe 81.64±0.14 14.55±1.54 5.4±0.45 2.18±0.17 74.00±1.31 48.86±0.14 2.25±0.09 must 16.67±0.91 83.33±0.43 5.32±0.74 0.96±0.21 20.53±0.86 16.5 1±0.07 1.44±0.21 Hamraya pulpe 84.45±0.12 15.81±0.68 5.87±0.02 2.74±0.15 78.36±0.58 21.15±1.48 2.28±0.14 must 16.89±0.53 70.11±0.21 5.20±0.01 1.48±0.34 26.49±0.95 23.20±0.06 1.14±0.07 Mech-Degla pulpe 83.02±0.18 14.30±1,17 5.72±0.35 2.10±0.17 73.41±0.97 45.15±1.09 2.20±0.11 must 11.6±1.25 74.4±0.14 5.14±0.42 1.29±0.09 15.64±0.74 20.80±0.19 1.09±0.31 Bamakhluf pulpe 86.15±0.57 14.57±0.36 5.81±0.43 2.23±0.21 66.01±0.10 50.81±1.91 2.64±0.47 must 13.54±0.95 70.46±0.35 5.17±0.75 1.32±0.17 23.8±0.19 23.51±1.05 0.82±0.16
Copyright © 2019, Algerian Journal of Environmental Science and Technology, All rights reserved
Figure 1. Kinetic of growth profile at different concentrations of ethanol for six strains ofS. cerevisiae.
Differences in speed are observed between strains for the same concentration of ethanol. The influence of ethanol is not the same one for all the strains tested, their effect is, however, marked for more than a month according to the origin of the used strains.The maximal populations obtained in a stationary phase decrease, the maximum specific speed also decreases and the durations of fermentation increases when we pass from 8% to 18% of content of ethanol.
It was notified in this case that S1 and S3 strains are the least sensitive to ethanol since even in 14% of ethanol the maximum population is 137million cells/ml for the strain S1, and 124 million cells/ml for S3, and the final population is still significant
even for contents in ethanol of the order of 16% and 18%.
A content of 12% ethanol weakness on the growth of S4 and of 16% ethanol stops the multiplication of the cells especially in the first hours of fermentation. So, beyond 14% of ethanol the strain S4 became unable to develop at the same time was noted that the S5 strain presents a remarkable kinetic.In the biological system, the ethanol affects the rate of biochemical reactions and the activity of the extra cellular enzymes signifies the growth of yeasts.However, the high percentage of ethanol in the strains behaves differently, thus there is some variability between strains since they have more or less pronounced sensitivity to the initial content of 0 50 100 150 200 250 300 350 400 0 24 48 72 96 120 144 168 192 216 240 n u m b er o f ce ll s x
fermentation time (h) for 8% ethanol
0 50 100 150 200 250 300 0 24 48 72 96 120 144 168 192 216 240 n u m b er o f ce ll s x
fermentation time (h) for 10% ethanol
0 5 10 15 20 25 30 0 24 48 72 96 120 144 168 192 216 240 n u m b er o f ce ll s x 1 0 +6/m L
fermentation time (h) for 16% ethanol
S1 S2 S3 S4 S5 S6 0 1 2 3 4 5 6 7 8 9 10 0 24 48 72 96 120 144 168 192 216 240 n u m b er o f ce ll s x 1 0 +6/m L
fermentation time (h) for 18% ethanol
S1 S2 S3 S4 S5 S6 0 20 40 60 80 100 120 140 160 0 24 48 72 96 120 144 168 192 216 240 num be r o f ce ll s x 1 0 +6/m L
fermentation time ( h) for 14% ethanol
S1 S2 S3 S4 S5 S6 0 100 200 300 400 500 0 24 48 72 96 120 144 168 192 216 240 n u m b er o f ce ll s x 1 0 +6/m L
fermentation time (h) for 12% ethanol
S1 S2 S3
S4 S5 S6
ISSN : 2437-1114
www.aljest.org
A
LJEST
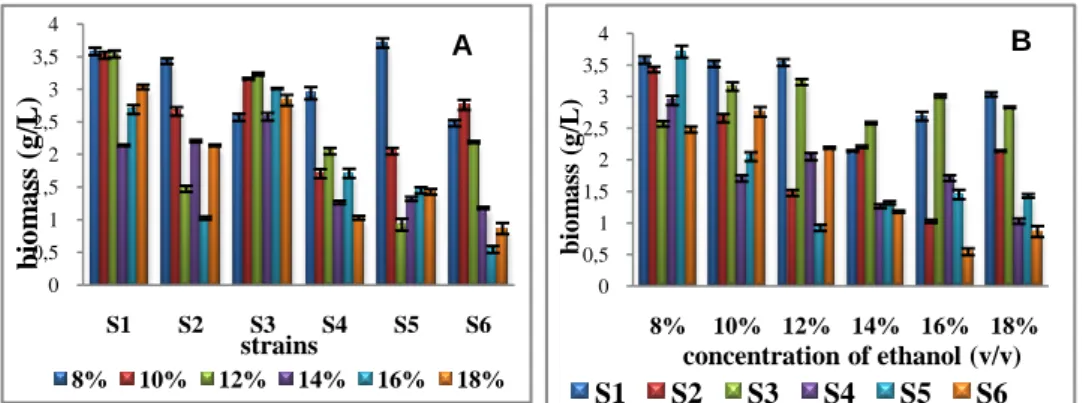
ethanol.The best productivity of the biomass was obtained in 8%, 10% and 12% of ethanol for the strain S1, followed by S3 and finally by the strain S2.
Contrary to the strains S6, S5 and S4, the quantity of biomass obtained was very weak beyond 12% of ethanol (Figure 2).
As conclusion we have noticed that both S1 and S3 strains are most productive in various levels of ethanol compared to the other strains (Table 2).
Figure 2.Comparison to the concentration of maximum biomass according to various data in ethanol for 6
strains of S. cerevisiae (A) and according to various strains for 6 different data in ethanol (B)
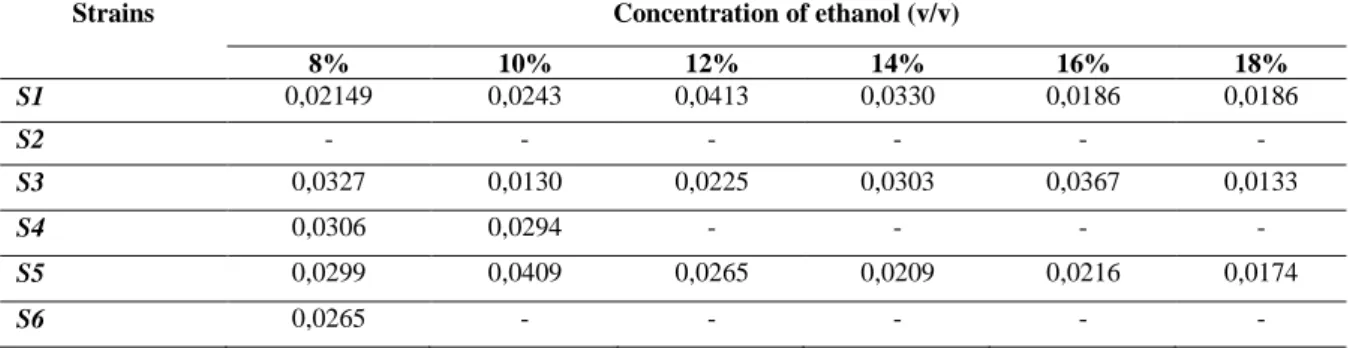
Table 2. Comparing to the specific growth the maximum rate (μmax) for 6 strains according to latent period in
different concentration of ethanol
Strains Concentration of ethanol (v/v)
8% 10% 12% 14% 16% 18% S1 0,02149 0,0243 0,0413 0,0330 0,0186 0,0186 S2 - - - - S3 0,0327 0,0130 0,0225 0,0303 0,0367 0,0133 S4 0,0306 0,0294 - - - - S5 0,0299 0,0409 0,0265 0,0209 0,0216 0,0174 S6 0,0265 - - - - -
The inhibitory effect of the highest ethanol was observed at the reached population level are not reflected in term of speed, but the well marked if one is interested in the viability of the population. The inhibitory effect of ethanol differs from one strain to another if now the percentage of viability were sticked (Figire 3), more the content in ethanol increases the rate of viability is low was noticed too. This high mortality is observed from16% of ethanol for strains S2, S4, S5 and S6. The concentration of
ethanol is influenced by the production of biomass, the cellular viability and the rious types of production. However other studies have clearly
shown that at a critical concentration of ethanol (20 to 40 g/l) the yeast stops growing which is influenced by several factors[6].
For the production of ethanol, the inhibitory concentration can be up to more than 20 % (v / v) to
Saccharomyces cerevisiae variety sake [26].
B
0 0,5 1 1,5 2 2,5 3 3,5 4 S1 S2 S3 S4 S5 S6 bio m a ss ( g /L ) strains 8% 10% 12% 14% 16% 18% 0 0,5 1 1,5 2 2,5 3 3,5 4 8% 10% 12% 14% 16% 18% b io m a ss (g /L) concentration of ethanol (v/v) S1 S2 S3 S4 S5 S6 A BCopyright © 2019, Algerian Journal of Environmental Science and Technology, All rights reserved
Figure 3. Percentage of viability with various contents of ethanol for 6 strains of S.cerevisiae
III.3. Kinetics of consumption of glucose
The kinetics of consumption of glucose which is a source of carbon and energy used in the composition of the culture medium shows a hard degradation after 24 h of fermentation. It is also observed in figure 4that the glucose was completely consumed by all strains of ethanol concentrations ranging from 8-12%, except the S2 strain which wasn’t consumed. At 14% ethanol glucose was not
totally consumed by the yeasts which is maybe the result of the stopping growth of Saccharomyces
cerevisiae by the accumulation of toxic substance
[27], indicate that at high concentrations of the fatty acids, in particular the octanoic acid and the decanoic acid, formed by the yeast in the concentration of some milligrams/liter, become toxic later, also the effect of glucose and alcohol in the medium becomes inhibitor. Table 3 shows the concentration of the residual glucose in different contents of ethanol for the 6 strains of
Saccharomyces cerevisiae (Table 3) 0 10 20 30 40 50 60 70 0 24 48 72 96 120 144 168 192 216 240 p er ce n ta g e o f v ia b le
fermentation time (h) for 10% ethanol
0 10 20 30 40 50 60 70 80 90 100 0 24 48 72 96 120 144 168 192 216 240 p er ce n ta g e o f v ia b le c el ls
fermentation time (h) for 12% ethanol
S1 S2 S3 S4 S5 S6 0 10 20 30 40 50 60 70 80 90 100 0 24 48 72 96 120 144 168 192 216 240 p er ce n ta g e o f v ia b le c el ls
fermentation time (h) for 14% ethanol
S1 S2 S3 S4 S5 S6 0 10 20 30 40 50 60 70 80 90 100 0 24 48 72 96 120 144 168 192 216 240 p er ce n ta g e o f v ia b le ce ll s
fermentation time (h) for 16% ethanol
S1 S2 S3 S4 S5 S6 0 10 20 30 40 50 60 70 80 90 100 0 24 48 72 96 120 144 168 192 216 240 p er ce n ta g e o f v ia b le c el ls
fermentation time (h) for 18% ethanol
S1 S2 S3 S4 S5 S6 0 10 20 30 40 50 60 70 0 24 48 72 96 120 144 168 192 216 240 p er ce n ta g e o f v ia b le
ISSN : 2437-1114
www.aljest.org
A
LJEST
Table 3. Comparing to the specific growth the maximum rate (μmax) for 6 strains according to latent period in
different concentration of ethano
Strains Concentration of ethanol (v/v)
8% 10% 12% 14% 16% 18% S1 0,02149 0,0243 0,0413 0,0330 0,0186 0,0186 S2 - - - - S3 0,0327 0,0130 0,0225 0,0303 0,0367 0,0133 S4 0,0306 0,0294 - - - - S5 0,0299 0,0409 0,0265 0,0209 0,0216 0,0174 S6 0,0265 - - - - - IV. Conclusion
With its diverse chemical composition and its richness in minerals and proteins, the musts developed from the common dates constitute a favorable environment for the development of the yeasts of Saccharomyces cerevisiae. But their poverty of nitrogen substances and nutrients is a limiting factor. Their employment in large quantities encourages their enrichment with a nitrogen source and mineral salts. The isolation of
Saccharomyces cerevisiae was positive in the
extracts of dates of the six varieties. Analysis of the obtained results, have shown the identification of two types of yeasts Saccharomyces cerevisiae and
Candida albicans. The common dates of low
market value remain a substrate of choice for the implementation of a manufacturing process of industrial alcohol, given the simplicity of the process, Such as an industry must be implemented in the phoenicicole regions because it certainly helps to partly limit genetic erosion of the Algerian sulfur palm. Previous results showed that high concentrations of ethanol decrease the maximum biomass concentration and the specific growth rate. Thus, revealing the inhibitor effect of the ethanol concentration on the growth. It is interesting to notice that as the concentration of ethanol increases the strains do not resist. These results also show that, even if the trends are the same ones for some strains, there exists an important variability between them from a kinetic point of view. They all do not have the same sensitivity to ethanol and in our conditions two of the six tested are still developing 18% of ethanol. Similarly, there are different affinities as compared to sugars between the strains. The two strains (S2 and S6) did not totally consume the glucose from 12% of ethanol for S2 and 14% of ethanol for the strain S6. The two strains of Saccharomyces cerevisiae S1 and S3 were less sensitive to ethanol and will be used for the part devoted to the production of bio-alcohol.
The obtained results will be compared. It is very interesting to see if there are differences of behaviors between these two origins during the fermentation.
V. References
1. Benziouche, S.E.; Cheriet,F. “Structure and constraints of the date chain in Algeria”, New Mediat, A Mediterranean Journal of Economics, Agriculture and Environment 04, Q 17, F 14 (2012) 49-51.
2. Acourene, S. “Inventary of diferents cultivars palme dates of regions Oued-Righ and Oued-Souf”, In dry vol 18:2 (2007) 135-142.
3. Ould El-Hadj, M.D.; Bitour, Z.; Siboukeur, O. “Studlies of the production of yeasts ofbaker (Saccharomyces
cerevisiae) cultivated on the mout of rebuts of
dates”,Courrier du Savoir 07 (2006) 13-18.
4. Zabed, H.;Faruq, G.;Sahu, J.N.; Azirun, M.S.; Hashim, R.;Nasrulhaq, B.A. “Bioethanol production from fermentable sugar juice”, The Scientific World Journal,2014.
5. Yamaoka, C.;Kurita, O.;Kubo, T. “Improved ethanol tolerance of Saccharomyces cerevisiae in mixed cultures with Kluyveromyces lactis on high-sugar fermentation”,Microbiological Research, 169 (2014) 907– 914.
6. Da Silva, R.O.;Batistote, M.;Cereda, M.P. “Alcoholic fermentation by the wild yeasts under thermal, osmotic and ethanol stress”. Brazilian Archives of Biology and Technology 56 (2013) 161–169.
7. Nancy, N.“Etude des interactions entre Saccharomyces cerevisiae et Oenococcus oeni : impact sur la réalisation de la fermentation malolactique en cultures séquentielles et mixtes”, Institut National Polytechnique de Toulouse, 2008.
8. Hibbett, D.S.;Binder, M.;Bischoff, J.F.; Blackwell, M.; Cannon, P.F.;Eriksson, O.E. “A higher-level phylogenetic classification of the Fungi”, Mycological Research 111 (2007) 509-547.
9. Tan Kolfi, N.; Mohd Dayaon, S.H.“Identification of microorganism from Ragi for bioethanol production by API Kit”. Statewide Agricultural Land Use Baseline10 (2015) 2751-2753.
10. Audigie, C.;Dupont, G.; Zonszain, F.“Principals of analysing methods of biochimical”. Ed. Doin, T. 2, Paris, (1983) 144.
11. Lecoq, R. “Handle alimentatry analyses and usuelle experts”,Tome I, Ed. Doin, Deren et Cie (1965) 241-251. 12. Dubois,M.;Gilles,K. A.;Hamilton,J. K.; RebersP.
Copyright © 2019, Algerian Journal of Environmental Science and Technology, All rights reserved A.;Leveauj,Y.“The stress bacteries and the consequences
of hygien genitic IAA 03”, (1994) 106-114.
16. Jassim, A.;Hasahalli, S.;Ramawang, S. Journal of Food Enginneering (2005).
17. Al-Hooti, S.;Sidhu, J.S.;Qabazard,H. “Physiochemical Characteristics of five date frit cultivars grown in the United Arab Emirates”, Plant Food for Human Nutrition50, (2002) 101-113.
18. Favier, J.C.;Ireland, R.J.;Toque, C.;Feinberg, M.“General of alimentary”. Ed. Tec et Doc-Lavoisier, INRA Editions, CNEVA et CIQUAI (1995) 897.
19. Amellal-Chibane, H.;Salem,B. “Total contents of major minerals in the nature yoghurt and in the yoghurts with the date powder of three dry varieties”, Am. J. Food, Nutr 1:2 (2011) 74-78.
20. Sawaya, W.N.;Khalil, J.K.;Safi, W.M.; Al-Shalat,A.“Physical and chimical characterization of Three Saudi Date Cultivars at Various Stages of development”, Can. Ins. FoodSci, Technol. J 16, 2, (1983) 87-93.
21. Mimouni, Y.;Siboukeur, O.E.K.“Etude des propriétés
nutritives et diététiques dessirops de dattes extraits par diffusion, en comparaison avec les sirops a haute teneur enfructose (isoglucoses), issues de l'industrie de l'amidon”, Ann. Sci. Tech 3 :1, (2011) 1-11.
22. GanbI, H. Production of Nutritious High Quality Date (Phoenix dactylifera) Fruits Syrup (Dibs) by using some Novel Technological Approaches. Journal of Applied Sciences Research 8:3 (2012) 1524-1538.
23. Queshi, A. S.; Bhutto, M. A.; Chisti, Y.; Khushk, D. M. U.; Bano, S. Production of pectinase by Bacillus subtilis EFRL 01 in a date syrup medium. African Journal of Biotechnology 11:62 (2012) 12563-12570.
24. Piper, P.W. The heat shock and ethanol stress responses of yeast exhibit extensive similarity and funtional overlap. FEMS Microbiol Lett (1995) 134:121.
25. Pina, C. ; Santos, C. ; Couto, J.A. ; Hogg, T. Ethanol tolerance of five are not Saccharomyces wine yeasts in comparison with a strain of Saccharomyces cerevisiae influenced by differentculture conditions. Food Microbiology 21 (2004) 439.
26. Hayashida, S.; Ohta, K. Formation of high concentration of alcohol by various yeasts. Journal Inst. Brew 87 (1981) 42-44.
27. Meyer, J.; Schneider, B.U.; Werk, K.; Oren, R.; Schulze, E.D. Performance of two Picea abies (L) Karst. Strands at different stages of decline. Oecologia 77 (1988) 7-13.
Please cite this Article as:
Chibi S., El Hadi D., The isolation and characterization of yeast strains saccharomyces cerevisiae
cultivated on the mout of rebuts of dates: Physiological studies of the adaptation and the resistance to ethanol, Algerian J. Env. Sc. Technology, 5:2 (2019) 937-946