HAL Id: lirmm-02383488
https://hal-lirmm.ccsd.cnrs.fr/lirmm-02383488
Submitted on 27 Nov 2019
HAL is a multi-disciplinary open access
archive for the deposit and dissemination of
sci-entific research documents, whether they are
pub-lished or not. The documents may come from
teaching and research institutions in France or
abroad, or from public or private research centers.
L’archive ouverte pluridisciplinaire HAL, est
destinée au dépôt et à la diffusion de documents
scientifiques de niveau recherche, publiés ou non,
émanant des établissements d’enseignement et de
recherche français ou étrangers, des laboratoires
publics ou privés.
Distributed under a Creative Commons Attribution| 4.0 International License
promoters through maintenance of the
nucleosome-depleted region
Andrew Oldfield, Telmo Henriques, Dhirendra Kumar, Adam Burkholder,
Senthilkumar Cinghu, Damien Paulet, Brian Bennett, Pengyi Yang, Benjamin
Scruggs, Christopher Lavender, et al.
To cite this version:
Andrew Oldfield, Telmo Henriques, Dhirendra Kumar, Adam Burkholder, Senthilkumar Cinghu, et
al.. NF-Y controls fidelity of transcription initiation at gene promoters through maintenance of
the nucleosome-depleted region. Nature Communications, Nature Publishing Group, 2019, 10 (1),
pp.3072. �10.1038/s41467-019-10905-7�. �lirmm-02383488�
NF-Y controls
fidelity of transcription initiation at
gene promoters through maintenance of the
nucleosome-depleted region
Andrew J. Old
field
1,6
, Telmo Henriques
1,2,8
, Dhirendra Kumar
1,8
, Adam B. Burkholder
3,8
,
Senthilkumar Cinghu
1
, Damien Paulet
4,5
, Brian D. Bennett
3
, Pengyi Yang
1,7
, Benjamin S. Scruggs
1
,
Christopher A. Lavender
3
, Eric Rivals
4,5
, Karen Adelman
1,2
& Raja Jothi
1
Faithful transcription initiation is critical for accurate gene expression, yet the mechanisms
underlying speci
fic transcription start site (TSS) selection in mammals remain unclear. Here,
we show that the histone-fold domain protein NF-Y, a ubiquitously expressed transcription
factor, controls the
fidelity of transcription initiation at gene promoters in mouse embryonic
stem cells. We report that NF-Y maintains the region upstream of TSSs in a
nucleosome-depleted state while simultaneously protecting this accessible region against aberrant and/or
ectopic transcription initiation. We
find that loss of NF-Y binding in mammalian cells disrupts
the promoter chromatin landscape, leading to nucleosomal encroachment over the canonical
TSS. Importantly, this chromatin rearrangement is accompanied by upstream relocation of
the transcription pre-initiation complex and ectopic transcription initiation. Further, this
phenomenon generates aberrant extended transcripts that undergo translation, disrupting
gene expression profiles. These results suggest NF-Y is a central player in TSS selection in
metazoans and highlight the deleterious consequences of inaccurate transcription initiation.
https://doi.org/10.1038/s41467-019-10905-7
OPEN
1Epigenetics and Stem Cell Biology Laboratory, National Institute of Environmental Health Sciences, National Institutes of Health, Research Triangle Park,
Durham, NC 27709, USA.2Department of Biological Chemistry and Molecular Pharmacology, Harvard Medical School, Boston, MA 02115, USA.3Integrative Bioinformatics Support Group, National Institute of Environmental Health Sciences, National Institutes of Health, Research Triangle Park, Durham, NC 27709, USA.4Department of Computer Science, LIRMM, CNRS et Université de Montpellier, Montpellier 34095, France.5Institut de Biologie Computationnelle (IBC), Université de Montpellier, Montpellier 34095, France.6Present address: Institute of Human Genetics, CNRS, University of Montpellier, Montpellier
34396, France.7Present address: Charles Perkins Centre and School of Mathematics and Statistics, University of Sydney, Sydney NSW 2006, Australia. 8These authors contributed equally: Telmo Henriques, Dhirendra Kumar, Adam B. Burkholder. Correspondence and requests for materials should be
addressed to A.J.O. (email:andrew.oldfield@igh.cnrs.fr) or to K.A. (email:karen_adelman@hms.harvard.edu) or to R.J. (email:jothi@nih.gov)
123456789
W
hile the sequence, structure, and binding partners of
gene promoters have been intensely scrutinized for
nearly half a century
1, how the cell discerns when and
where to initiate transcription is still not fully understood
2.
Recent studies have established basic rules regarding spatial
arrangements of cis-regulatory elements, ordered recruitment of
general transcription factors (GTFs) for transcription
pre-initiation complex (PIC) formation, and the role of chromatin
in defining the promoter environment
3–8. One key determinant
of active gene promoters is the requirement for an accessible
transcription initiation/start site (TSS), characterized by a
nucleosome-depleted region (NDR)
flanked by two
well-positioned nucleosomes (the
−1 and +1 nucleosomes)
9.
Within the NDR, several core promoter elements such as the
TATA box and the initiator (Inr) element exhibit a positional bias
relative to the TSS
10,11and play important roles in TSS selection.
However, the core promoter elements vary from one promoter to
the next and can be either absent or present multiple times within
a single NDR, suggesting that these elements are not the sole
determinants of TSS selection. Thus, how the RNA Polymerase II
(Pol II) chooses one transcription initiation site over another
remains unclear. In yeast, mutational studies have identified
several GTFs and other accessory factors with key roles in TSS
selection
12–18. However, despite greater specificity in TSS
selec-tion in metazoans, such accessory factors have yet to be described
in higher eukaryotes.
NF-Y, also known as the CCAAT-binding factor CBF, is a
highly conserved and ubiquitously expressed heterotrimeric
transcription factor (TF) composed of the NF-YA, NF-YB, and
NF-YC subunits, all three of which are necessary for stable DNA
binding of the complex
19–23. NF-YA, which harbors both
DNA-binding and transactivation domains, makes sequence-specific
DNA contacts, whereas the histone-fold domain (HFD)
con-taining NF-YB and NF-YC interact with DNA via nonspecific
HFD-DNA contacts
22,23. The structure and DNA-binding mode
of NF-YB/NF-YC HFDs are similar to those of the core histones
H2A/H2B, TATA-binding protein (TBP)-associated factors
(TAFs), the TBP/TATA-binding negative cofactor 2 (NC2α/β),
and the CHRAC15/CHRAC17 subunits of the nucleosome
remodeling complex CHRAC
22.
NF-Y has an established role in gene regulation through cell
type-invariant promoter-proximal binding
24,25. However, the
mechanisms through which NF-Y influences gene expression
remain unclear. Several lines of evidence have pointed toward a
possible role in the recruitment of chromatin modifiers and/or
the PIC to the promoters of its target genes (for a review, see
Dolfini et al.
20). Previously, we reported a critical role for NF-Y in
facilitating a permissive chromatin conformation at cell
type-specific distal enhancers to enable master transcription factor
binding
24. Here, we investigate the role NF-Y plays at gene
promoters, what effect it may have on chromatin accessibility and
recruitment of the transcription machinery, and how this might
impact gene expression.
Through genome-wide studies in mouse embryonic stem
cells (ESCs), we
find that NF-Y is essential for the maintenance
of the NDR at gene promoters. Depletion of the NF-YA protein
leads to the accumulation of ectopic nucleosomes over the TSS,
reducing promoter accessibility. Interestingly, under these
conditions, we
find that the PIC can relocate to a previously
NF-Y-occupied upstream site, from where it commences
ecto-pic transcription initiation. Remarkably, the resulting ectoecto-pic
transcript can create novel mRNA isoforms and, in a large
number of cases, leads to abnormal translation. Overall, we
establish NF-Y’s role in TSS selection and demonstrate its
importance in safeguarding the integrity of the NDR at gene
promoters.
Results
NF-Y promotes chromatin accessibility at gene promoters. Our
previous characterization of NF-Y-binding sites in ESCs revealed
that a majority of these binding sites are located within 500 base
pairs (bp) of annotated TSSs of protein-coding genes
24. Further
analysis of our NF-Y ChIP-Seq data revealed a positional bias,
with nearly all of the NF-Y-binding sites located immediately
upstream (median distance 94 bp) of the TSS (Fig.
1
a, b) and a
positive correlation between NF-YA occupancy and CCAAT
motif occurrence (Fig.
1
b, c; Supplementary Fig. 1a–c). To
investigate whether NF-Y promotes chromatin accessibility at
proximal promoters, as it does at distal enhancers
24, we used
small interfering RNA (siRNA) to knockdown (KD) the
DNA-binding subunit NF-YA in ESCs (Supplementary Fig. 1d, e) and
assessed DNase I hypersensitivity at candidate promoters, either
bound or not bound by NF-Y. Quantitative assessment of the
relative
“openness” of the probed regions revealed that depletion
of NF-YA results in a significant reduction in DNA accessibility
at promoters bound by NF-Y, but not at promoters without NF-Y
binding (Fig.
1
d; Supplementary Fig. 1f, g). In agreement with
this, genome-wide assessment of chromatin accessibility using
ATAC-Seq confirmed loss in ATAC signal that is specific to
promoters targeted by NF-Y (Fig.
1
e, f; Supplementary Fig. 1h, i).
These data suggest that NF-Y helps maintain accessible
chro-matin at promoters.
NF-Y binding protects NDRs from nucleosome encroachment.
To further explore the role of NF-Y binding at promoters, we
mapped nucleosomes using micrococcal nuclease (MNase)
digestion followed by high-throughput sequencing (MNase-Seq).
Our data revealed that NF-Y-binding sites genome-wide are
depleted of nucleosomes (Fig.
1
g; Supplementary Fig. 2a).
Focusing on NF-Y-bound promoter regions, we noted a strong
anti-correlation between NF-Y and nucleosome occupancy
(Fig.
1
b, g). To determine whether NF-Y binding plays a direct
role in occluding nucleosomes at its binding sites, we performed
MNase-Seq in NF-YA-depleted cells. Examination of the
nucleosomal landscape at candidate NF-Y target promoters in
NF-Y-depleted cells revealed a striking gain of a nucleosome(s)
within what was previously a well-defined NDR (Fig.
1
e, h), an
observation we confirmed by both MNase-qPCR (Fig.
1
i) and
histone H3 ChIP-qPCR analyses (Supplementary Fig. 2b).
Genome-wide gain of ectopic nucleosome(s) within the NDR
upon NF-YA KD is observed specifically at NF-Y bound
pro-moters (Fig.
1
h), rather than non-NF-Y-bound promoters
(Sup-plementary Fig. 2d), suggesting a direct effect. Interestingly,
ectopic nucleosomes observed in NF-YA-depleted cells overlap
the TSS of NF-Y bound genes (Fig.
1
e, h; Supplementary Fig. 2d),
suggesting that NF-Y binding could protect the TSS from
inhi-bitory nucleosome binding. Moreover, this ectopic nucleosome
positioning in NF-Y-depleted cells is consistent with
sequence-based predictions of nucleosome binding preference at these
regions
26(Supplementary Fig. 2e). Altogether, these data suggest
a role for NF-Y binding at gene promoters in protecting the NDR
and the TSS from nucleosome encroachment and that in NF-Y’s
absence, nucleosomes are able to bind within this region.
NF-Y binding impacts PIC positioning and TSS selection.
Nucleosomes characteristically provide a refractory chromatin
environment for the binding of TFs. In fact, the TATA-binding
protein (TBP), and hence the general Pol II transcription
machinery, is unable to bind nucleosomal DNA
27. Consequently,
upon observing the appearance of ectopic nucleosome binding
within the NDR of NF-Y-bound promoters in NF-YA-depleted
cells, we sought to investigate whether this outcome affects
binding of the transcription machinery and thus transcription
initiation. Because NF-Y is known to interact with the Pol
II-recruiting TBP
28and several TBP-associated factors (TAFs)
20,
essential components of the TFIID complex that recruits Pol II,
we decided to investigate whether TBP enrichment was also
affected upon NF-YA KD. Indeed, loss of NF-Y binding led to a
significant diminishment and/or upstream shift of TBP’s binding
pattern (Supplementary Fig. 3a), a consequence that could have a
dramatic impact on TFIID recruitment, PIC positioning, and thus
TSS selection.
In order to obtain a high-resolution view of Pol II activity and
to map TSS utilization at base-pair resolution, we performed
Start-Seq
9, a high-throughput sequencing method that captures
capped RNA species from their 5′-ends. Start-Seq faithfully
mapped the canonical TSSs in the control cells, confirming its
utility in capturing transcription initiation sites (Fig.
2
a). More
importantly, consistent with altered TBP binding, analysis of
Start-Seq data in NF-YA-depleted cells revealed clear upstream
shifts in TSS usage at many NF-Y-bound promoters (Fig.
2
a). To
ensure identification of promoters exhibiting significant shifts in
TSS usage, we used a stringent criterion that excludes ectopic
transcription initiation events that occur within ±25 bp of the
canonical TSS. Our analysis of the 3056 NF-Y bound gene
promoters, using this strategy, identified 538 genes exhibiting
significant shifts in TSS location (Fig.
2
b), with a vast majority
exhibiting a TSS shift upstream of the canonical TSS. Ectopic
TSSs are located at a median distance of 115 bp upstream of the
canonical TSS (Supplementary Fig. 3b). Importantly, this
upstream ectopic transcription initiation is specific to
NF-Y-bound promoters, with the same directionality of transcription as
that from the canonical TSS (Fig.
2
c; Supplementary Fig. 3c).
Interestingly, NF-Y-mediated TSS selection is restricted to TSSs
a
Non-NF-Y bound genes NF-Y bound genes
Avg. NF-YA ChIP
-S eq read density ( R P M ) –1000 –940 1000 Position relative to TSS (bp) 0 2 4 6 Control KD NF-YA KD
d
e
NF-Y bound promoters
0 5 10 25 50 75 –8 –6 –4 –2 0 Units DNase I F rac tion of uncut
input DNA (log2)
Non-NF-Y bound promoters
0 5 10 25 50 75 –8 –6 –4 –2 0 F rac tion of uncut
input DNA (log2)
Units DNase I
CCAAT motif occurrence at NF-Y bound promoters
c
b
NF-Y occupancy (ChIP-Seq signal) 06 Genes sor ted b y decreasing distance between NF-Y binding site and
TSS 1000 –1000 0 Distance from TSS (bp) Genes sor ted b y decreasing distance betw
een NF-Y binding site and
TSS 1000 –1000 0 Distance from TSS (bp) MNase-Seq Atp5g1 15 4 1 Kb NF-YA ChIP-Seq Hsp90b1 BC030307 15 4 1 Kb G3bp1 15 5 1 Kb Control KD NF-YA KD 0 6 2 8 4 10 12 14 MNase-qPCR signal
(normalized to control primers)
1000 –1000 –500 0 500 Position relative to TSS (bp) * * Atp5g1 0 5 10 15 * * * * –1000 –500 0 500 Position relative to TSS (bp) Hsp90b1 0 2 6 8 4 * * * 1000 –1000 –500 0 500 Position relative to TSS (bp) G3bp1 Control KD NF-YA KD
i
g
Nucleosome occupancy (MNase-Seq signal) 0 2.5 Genes sor ted b y decreasing distance between NF-Y binding site and
TSS
h
Genes sor ted b y decreasing distance between NF-Y binding site and
TSS Log2 ratio of MNase-Seq signal (NF-YA KD vs control KD) –2 2 0
f
Genes sor ted b y decreasing distance between NF-Y binding site and
TSS Log2 ratio of ATAC-Seq signal (NF-YA KD vs control KD) 1000 –1000 0 Distance from TSS (bp) 1000 –1000 0 Distance from TSS (bp) 1000 –1000 0 Distance from TSS (bp) ATAC-Seq 15 Control KD NF-YA KD 22 28 –2 2 0 012
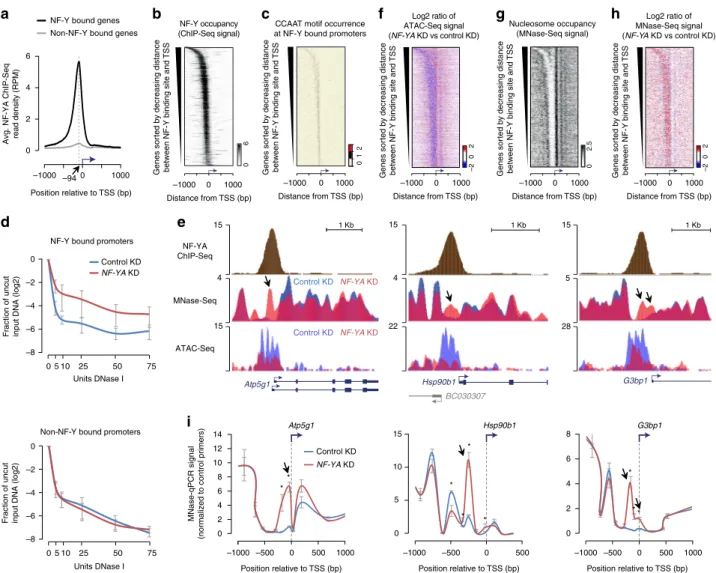
Fig. 1 NF-Y binding at gene promoters protects the nucleosome-depleted region (NDR) from nucleosome encroachment. a Average NF-YA occupancy (y-axis), as measured using ChIP-Seq, near transcription start sites (TSSs) of genes with (black, n = 3191) or without (gray, n = 21,195) promoter-proximal NF-Y binding in mouse ESCs. RPM, reads per million mapped reads.b NF-YA occupancy near TSSs of genes with promoter-proximal NF-Y binding. c CCAAT motif occurrence near TSSs of genes with promoter-proximal NF-Y binding. d DNase I hypersensitivity and qPCR analysis of promoters with (top; n = 6) or without (bottom; n = 4) NF-Y binding in control (blue) and NF-YA KD (red) ESCs. Error bars, SEM. The data for individual promoters shown in Supplementary Fig. 1f, g.e Genome browser shots of candidate NF-Y target genes showing nucleosome occupancy in control (blue) orNF-YA KD (red) ESCs. Gene structure is shown at the bottom. Arrows highlight nucleosomal gain inNF-YA KD cells over what was previously a well-defined NDR in control KD cells.f Relative change (log2) in chromatin accessibility, as measured using ATAC-Seq, near TSSs of genes with promoter-proximal NF-Y binding in NF-YA KD vs. control KD ESCs. g Nucleosome occupancy (RPKM), as measured using MNase-Seq, near TSSs of genes with promoter-proximal NF-Y binding in control ESCs. RPKM, reads per one kilobase per one million mapped reads.h Relative change (log2) in nucleosome occupancy near TSSs of genes with promoter-proximal NF-Y binding inNF-YA KD vs control KD cells. i MNase-qPCR validation of MNase-Seq data shown in Fig.1e. Error bars, SEM of three biological replicates. *P-value < 0.04 (Student’s t test, two-sided)
of annotated genes, as the sites of transcription initiation of the
associated upstream antisense RNA (divergent transcription
29–31)
or the downstream antisense RNA (convergent transcription)
exhibit no such shift (median shift of 0 bp; Supplementary
Fig. 3d).
Analysis of the differences in Start-Seq read counts upstream of
the TSS between control and NF-YA KD cells revealed a positive
correlation with NF-YA-binding intensity (Fig.
2
d). Comparison
of NF-Y-bound promoters that exhibit TSS shifts upon NF-YA
KD against those that do not revealed stronger NF-YA occupancy
at genes with TSS shifts (Supplementary Fig. 3e). Moreover, the
loss of NF-YA binding at these genes upon NF-YA KD results in a
substantial increase in nucleosome deposition over canonical
TSSs
compared
with
their
non-shifting
counterparts
a
Atp5g1 Hsp90b1 G3bp1 Expressionfold-change (log2) over control KD –2 0 2 4 6 8 Total Ectopic –4 –2 0 2 4 6 Total Ectopic –2 0 2 4 6 8 Total Ectopic Control KD NF-YA KD, 48 h NF-YA KD, 96 h NF-YC KD, 48 hNF-YA, NF-YB, NF-YC triple KD, 48 h
RA differentiated cells, day 4
Total Atp5g1 15 3300 37 106 NF-YA ChIP-Seq RNA-Seq Start-Seq control KD Start-Seq NF-YA KD 13 1000 680 60 Hsp90b1 Total 1 Kb 19 400 12 21 G3pb1 1 Kb 1 Kb Control KD NF-YA KD Primer pairs
g
500 bp RNA seq 1000 Hsp90b1 Ectopic * ** *** Schematic RT-PCR results Control KD NF-YA KD NF-YA KD RNA-Seq individual reads 195 bp 460 bp 1.3 Kb 100 bp 600 bp 1.5 Kb # * ** *** Control KDNF-YA KDb
Log2 ratio of Start-Seq signal (NF-YA KD vs control KD)
at NF-Y bound promoters exhibiting TSS shift
–3 3
1000
–1000 0
Distance from canonical TSS (bp)
Genes sorted by decreasing distance between ectopic and canonical TSS
0
0 4
2 6
Avg. NF-YA ChIP-Seq signal (RPM)
at NF-Y bound genes
c
Log2 ratio of Start-Seq signal in
NF-YA KD vs control KD 1000 –1000 –500 0 500 1.5 –1.0 –0.5 1.0 0 0.5 Non-NF-Y bound NF-Y bound
NF-Y bound & TSS shifted
−2 0 2 4
Log2 ratio of Start-Seq signal (NF-YA
KD vs control KD)
****
***
Genes sorted by decreasing distance between ectopic and canonical TSS
Log2 ratio of RNA-Seq signal (NF-YA KD vs control KD) at NF-Y bound promoters
exhibiting TSS shift 1000 –1000 0 –3 3 0
e
d
0 40 20 60 ** *** # *NF-YA ChIP-Seq read count (RPM) within –900 to +100 bp of TSS
0 to 4950 to 99
100 to 199200 to 299300 and up Max. of difference in Start-Seq reads (NF-YA KD vs control KD) within -900 to +100 bp of TSS
##
0 4
2 6
Avg. NF-YA ChIP-Seq signal (RPM)
at NF-Y bound genes
f
1.5 1.0 0 0.5 2.5 2.0Log2 ratio of RNA-Seq signal (NF-YA
KD vs control KD) −2 0 2 4 6 8 **** ***
Log2 ratio of RNA-Seq signal in
NF-YA
KD vs control KD
Non-NF-Y bound NF-Y bound
NF-Y bound & TSS shifted
1000
–1000 –500 0 500
h
i
Ectopic Ectopic Ectopic
Position relative to TSS (bp) Distance from canonical TSS (bp)
(Supplementary Fig. 3f); 63% of NF-Y bound promoters with TSS
shifts exhibit
≥1.5-fold increase in MNase-Seq signal compared to
41% of their NF-Y bound non-shifting counterparts.
Having established that NF-YA depletion leads to altered
localization of the transcription pre-initiation complex at a subset
of NF-Y-bound promoters, we performed RNA-Seq to assess
whether transcription initiation from sites upstream of canonical
TSSs gives rise to ectopic transcripts. Consistent with NF-Y
having roles beyond that of a canonical transcription activator,
loss of NF-YA led to both up- and downregulation of mRNA
levels (Supplementary Fig. 3g). Importantly, RNA-Seq
experi-ments in NF-YA-depleted cells revealed RNA emanating from
sites upstream of the canonical TSS at many NF-Y-bound
promoters (Fig.
2
e, f; Supplementary Fig. 3h).
Intriguingly, individual paired-end reads from RNA-Seq
experiments also revealed that RNAs originating from ectopic
TSSs can form stable multi-exonic transcripts (Fig.
2
g); we
confirmed this finding using RT-PCR experiments (Fig.
2
i).
Remarkably, in cases such as Hsp90b1, instead of simply
extending the 5′ end of the canonical mRNA, the ectopic
transcript incorporates a new splicing donor site, resulting in
transcripts that skip the canonical TSS, 5′UTR and first exon,
giving rise to a new isoform (* product in Fig.
2
h).
Because hundreds of genes change in expression in response to
NF-YA depletion (Supplementary Fig. 3g), we wondered if there
might be other TFs that could be responsible for the observed
effects. To objectively evaluate this possibility, we assessed the
enrichment of 680 TF-binding motifs (source: JASPAR databse)
within the promoter sequences (defined as 200 -bp upstream of
TSS) of Y-bound genes that exhibit a shift in TSS upon
NF-YA depletion. Our analysis revealed enrichment of 24 TF-binding
motifs (Supplementary Fig. 4a), of which 14 were also enriched
within promoters of non-NF-Y bound genes. Of the ten TF
motifs enriched only within promoter sequences of NF-Y-bound
genes that exhibit a shift in TSS (Supplementary Fig. 4b), eight are
not expressed (<1 RPKM) in the control or NF-YA KD ESCs,
leaving NF-YA and CREB1 as the only two TFs that could
potentially explain the observed effects. The NF-YA motif is
present in 88% of the promoters that exhibit a shift in TSS,
whereas the CREB1 motif is present in only 33% of the
promoters. Furthermore, unlike NF-YA, CREB1 is upregulated
(1.6-fold) in NF-YA KD ESCs, making it less likely to explain the
TSS shift. Nevertheless, to investigate whether CREB1
motif-containing promoters (that do not bind NF-YA) also exhibit
nucleosome encroachment and TSS shift, we examined
MNase-Seq and Start-MNase-Seq signals in control and NF-YA KD cells and
found no obvious changes in the nucleosome positioning or TSS
selection (Supplementary Fig. 4c, d) to suggest that CREB1 might
be responsible for the observed changes at NF-Y-bound genes
that exhibit a shift in TSS. Collectively, these data support our
conclusion that the observed effects are directly attributable to the
loss of NF-Y binding.
All our NF-YA KD studies were performed 48 h after siRNA
transfection, when NF-YA is depleted but the cells appear normal
with no obvious differentiation phenotype
24. But, to rule out the
possibility that the observed changes are due to ESC
differentia-tion as a result of NF-YA depledifferentia-tion, we assessed ectopic TSS
usage in ESCs undergoing retinoic acid (RA)-induced
differentia-tion. Four days of RA-induced differentiation did not elicit the
use of ectopic TSSs (Fig.
2
i), indicating that the observed
phenomenon is not due to global cellular differentiation effects
that may occur upon NF-YA KD. Knockdown of NF-YC, or all
three NF-Y subunits produced the similar results (Fig.
2
i), making
it unlikely that the observed changes are due to potential
off-target effects involving siRNA off-targeting NF-YA. Collectively,
these
findings suggest that NF-Y binding impacts TSS selection at
promoters of protein-coding genes, and that ectopic initiation
creates aberrant mRNA species.
DNA sequence implication in
NF-YA KD-induced effects. In
about 22% of the cases of TSS-shifted genes, such as with the Ezh2
gene (Fig.
3
a), the ectopic TSS used in response to NF-YA KD
corresponds to a previously described alternative TSS, indicating
that DNA sequence-based elements play a role in defining sites of
ectopic transcription initiation. To further our understanding of
how ectopic nucleosome and TSS positioning are established in
NF-Y’s absence, we examined the DNA sequence underlying the
regions surrounding the canonical and ectopic TSS of
NF-Y-bound genes that exhibit TSS shifts upon NF-YA KD. De novo
motif analysis (±5 bp) surrounding the canonical and ectopic
TSSs, as determined using Start-Seq, revealed the typical YR
initiator dinucleotide
11(Fig.
3
b), indicative of a sequence
recog-nition mechanism determining the location of ectopic TSSs.
We thus we investigated sequence conservation of the regions
containing ectopic TSSs. PhyloP conservation scores were
calculated from genomic sequence alignment across placental
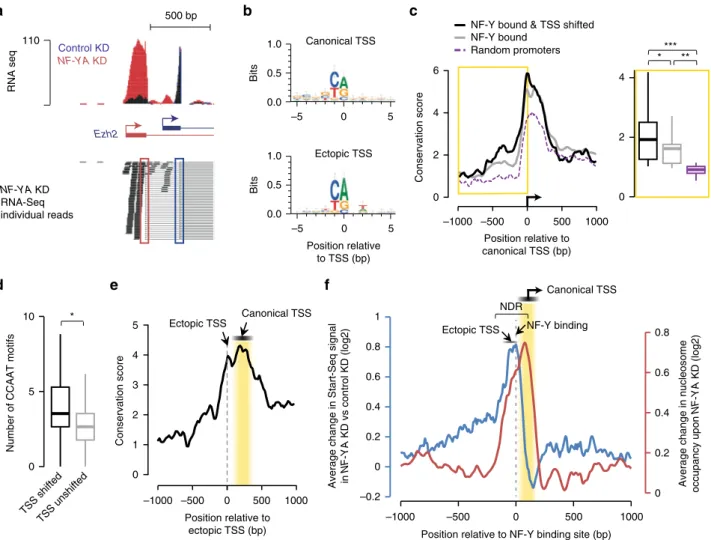
Fig. 2 NF-Y binding influences PIC positioning and TSS selection. a Genome browser shots of NF-Y target genes in ESCs showing NF-YA occupancy (ChIP-Seq), transcription initiation-associated RNA enrichment (Start-(ChIP-Seq), and gene expression (RNA-Seq) in control andNF-YA KD ESCs. Arrows highlight regions with ectopic transcription initiation or RNA inNF-YA KD cells. Gene structure is shown at the bottom along with PCR amplicons used for RT-qPCR analysis in Fig. 2i.b Relative fold change (log2) in Start-Seq signal (red, gain; blue, loss) near TSSs of NF-Y-bound genes exhibiting TSS shifts (n = 538) in NF-YA KD vs control KD cells. c Left: average fold change (log2) in Start-Seq signal near TSSs of NF-Y bound genes exhibiting TSS shifts (red), NF-Y-bound genes (black), and non-NF-Y-bound genes (gray) inNF-YA KD vs. control KD cells. Also shown is the average NF-YA occupancy (blue; secondary y-axis) in ESCs. Right: box plot showing the distribution of fold changes in Start-Seq signal (inNF-YA KD vs. control KD ESCs) within the upstream proximal-promoter regions (−200 bp to −50 bp; highlighted in yellow). ***P-value = 1.01E-66, ****P-value = 3.53E-128 (Wilcoxon rank-sum test, two sided) d Box plot showing the distribution of maximum differences in Start-Seq read count between control andNF-YA KD cells within the region upstream of TSS (−900 to −25bp). A 10 -bp sliding window was used for computing read count differences. Genes with NF-Y binding were binned into six groups based on NF-YA ChIP-Seq read count within−900 to +100 bp of TSS. *P-value < 0.05, **P-value < 0.0009, ***P-value = 4.47E-07,#P-value = 1.16E-18,##
P-value= 2.49E-18 (Wilcoxon rank-sum test, two-sided). e Same as (b), but for RNA-Seq data. f Same as (c), but for RNA-Seq data. ***P-value = 5.39E-120, ****P-value = 3.44E-158 (Wilcoxon rank-sum test, two-sided). g, h Genome browser shot showing RNA-Seq signal at the Hsp90b1 gene in control (blue) or NF-YA KD (red) ESCs (g). Arrow highlights region with ectopic RNA in NF-YA KD cells. A representative selection of individual RNA-Seq reads is shown beneath. Red and blue rectangles highlight the ectopic and endogenous splice sites, respectively. Schematic of the RT-PCR results shown at the bottom represent the different PCR amplification products shown in (h). PCR amplification was performed using the “ectopic” primer pair shown underneath the gene structure (g). * denotes new isoform fragment (bypassing the canonical 5’UTR, TSS and the 1st exon), ** denotes mRNA fragment with prolonged 5′ fragment (uses the canonical 1st exon), *** denotes pre-mRNA fragment, and # denotes non-specific/unknown fragment. i RT-qPCR analysis of relative gene expression using the“total” and “ectopic” primer pairs shown in Fig. 2a. Data normalized to Actin, HAZ and TBP. Error bars, SEM of three to five biological replicates
mammals
32and NF-Y-bound promoters were compared with an
equivalent number of randomly chosen gene promoters. This
analysis revealed significantly higher conservation of the region
immediately upstream of canonical TSSs of NF-Y-bound genes
(Fig.
3
c). Further, the conservation at NF-Y-bound and
TSS-shifted promoters is even higher than that at NF-Y-bound
promoters in general (Fig.
3
c), along with a higher enrichment of
CCAAT motifs (Fig.
3
d) and NF-Y occupancy (Supplementary
Fig. 3e). Focusing our analysis specifically on ectopic TSSs, we
discovered a high degree of sequence conservation starting at the
ectopic TSS and continuing downstream toward the canonical
TSS (Fig.
3
e), with the NF-Y-binding motif more strongly
conserved than the regions immediately surrounding it
(Supple-mentary Fig. 5a). Therefore, based on the high-level of
conservation of NF-Y-bound promoter regions, and similarities
in NF-Y-binding pattern between mouse and human
(Supple-mentary Fig. 5b), we propose that NF-Y’s role in the organization
of the NDR and in TSS selection is likely conserved in other
species.
Altogether, our data, which shows that the ectopic initiation
sites are generally located upstream of the NF-Y binding and that
the ectopic nucleosomes are observed downstream of the NF-Y
binding (Fig.
3
f), suggest that NF-Y controls the
fidelity of
transcription initiation at a subset of gene promoters through two
complementary mechanisms: (i) NF-Y promotes transcription
from the canonical TSS by maintaining the integrity of the NDR,
and (ii) NF-Y binding within the NDR per se, either directly or
indirectly, prevents PIC from
“accidental” utilization of aberrant,
upstream sites for transcription initiation.
RNAs from ectopic TSSs in NF-Y-depleted cells undergo
translation. Considering the importance of the 5′UTR in the
regulation of translation
33, and the fact that close to 70% of genes
Canonical TSSb
a
500 bp Ezh2 Control KD NF-YA KD RNA seq 110 NF-YA KD RNA-Seq individual reads 1.0 0.0 0.5 –5 0 5 Bits 1.0 0.0 0.5 –5 0 5 Ectopic TSS Position relative to TSS (bp) Bitse
Conservation score 0 1 2 3 4 1000 –1000 –500 0 500 Position relative to ectopic TSS (bp) 5 Ectopic TSS Canonical TSSNumber of CCAAT motifs
0 5 10 TSS shifted TSS unshifted
d
* –1000 –500 0 500 1000 –0.2 0 0.2 0.4 0.6 0.8 1 0 0.2 0.4 0.6 0.8Average change in Start-Seq signal in
NF-YA
KD vs control KD (log2)
Average change in nucleosome occupancy upon
NF-YA
KD (log2)
Position relative to NF-Y binding site (bp) Canonical TSS
Ectopic TSS NF-Y binding
c
NF-Y bound & TSS shifted Random promoters NF-Y bound 0 2 4 6 Conservation score 1000 –1000 –500 0 500 * Position relative to canonical TSS (bp) 0 2 4 ** ***
f
NDRFig. 3 Characterization of ectopic TSSs. a Genome browser shot of RNA-Seq signal at theEzh2 gene showing an isoform switch in NF-YA KD (red) vs. control (blue) ESCs. A representative selection of individual RNA-Seq reads is shown beneath. Red and blue rectangles highlight the ectopic and endogenous splice sites, respectively.b Consensus sequence motif enriched within the 10 -bp region centered on canonical TSSs (top) or ectopic TSSs (bottom) of genes with promoter-proximal NF-Y binding, derived from de novo motif search.c Left: average sequence conservation in mammals, as computed using PhyloP76, of the 2-kb region centered on canonical TSS of genes with promoter-proximal NF-Y binding (gray,n = 3056), those that bind NF-Y and exhibit TSS shift (black,n = 538), or those chosen at random (purple, n = 538). Right: box plot showing PhyloP conservation score for the 1-kb region upstream of canonical TSS. *P-value = 0.01372, **P-value = 1.69E-10, ***P-value = 3.77E-12 (Wilcoxon rank-sum test, two-sided). d Box plot showing the number of CCAAT motifs within 1-kb region upstream of canonical TSS for genes with promoter-proximal NF-Y binding that exhibit TSS shifts (black) or not (gray) inNF-YA KD ESCs. *P-value = 6.67E-36 (Wilcoxon rank-sum test, two-sided). e Average sequence conservation in mammals, as computed using PhyloP76, of the 2-kb region centered on ectopic TSS of genes with promoter-proximal NF-Y binding that exhibit an ectopic TSS (n = 538). f Average fold change (log2; primaryy-axis) in Start-Seq signal (blue) in NF-YA KD vs. control KD ESCs near TSSs of NF-Y-bound genes exhibiting TSS shifts (red). Also shown is the average fold change (log2; secondaryy-axis) in nucleosome occupancy (red) in NF-YA KD vs. control KD ESCs. NDR nucleosome-depleted region
showing a TSS shift upon NF-YA KD possess an AUG
(transla-tion start codon) within the ectopically transcribed region
(Sup-plementary Data 1), we explored the potential impact of these
aberrant transcripts on translation output. To do so, we
per-formed Ribo-Seq, a ribosome-profiling experiment
34, on control
and NF-YA-depleted cells. By sequencing only the
ribosome-protected fraction of the transcriptome, Ribo-Seq allows us to
determine which RNAs are being actively translated at a given
time. Typical of Ribo-Seq, triplet phasing was observed beginning
at the annotated translation start site (Supplementary Fig. 6a),
whereas RNA-Seq presented a
flat, uniform distribution
(Sup-plementary Fig. 6a). To determine if the transcripts originating
from ectopic TSSs in NF-YA KD cells are also undergoing
translation, we investigated the differences in Ribo-Seq read
coverage within the region between the canonical and the ectopic
TSSs. At the individual gene level, we can clearly detect the
ribosome-protected RNA originating from the region upstream of
canonical TSSs of NF-Y-bound genes that exhibit ectopic
transcription initiation (Fig.
4
a; Supplementary Fig. 6b).
Fur-thermore, of the 429 NF-Y-bound genes with ectopic TSSs that
had sufficient Ribo-Seq coverage between the canonical and the
ectopic TSSs, 92% showed significantly higher levels of
ribosome-protected RNA in NF-YA KD cells compared with control KD
cells (Fig.
4
b, c). To ensure that the ribosome-protected RNA,
transcribed from the region between the ectopic TSS and
cano-nical TSS, is undergoing translation and is not an artefact, we
re-analyzed Ribo-Seq data for read coverage phasing after
indivi-dually determining which ectopically transcribed AUG was most
likely to be used as a translation start site for each gene. We found
a significant enrichment of triplet periodicity in the Ribo-Seq
read coverage beginning at the putative ectopic translation start
site, in NF-YA KD cells compared with control cells (Fig.
4
d),
indicating that the ectopically transcribed regions indeed undergo
translation.
In an attempt to evaluate whether these translated upstream
open-reading frames (ORFs) generate fusion or variant forms of
–3 –2 –1 0 1 2 3 4 5 –3 –2 –1 0 1 2 3 4 5 C7orf50 Hsp90b1 G3bp1 Khsrp Atp5g1 Nono Shc1 Ppp2r5d Orc6 Ezh2 Tmx2
a
b
d
1Kb NF-Y bound & TSS shifted (429)
Non-NF-Y bound (5,924)
Ribo-Seq expression (log10 RPKM)
in NF-YA KD cells Khsrp NF-YA ChIP-Seq RNA-seq Start-seq control KD Start-seq NF-YA KD 310 18 400 54 515 Ribo-seq control KD Ribo-seq NF-YA KD 35
Distance relative to ectopic ATG used upon NF-YA KD (bp)
Ribo-Seq read coverage (RPKM)
c
Control KD
NF-YA KD
Ribo-Seq expression (log10 RPKM) in control KD cells 0 50 100 150 0 500 1000 1500 2000 2500 –30 –20 –10 0 10 20 30 40
***
ns Ribo-Seq expression (RPKM) Control KD NF-YA KD Control KD NF-YA KD NF-Y bound& TSS shiftednon-NF-Y bound
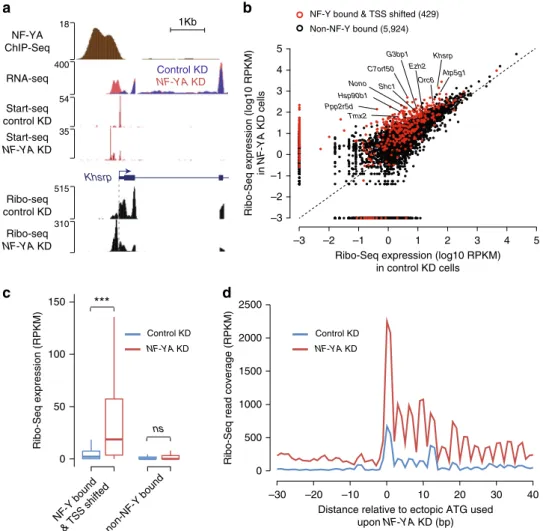
Fig. 4 Transcripts originating from ectopic TSSs in NF-Y-depleted cells undergo translation. a Genome browser shot of NF-Y target geneKhsrp showing ribosome-protected RNA expression, as measured using Ribo-Seq, in control andNF-YA KD ESCs. Also shown are tracks for NF-YA ChIP-Seq, and RNA-Seq and Start-RNA-Seq in control andNF-YA KD ESCs. b Scatter plot showing the Ribo-Seq expression (coverage), in control (x-axis) and NF-YA KD (y-axis) ESCs, of the region between the ectopic (shifted) TSS and 25 bp upstream of the canonical TSS of genes with promoter-proximal NF-Y binding that exhibit a TSS shift (red). For comparison purposes, Ribo-Seq expression of the region between 115 bp (median TSS shift distance) and 25 bp upstream of TSS of genes with no promoter-proximal NF-Y binding is shown (black). RPKM, reads per kilobase per million mapped reads.c Box plot showing the Ribo-Seq expression, in control (blue) andNF-YA KD (red) ESCs, of the region between the ectopic TSS and 25 bp upstream of the canonical TSS of genes with promoter-proximal NF-Y binding that exhibit an ectopic TSS. For comparison purposes, Ribo-Seq expression of the region between 115 bp (median TSS shift distance) and 25 bp upstream of TSS of genes with no promoter-proximal NF-Y binding is shown. ***P-value = 8.21E-39 (Wilcoxon rank-sum test, two-sided).d Ribo-Seq read coverage, centered on the most likely ectopic start codon (ATG), in control andNF-YA KD ESCs. Only genes with promoter-proximal NF-Y binding that exhibit an ectopic TSS inNF-YA KD ESCs were used (n = 429)
endogenous protein, we performed western blot analysis, using
commercially available antibodies for candidate proteins, in cells
depleted of NF-YA and treated with the proteasome inhibitor
MG-132 (to stabilize any unstable fusion proteins; Supplementary
Fig. 6c, d). We did not detect any obvious aberrant fusion/variant
protein of distinct molecular weight. However, in notable cases,
we did detect altered protein expression levels. For a number of
NF-Y-bound and TSS-shifted genes, there is a noticeable
discordance between the manners with which the RNA and
protein levels change in response to NF-YA KD (Supplementary
Fig. 6d). This was surprising considering that changes in
transcript levels generally result in proportional changes in
protein abundance (Spearman correlation of ~0.8
35,36). Recent
studies have shown that upstream ORFs (uORFs) can have either
a favorable or a deleterious effect on downstream mRNA
translation
37–41and suggested that the abundance of transcript
is less important than the difference in translatability of the
canonical versus ectopic transcript
39. Thus, in situations wherein
an upstream extension of the transcript leads to altered protein
production, we speculate that this could be due to introduction of
an uORF. To summarize, we establish here that transcripts
originating from ectopic TSSs undergo translation, and highlight
the variable effects this can have on the translation of the
canonical ORF within these transcripts.
Discussion
Driven by the prevalence of the CCAAT motif(s) within core
promoters, NF-Y’s function as a regulator of gene expression has
almost exclusively been studied in relation to its
promoter-proximal binding. Yet, the exact mechanism by which it exerts
control over gene expression remains poorly understood.
Through comprehensive genome-wide studies in ESCs, we have
uncovered a previously unidentified role for NF-Y in safeguarding
the integrity of the NDR structure, PIC localization, and TSS
selection at protein-coding genes.
NF-Y can access its target DNA motif, the CCAAT box, in a
heterochromatic environment
25. Furthermore, NF-Y’s unique
DNA-binding mode, which induces an
∼80° bend in the DNA,
may allow and/or promote binding of other TFs, whose
recog-nition sequences become more accessible
24. Supporting this
the-sis, DNase experiments have shown that NF-Y is essential for the
maintenance of an accessible chromatin
24,42,43. These attributes
have led us and others to propose that NF-Y is a
“pioneer
factor”
22,24,25,42–44.
Through comparison of NF-YA ChIP-Seq and MNase-Seq
data, we have shown mutual exclusivity between NF-Y and
nucleosome occupancy genome-wide (Fig.
1
b, g; Supplementary
Fig. 2a). Given that the structure and DNA-binding mode of
NF-YB/NF-YC HFDs are similar to those of the core histones H2A/
H2B
22,23,45,46, our
findings suggest steric incompatibility between
NF-Y and nucleosomes. This conclusion is supported by the
observation that upon NF-YA KD, nucleosomes bind within the
NDRs left vacant by NF-Y, positioning them in a manner that
strongly reflects DNA sequence preferences (Supplementary
Fig. 2e).
The presence of a well-defined NDR within active gene
pro-moters is essential for access by GTFs and PIC assembly, and thus
correct transcription initiation. While NF-Y binding does not
seem to impact positioning of the
+1 or −1 nucleosomes that
demarcate the NDR (Fig.
1
e, h), we
find that NF-Y is essential for
maintaining a nucleosome-depleted NDR. Although we cannot
rule out the possibility that NF-Y recruits an ATP-dependent
chromatin remodeler to orchestrate nucleosome removal, given
NF-Y’s capacity to disrupt the compaction of the chromatin, it is
tempting to speculate that NF-Y, with its sequence-specific
binding ability, could be acting as an ATP-independent
chro-matin remodeler. This idea is supported by previous
findings that
show NF-Y’s capacity to displace nucleosomes in an in vitro
context
47,48. Overall, it seems that proteins with tertiary
struc-tures similar to core histones can independently preclude
nucleosome occupancy. It will be interesting to see if all proteins
containing histone-fold domains have a similar effect on
nucleosome binding, as has been shown to be the case with
subunits of the CHRAC complex
49.
NF-Y has been shown to play a direct role in the recruitment of
the pre-initiation complex through interactions with TBP and
several TAFs
28,50. We have shown here that NF-Y also plays an
indirect role in the recruitment of PIC-associated proteins, since
its binding to promoter-proximal regions is necessary for the
maintenance of an open-chromatin structure over the TSS,
allowing for effective binding of the transcription machinery. In
the case of NF-Y’s indirect impact on PIC recruitment, we
observed an associated upstream shift in TSS location upon
NF-YA KD (Fig.
2
b). Yet, it is interesting to note that only a subset of
NF-Y-bound genes exhibits this TSS shift. Besides the strength
and stability of NF-Y binding and the number of binding events,
this likely reflects involvement of additional factors. Our analyses
show that efficient utilization of an ectopic TSS requires sequence
features within the exposed DNA that are amenable to proper
PIC binding, such as previously described alternative start sites
(as is the case for Ezh2; Fig.
3
a) or initiator motifs. Moreover, our
discovery that a majority of the ectopic TSSs are observed to
occur near CCAAT boxes (Fig.
3
c) suggests that NF-Y binding
within the NDR by itself could sterically hinder PIC from
aber-rant utilization of alternative sites for transcription initiation.
We thus conclude that NF-Y binding at promoters serves at
least three roles: (1) direct PIC recruitment to the promoter
region through its interactions with TBP and the TAFs, (2)
prevent ectopic nucleosome binding within the NDR through its
nucleosome-like structural properties and DNA-binding mode,
and (3) occlude alternative transcription initiation sites to ensure
correct TSS usage. The shift in TSS usage upon NF-YA KD
appears to stem from the two latter roles, whereby, upon loss of
NF-Y binding, a potential transcription initiation site is
uncov-ered while, simultaneously, a nucleosome prohibits optimal PIC
binding to the canonical TSS, forcing the PIC to relocate to an
accessible site upstream. Our
findings are consistent with studies
in transgenic mice showing that the CCAAT-containing Y-box
sequence is critical for accurate and efficient transcription and
that deletion of the Y-box results in aberrant transcripts initiating
from regions upstream of canonical TSS
51.
As might be expected, the usage of an ectopic, upstream TSS
has variable consequences on the steady-state levels of resulting
mRNAs and protein products. The strength of the ectopic
initiation site along with the regulatory potential of the additional
upstream mRNA sequences (region between the ectopic and the
canonical TSS) undoubtedly impact transcription levels and
mRNA stability. In addition, the TSS employed in NF-YA
depleted cells could represent a known alternative start site (as in
the case of Ezh2; Fig.
3
a) or generate a previously uncharacterized
mRNA isoform (as with Hsp90b1; Fig.
2
i). Furthermore, the
upstream extension of mRNA to include a novel ORF can cause
abnormal translation (as with Khsrp and C7orf50; Fig.
4
a and
Supplementary Fig. 4b, respectively). All of these sequelae can
affect the quantity and quality of mRNAs and proteins, which
could have significant, yet unpredictable, consequences on cell
survival or function.
Notably, NF-Y predominantly binds the CG-rich promoters of
essential genes (cell-cycle, transcription, DNA repair, etc.), whose
accurate expression is vital in most cell types
24,25. In fact, ~80% of
Unlike CG-poor promoters, which often correspond to
tissue-specific genes and initiate transcription from a well-defined site,
CG-rich promoters contain a broad array of transcription
initiation sites and often associate with housekeeping genes
2,11,52.
The requirement for NF-Y at promoters of essential genes could
reflect both the role of NF-Y in PIC recruitment, and
enforce-ment of appropriate TSS usage.
We suggest that this dual role for NF-Y may explain why
promoter-proximal NF-Y binding is so well conserved across
mouse and human cell types. Intriguingly, studies in
Sacchar-omyces pombe have shown that deletion of Php5, an NF-YC
orthologue, leads to an ~250 -bp upstream shift in TSS of the
gluconeogenesis gene Fbp1
53. Moreover, in Saccharomyces
cervi-siae, out of the 46 TFs studied, the binding sites for NF-YA
homolog Hap2 were shown to have the biggest difference in
predicted nucleosome occupancy between Hap2-bound (lower
nucleosome occupancy) and non-Hap2-bound (higher
occu-pancy) sites
54. This opens the exciting possibility of NF-Y’s role
in promoter chromatin organization being conserved throughout
the eukaryotic kingdom.
A consequence of altered TSS selection upon NF-YA KD is that
ribosomes can scan over any ectopic mRNA. Ribosomes typically
initiate translation upon encountering the AUG start codon,
although other codons have been shown to induce translation
initiation
55–57. In our study, we found that nearly three quarters
of genes showing a TSS shift upon NF-YA KD possess at least one
ATG triplet between the ectopic and the canonical TSS.
Impor-tantly, we found evidence for translation initiation from such sites
(Fig.
4
d). Given that uORFs can modulate downstream
transla-tion and thus act as potent regulators of translatransla-tion and protein
expression
38–41,58, it is conceivable that translation initiation
from noncanonical start codon(s) within uORFs alters the
read-ing frame and/or protein length; alternatively, it may affect the
efficiency with which ribosomes translate the rest of the
transcript
59.
In summary, our studies describe NF-Y’s mechanistic role at
promoters, where it is necessary for both maintenance of the
NDR’s structural architecture and correct positioning of the
transcriptional machinery, therefore influencing TSS selection.
Furthermore, our results strongly suggest that the sites of NF-Y
binding and the
+1 nucleosome demarcate the 5′ and 3′
boundaries, respectively, of the region available for PIC assembly,
thereby directing the transcription machinery to the correct TSS
while occluding alternative TSSs and other sites of sub-optimal
transcription initiation. It will be interesting to explore whether
other histone-fold domain proteins, with similar structural and
DNA-binding properties analogous to NF-Y, may function in a
similar manner.
Methods
Mouse ESC cell lines, culture, and RNAi. Mouse ESCs (E14Tg2a; ATCC, CRL-1821) were maintained on gelatin (Sigma, G1890)-coated plates in the ESGRO complete plus clonal grade medium (Millipore), as previously described24,60. For
experiments, ESCs were cultured on gelatin-coated plates in the M15 medium: DMEM (Thermo Fisher, 11965084) supplemented with 15% FBS (Gemini, 100–125), 10 μM 2-mercaptoethanol (Sigma, M3148), 0.1 mM nonessential amino acids (Thermo Fisher, 11140050), 1x EmbryoMax nucleosides (Millipore, ES-008-D), 1 U/ml of ESGRO mLIF (Millipore, ESG1107).
Transient transfection. For transfections, ESCs were cultured in the M15 medium and transfected with 50 nM siRNA using Lipofectamine 2000 (Thermo Fisher, 11668019) at day 0 and collected after 48 h. Gene-specific siRNAs used: NF-YA (Qiagen, SI01327193), NF-YB (Invitrogen, MSS247473), NF-YC (Qiagen, SI05348217), non-targeting control (Dharmacon, D- 001810–02–50).
Chromatin immunoprecipitation. ChIP was performed as previously described24.
Briefly, mouse ESCs (1 × 10⁷) were cross-linked with 1% formaldehyde (Sigma,
F8775) in the DMEM (Thermo Fisher, 11965084) for 10 min, and the reaction was
quenched by the addition of glycine (Sigma, G8898) at afinal concentration of 125 mM for 5 min. Cells were washed twice with PBS, and resuspended in 1 ml of lysis buffer A [50 mM HEPES (Sigma, H3375) pH 7.5; 140 mM NaCl (Sigma, S5150); 1 mM EDTA (Gibco, 15575–038); 10% glycerol; 0.5% IGEPAL CA-630 (Sigma, I3021); 0.25% Triton X-100 (Sigma, X100); 1× complete protease inhibitor mixture (Roche, 4693159001), 200 nM PMSF (Sigma, P7626)]. After 10 min on ice, the cells were pelleted and resuspended in 1 ml of lysis buffer B [10 mM Tris-HCl (Sigma, T2663) pH 8.0; 200 mM NaCl (Sigma, S5150); 1 mM EDTA (Gibco, 15575–038); 0.5 mM EGTA (Bioworld, 40520008–2); 1x protease inhibitors (Roche, 4693159001); 200 nM PMSF (Sigma, P7626)]. After 10 min at room temperature, cells were sonicated in lysis buffer C [10 mM Tris-HCl (Sigma, T2663) pH 8.0; 100 mM NaCl (Sigma, S5150); 1 mM EDTA (Gibco, 15575–038); 0.5 mM EGTA (Bioworld, 40520008–2); 0.1% sodium deoxycholate (Sigma, 30970); 0.5% N-lauroylsarcosine (MP, Biomedicals, 190110); 1× protease inhibitors (Roche, 4693159001); 200 nM PMSF (Sigma, P7626)] using Diagenode Bioruptor for 16 cycles (30 s ON; 50 s OFF) to obtain ~200–500 -bp fragments.
Cell debris were pre-cleared by centrifugation at 14,000 rpm for 20 min, and 25μg of chromatin was incubated with either NF-YA (Santa Cruz, G-2, sc-17753X), histone H3 (Abcam, ab1791), RNA Pol II (Covance, MMS-126R) or TBP (Abcam, ab51841) antibodies overnight at 4 °C. Protein A/G-conjugated magnetic beads (Pierce Biotech, 88846/88847) were added the next day for 2 h. Subsequent washing and reverse cross-linking were performed as previously described (Heard et al., 2001)61. ChIP enrichment for a primer-set was evaluated using quantitative
PCR, as percentage of input, and normalized to a negative primer set. See Supplementary Data 2 for the list of primers used.
DNase I hypersensitivity. DNase I hypersensitivity experiments were performed as previously described24. Briefly, mouse ESCs treated with nontargeting control
siRNA (Dharmacon, D-001810–02–50), or NF-YA siRNA (Qiagen, SI01327193) were collected 48 h post transfection in cold PBS. Nuclei were isolated by incu-bation of 107cells for 10 min on ice with 5 ml RSB buffer [10 mM Tris-HCl (Sigma,
T2663) pH 7.4; 10 mM NaCl (Sigma, S5150); 3 mM MgCl2(Sigma, M2670);
0.15 mM spermine (Sigma, S3256); 0.5 mM spermidine (Sigma, S0266); 1 mM PMSF (Sigma, P7626); 0.5% IGEPAL CA-630 (Sigma, I3021)], and pelleted by centrifugation at 300 g and 4 °C for 10 min Nuclei were then resuspended in 1 ml DNase reaction buffer [40 mM Tris-HCl (Sigma, T2663) pH 7.4; 10 mM NaCl (Sigma, S5150); 6 mM MgCl2(Sigma, M2670); 1 mM CaCl2(Sigma, C1016);
0.15 mM Spermine (Sigma, S3256); 0.5 mM Spermidine (Sigma, S0266)] and counted. Additional resuspension buffer was used to generate equal concentrations of nuclei between samples.
Nuclei from 5 × 10⁵cells were aliquoted into microcentrifuge tubes and
incubated at 37 °C for 5 min with varying amounts of DNase (0–75 U; Worthington, LS006344). Digestion was stopped by addition of an equal volume of termination buffer [10 mM Tris (Sigma, T2663) pH 7.4; 50 mM NaCl (Sigma, S5150); 100 mM EDTA (Gibco, 15575–038); 2% SDS (Fisher Scientific, BP166); 10μg/ml RNAse cocktail (Ambion, AM2286)]. The nuclei were then incubated at 55 °C for 15 min, followed by addition of 2μl of 20 mg/ml Proteinase K (Thermo Fisher, 25530049). Reaction mixtures were incubated overnight at 55 °C, followed by a phenol–chloroform extraction of the DNA. The DNA was then precipitated and resuspended in 100μl H2O. See Supplementary Data 2 for the list of
primers used.
Quantitative RT-PCR. Quantitative RT-PCR was performed as previously described24. Briefly, the total RNAs were prepared from cells using Qiazol lysis
reagent (Qiagen, 79306), and cDNAs were generated using the iScript kit (Bio-Rad, 1708891) according to the manufacturer’s instructions. Quantitative PCRs were performed on the Bio-Rad CFX-96 or CFX-384 Real-Time PCR System using the SsoFast EvaGreen supermix (Bio-Rad, 1725201). Three or more biological repli-cates were performed for each experiment. The data are normalized to Actin, Haz, and TBP expression, and plotted as mean+/− SEM. See Supplementary Data 2 for the list of primers used.
Western blot. Western blots were performed as previously described24. Briefly, cell
pellets, lysed in RIPA buffer [25 mM Tris-HCl (Sigma, T2663) pH 7.4; 150 mM NaCl (Sigma, S5150); 1% IGEPAL CA-630 (Sigma, I3021); 1% sodium deox-ycholate (Sigma, 30970)] with protease inhibitors (Roche, 4693159001), were sonicated using Bioruptor (Diagenode) for three cycles (30 s ON; 50 s OFF). The lysate was boiled with SDS-PAGE sample buffer (Sigma, S3401), loaded onto NuPAGE gel (Thermo Fisher, NP0321BOX), and transferred using iBlot 2 Transfer Stacks (Thermo Fisher, IB23001). The membranes were then blocked with Odyssey blocking buffer (LI-COR, P/N 927–40000) for 1 h at room temperature with gentle shaking. Each membrane was treated with appropriate primary and secondary (IRDye; LI-COR) antibodies. RNA Pol II and NF-YA levels were measured using an anti-Rpb3 antibody62and anti-NF-YA antibody (G-2; Santa Cruz, sc-17753X),
respectively, with Ran (BD Bioscience, 610341) as a loading control. The following antibodies were used in Supplementary Fig. 4: Ppp2r5d (Bethyl, A301–100A), Tmx2 (Abcam, ab105675), Atp5g1 (Abcam, ab180149), Nono (Santa Cruz, sc-166702), C7orf50 (Bethyl, A305–091A), Orc6 (Santa Cruz, sc-390490), Shc1 (Bethyl, A302–019A), Khsrp (Bethyl, A302–021A), and Gapdh (Santa Cruz,
sc-25778). The membranes were then washed in PBS (0.1% Tween 20), rinsed with PBS, and scanned and quantified on an Odyssey imaging system.
MNase-Seq. ES cells were cross-linked for 45 s with 1% formaldehyde (Sigma, F8775) followed by glycine (125 mM; Sigma, G8898) quenching for 5 min. Cells were washed once with ice-cold PBS and gently resuspended in 300μl RSB [10 mM Tris-HCL (Sigma, T2663) pH 7.4; 10 mM NaCl (Sigma, S5150); 3 mM MgCl2
(Sigma, M2670); 1 mM PMSF (Sigma, P7626); 0.15 mM Spermine (Sigma, S3256); 0.5 mM Spermidine (Sigma, S0266)]. 7 ml of RSB+ 0.5% IGEPAL CA-630 (Sigma, I3021) were slowly added, and the solution was incubated on ice for 10 min Nuclei were pelleted at 300 X G for 10 min at 4 °C and resuspended in 400μl of digest buffer [15 mM Tris (Sigma, T2663) pH 8.0; 60 mM KCl (Sigma, P9541); 15 mM NaCl (Sigma, S5150); 1 mM CaCl2(Sigma, C1016); 0.25 M sucrose (MP
Biome-dicals, 152584); 0.5 mM DTT (Roche, 10708984001)], and incubated with 40 U of MNase (Worthington, LS004797) for 5 min 400μl stop solution [1% SDS (Fisher Scientific, BP166); 0.1 M sodium bicarbonate (Sigma, S6014); 20 mM EDTA (Gibco, 15575–038)] was added and digested nuclei were incubated at 65 °C for 90 min 24μl Tris (Sigma, T2663) pH 7.6, 3 μl Proteinase K (Thermo Fisher, 25530049)), and 3μl GlycoBlue (Ambion, AM9515) were added and digestions were incubated overnight at 65 °C. DNA was extracted by phenol–chloroform extraction, and mono-nucleosome fragments were gel-purified from fractions digested to ~70% mono-nucleosome, ~20% di-nucleosome, and ~10% tri-nucleosome sized fragments. MNase-Seq libraries were prepared using NuGen’s Ovation Ultralow Library System V2 (NuGen, 0344NB-08). See Supplementary Data 2 for the list of primers used.
MNase-Seq data analysis. MNase-Seq read pairs for all samples were aligned to the mouse (mm9) genome using Bowtie63, retaining only uniquely mappable pairs
(-m1, -v2, -X10000,–best). Fragments shorter than 120 nt and larger than 180 nt werefiltered, as were all duplicate fragments, using custom scripts. Replicates were merged for each condition, and normalized per ten million uniquely mappable, non-duplicate fragments. BedGraphfiles containing single-nucleotide resolution fragment centers were generated to facilitate metagene analyses and creation of heatmaps, while whole-fragment coverage bedGraphs were generated for visuali-zation purposes.
ATAC-Seq. 25,000 cells were incubated in CSK buffer (10 mM PIPES pH 6.8, 100 mM NaCl, 300 mM sucrose, 3 mM MgCl2, 0.1% Triton X-100) on ice for 5 min
and then centrifuged for 5 min at 4 °C and 500 g. After discarding the supernatant, an aliquot of 2.5 µl of Tn5 Transposase was added to a total 25 µl reaction mixture (TD buffer+ H2O). The solution was then heated at 37 °C for 30 min (with mixing
every 10 min). The solution was cleaned up using a MinElute Qiagen kit. After PCR amplification (eight total cycles), DNA fragments were purified with two successive rounds of AMPure XP beads (1:3 ratio of sample to beads).
ATAC-Seq data analysis. Low-quality reads were removed if they had a mean Phred quality score of <20. Any reads with Nextera adapter sequence were trim-med using cutadapt v1.12. Reads were aligned using Bowtie v1.2 with the following parameters:“-v 2 -m 1 –best –strata”. Reads aligning to the mitochrodia (chrM) were removed, and reads were deduplicated by removing read pairs with both mates aligning to the same location as another read pair. To measure open chromatin, coverage tracks were generated using thefirst 9 bp of both mates of the aligned reads (corresponding to where the transposase is bound). For smoother coverage tracks that provide better visibility in the genome browser, the original 9 -bp regions were extended in both directions an equal distance until the region was 51 -bp long. Coverage tracks were normalized to read coverage per ten million mapped reads (after removing chrM and deduplication).
RNA-Seq. The total RNA was extracted with Qiazol lysis reagent (Qiagen, 79306) treatment and ethanol precipitation. The samples were then treated with DNAseI Amplification grade (Thermo Scientific, 18068015) and stranded libraries were prepared using the TruSeq stranded RNA kit (Illumina, 20020598) with RiboZero depletion (Gold kit; Illumina, MRZG12324).
RNA-Seq data analysis. Reads were mapped to the mouse (mm9) genome using TopHat v2.1.064. In order to get the transcripts GTF from our samples, Cufflinks65
was run with the following options, -g (mm9 GTF from ENSEMBL, version 67, provided as guide). We generated transcriptome assemblies for each of these samples separately and then use Cuffmerge65to combine all the annotations. We
used Deseq266with default parameters for all differential expression analyses with
gene count data from Salmon quantification67.
Start-Seq. RNA for Start-Seq experiments were prepared from control or NF-YA KD cells, as previously described62. Briefly, mouse ESCs were grown as described
for RNA-Seq, and capped RNAs were isolated essentially as previously described68.
In brief, ~2 × 10⁷ESCs were trypsinized and collected by centrifugation. After
washing with ice-cold 1× PBS, cells were swelled in 10 ml of swelling buffer [10 mM Tris (Sigma, T2663) pH 7.5; 10 mM NaCl (Sigma, S5150); 2 mM MgCl2
(Sigma, M2670); 3 mM CaCl2(Sigma, C1016); 0.3 M sucrose (MP Biomedicals,
152584); 0.5% IGEPAL CA-630 (Sigma, I3021); 5 mM dithiothreitol (Sigma, D0632); 1 mM PMSF (Sigma, P7626); protease inhibitors (Roche, 4693159001), SUPERase-IN RNAse inhibitor (Ambion, AM2694)] by incubating for 15 min on ice followed by 14 strokes with a loose pestle. The dounced cells were spun for 5 min at 500x g, the supernatant (cytoplasm) was discarded, the pellet resuspended in 30 ml of swelling buffer, and spun as above. The supernatant was discarded and the nuclei pellet was resuspended in 1 ml of swelling buffer, aliquoted and stored at -80 °C. Libraries were prepared according to the TruSeq Small RNA Kit (Illumina, RS-200–0012). To normalize samples, 15 synthetic capped RNAs were spiked into the Trizol preparation at a specific quantity per 106cells, as previously described69.
Start-Seq data analysis. Start-Seq reads were trimmed for adapter sequence using cutadapt 1.2.1;70pairs with either mate trimmed shorter than 20 nt were discarded.
A single additional nucleotide was removed from the 3′ end of each read to facilitate mapping of fully overlapping pairs. Remaining pairs werefiltered for rRNA and tRNA by aligning to indices containing each using Bowtie 0.12.8 (-v2, -X1000,–best, –un, –max), and retaining unmapped pairs. Following this, a similar alignment was performed to an index containing the sequence of spike-in RNAs only (-m1, -v2, -X1000,–best, –un, –max), and finally, the remaining unmapped reads were aligned to the mouse (mm9) genome utilizing the same parameters, retaining only uniquely mappable pairs.
Strand-specific bedGraph files containing the combined raw counts of short-capped RNA 5′ ends for all control replicates were generated to facilitate observed TSS calling. For all other purposes, 5′ end counts were normalized per ten million mappable reads, then based on depth-normalized counts aligning to spike-in RNAs. Spike normalization factors were determined as the slope of the linear regression of each sample’s depth-normalized spike-in read counts versus the single sample with the lowest total count. Control and NF-YA knockdown bedGraphfiles were generated from these spike-normalized counts by taking the mean of all replicates, genome-wide, at single-nucleotide resolution.
Observed TSS calling. Observed TSSs were identified as previously described9,
based on the control Start-Seq data, using mm9 RefSeq annotations downloaded from the UCSC genome browser (January, 2015). Briefly, the position with the highest read count within 1000 nt of an annotated TSS, or that with the highest count within the 200 nt window of highest read density was selected, depending on proximity. When insufficient Pol II ChIP-Seq signal existed in the 501 nt window centered on the selected locus, relative to a comparable window about the anno-tated TSS (a ratio less than 2:3), the observed TSS was shifted to the location with the highest Start-Seq read count within 250 nt of the annotated TSS. When fewer thanfive reads were mapped to the selected locus, the annotated TSS was maintained. Groups of transcripts with identical observed TSS werefiltered, maintaining a single representative with the shortest annotated to observed TSS distance. Groups of observed TSSs within 200 nt of one another were similarly reduced byfirst removing any RIKEN cDNAs, predicted genes, or observed TSSs moved to the annotation due to lack of Start-Seq reads. Following this, a single observed TSS was selected based on observed to annotated proximity. In this manner, observed TSSs were called for 24,498 transcripts; of these, 16,483 were selected based on Start-Seq data, while for 8015 the annotated position was maintained. NF-Y-bound promoters were then identified as those with an NF-YA ChIP-Seq peak intersecting the observed TSS−900 to +100 nt window. Ectopic TSS calling. Ectopic TSSs were identified through the comparison of NF-YA knockdown Start-Seq read counts to control using DESeq71. Counts were
determined for all samples in 10-nt bins tiling the region−995 to +995 nt, relative to each observed TSS. Bins closer to an upstream or downstream TSS than their own were excluded, as were those in the observed TSS−25 to +24 nt region. Normalization was performed based on size factors calculated within DESeq from spike-in RNAs alone, ensuring these values were equivalent across all samples. All bins with a positive log2 fold change and adjusted p-value less than 0.1 were identified. If more than one bin associated with a single observed TSS was selected, that with the lowest adjusted p-value was retained. Within each of these bins, the position with the total Start-Seq read count across all NF-YA knockdown samples was selected as the ectopic TSS. In cases where multiple sites exist with identical counts, that closest to the observed TSS was selected.
Ribo-Seq. Approximately 8–9 × 10⁶ESCs (per sample) were treated with
cyclo-heximide (0.1 mg/ml; Sigma, 01810–1 G) for 1 min prior to trypsinization and cell lysis. Control and NF-YA KD cells were used as input material for the TruSeq Ribo Profile Mammalian Library Prep Kit (Illumina) following the manufacture’s protocol.
Ribo-Seq data analysis. The total RNA-Seq and ribosome-protected-RNA-Seq (Ribo-Seq) read pairs were trimmed with cutadapt;70fragments shorter than 15 nt
were discarded. Read pairs werefiltered for rRNA and tRNA by aligning to respective indices using Bowtie 0.12.8 (-v2, -X1000,–best, –un, –max), and retaining unmapped pairs. The remaining read pairs were aligned to the mouse (mm9) genome using STAR v2.6.0c72. The read counts intersecting CDSs were