API FAILURES IN OPENSTACK CLOUD ENVIRONMENTS
SEYED POOYA MUSAVI MIRKALAEI
DÉPARTEMENT DE GÉNIE INFORMATIQUE ET GÉNIE LOGICIEL ÉCOLE POLYTECHNIQUE DE MONTRÉAL
MÉMOIRE PRÉSENTÉ EN VUE DE L’OBTENTION DU DIPLÔME DE MAÎTRISE ÈS SCIENCES APPLIQUÉES
(GÉNIE INFORMATIQUE) AOÛT 2017
c
ÉCOLE POLYTECHNIQUE DE MONTRÉAL
Ce mémoire intitulé :
API FAILURES IN OPENSTACK CLOUD ENVIRONMENTS
présenté par : MUSAVI MIRKALAEI Seyed Pooya
en vue de l’obtention du diplôme de : Maîtrise ès sciences appliquées a été dûment accepté par le jury d’examen constitué de :
M. ANTONIOL Giuliano, Ph. D., président
M. KHOMH Foutse, Ph. D., membre et directeur de recherche M. DESMARAIS Michel C., Ph. D., membre
DEDICATION
ACKNOWLEDGMENTS
Firstly, I would like to express my sincere appreciation to my supervisor Dr. Foutse Khomh for the continuous support of my Master study and for his patience, motivation, and immense knowledge.
My sincere thanks also goes to Prof. Bram Adams who gave me co-guidance on writing my first scientific paper and how to be persistent on the work. Bram, I was lucky to work with you. I do not know how to say thanks to you. And my special thanks to Prof. Yann-Gaël Guéhéneuc who taught me the fundamentals of the empirical study in software engineering. I have learned a lot from you professors in the Department of Computer and Software Engineering. My studies would not have been possible without your helps.
Besides my advisor and my professors, I would like to thank the rest of my thesis commit-tee : Dr. Giuliano Antoniol, Dr. Foutse Khomh and Dr. Michel Desmarais for accepting my invitation to be jury members.
RÉSUMÉ
Des histoires sur les pannes de service dans les environnements infonuagiques ont fait les manchettes récemment. Dans de nombreux cas, la fiabilité des interfaces de programmation d’applications (API) des infrastructures infonuagiques étaient en défaut. Par conséquent, la compréhension des facteurs qui influent sur la fiabilité de ces APIs est importante pour améliorer la disponibilité des services infonuagiques. Dans cette thèse, nous étudions les défaillances des APIs de la plateforme OpenStack ; qui est la plate-forme infonuagique à code source ouvert la plus populaire à ce jour. Nous examinons les bogues de 25 modules contenus dans les 5 APIs les plus importantes d’OpenStack, afin de comprendre les défaillances des APIs infonuagiques et leurs caractéristiques. Nos résultats montrent que dans OpenStack, un tiers de tous les changements au code des APIs a pour objectif la correction de fautes ; 7% de ces changements modifiants l’interface des APIs concernés (induisant un risque de défaillances des clients de ces APIs). Grâce à l’analyse qualitative d’un échantillon de 230 défaillances d’APIs et de 71 défaillances d’APIs ayant eu une incidence sur des applications tierces, nous avons constaté que la majorité des défaillances d’APIs sont attribuables à de petites erreurs de programmation. Nous avons également observé que les erreurs de programmation et les erreurs de configuration sont les principales causes des défaillances ayant une incidence sur des applications tierces.
Nous avons mené un sondage auprès de 38 développeurs d’OpenStack et d’applications tierces, dans lequel les participants étaient invités à se prononcer sur la propagation de défaillances d’APIs à des applications tierces. Parmi les principales raisons fournies par les développeurs pour expliquer l’apparition et la propagation des défaillances d’APIs dans les écosystèmes infonuagiques figurent : les petites erreurs de programmation, les erreurs de configuration, une faible couverture de test, des examens de code peu fréquents, et une fréquence de production de nouvelles versions trop élevé.
Nous avons exploré la possibilité d’utiliser des contrôleurs de style de code, pour détecter les petites erreurs de programmation et les erreurs de configuration tôt dans le processus de développement, mais avons constaté que dans la plupart des cas, ces outils sont incapables de localiser ces types d’erreurs.
Heureusement, le sujet des rapports de bogues, les messages contenues dans ces rapports, les traces d’exécutions, et les délais de réponses entre les commentaires contenues dans les rapports de bogues se sont avérés très utiles pour la localisation des fautes conduisant aux défaillances d’APIs.
ABSTRACT
Stories about service outages in cloud environments have been making the headlines recently. In many cases, the reliability of cloud infrastructure Application Programming Interfaces (APIs) were at fault. Hence, understanding the factors affecting the reliability of these APIs is important to improve the availability of cloud services. In this thesis, we investigate API failures in OpenStack ; the most popular open source cloud platform to date. We mine the bugs of 25 modules within the 5 most important OpenStack APIs to understand API failures and their characteristics. Our results show that in OpenStack, one third of all API-related changes are due to fixing failures, with 7% of all fixes even changing the API interface, potentially breaking clients. Through a qualitative analysis of 230 sampled API failures, and 71 API failures that impacted third parties applications, we observed that the majority of API-related failures are due to small programming faults. We also observed that small programming faults and configuration faults are the most frequent causes of failures that propagate to third parties applications. We conducted a survey with 38 OpenStack and third party developers, in which participants were asked about the causes of API failures that propagate to third party applications. These developers reported that small programming faults, configuration faults, low testing coverage, infrequent code reviews, and a rapid release frequency are the main reasons behind the appearance and propagation of API failures. We explored the possibility of using code style checkers to detect small programming and configuration faults early on, but found that in the majority of cases, they cannot be localized using the tools. Fortunately, the subject, message and stack trace as well as the reply lag between comments included in the failures’ bug reports provide a good indication of the cause of the failure.
TABLE OF CONTENTS
DEDICATION . . . iii
ACKNOWLEDGMENTS . . . iv
RÉSUMÉ . . . v
ABSTRACT . . . vi
TABLE OF CONTENTS . . . vii
LIST OF TABLES . . . ix LIST OF FIGURES . . . x LIST OF ANNEXES . . . xi CHAPTER 1 INTRODUCTION . . . 1 1.1 Research Objectives . . . 2 1.2 Thesis Plan . . . 4 CHAPTER 2 BACKGROUND . . . 5 2.1 Cloud computing . . . 5 2.2 Public cloud . . . 5 2.3 Private cloud . . . 5 2.4 Hybrid Cloud . . . 5 2.5 Hypervisor . . . 6 2.6 IaaS . . . 6 2.7 PaaS . . . 6 2.8 SaaS . . . 6 2.9 AWS . . . 6 2.10 OpenStack . . . 7 2.11 Containers . . . 7 2.12 Containers vs Vms . . . 7
CHAPTER 3 LITERATURE REVIEW . . . 8
3.2 Failure Characterization . . . 8
3.3 API Failures in the Cloud . . . 9
3.4 Mining Software Repositories (MSR) . . . 11
3.5 Our Goal and Motivation . . . 11
CHAPTER 4 METHODOLOGY AND DESIGN . . . 13
4.1 Case Study Setup 1 . . . 13
4.1.1 Studied Systems . . . 13
4.1.2 Data Extraction . . . 14
4.1.3 Explanatory Model . . . 16
4.2 Case Study Setup 2 . . . 18
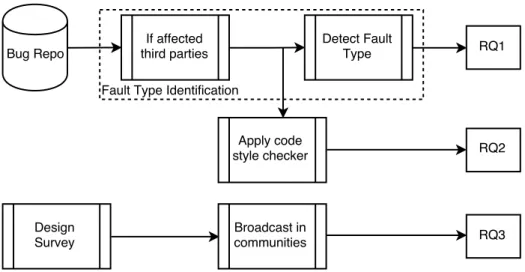
4.2.1 Fault Type Identification . . . 18
4.2.2 Apply Code Style Checkers . . . 19
4.2.3 Survey . . . 19
CHAPTER 5 CASE STUDY RESULTS . . . 21
5.1 (RQ1) How often are APIs changed to fix API failures ? . . . 21
5.2 (RQ2) What are the most common types of API failures and faults ? . . . . 22
5.3 (RQ3) What are the bug fixing characteristics of the different fault types ? . 25 5.4 (RQ4) What are the main factors explaining the bug fixing process of small programming faults ? . . . 30
5.5 (RQ5) What type of faults are the most impactful ? . . . 32
5.6 (RQ6) Are code style checkers able to localize the faults behind the API failures ? 33 5.7 (RQ7) Why do faults propagate from OpenStack to third-party software ? . . 34
CHAPTER 6 THREATS TO VALIDITY . . . 37
6.1 Construct validity threats . . . 37
6.2 Internal validity threats . . . 37
6.3 Threats to external validity . . . 38
CHAPTER 7 CONCLUSION . . . 39
7.1 Summary of the Results . . . 39
7.2 Future Work . . . 40
REFERENCES . . . 41
LIST OF TABLES
Table 4.1 Characteristics studied . . . 14 Table 4.2 Confusion Matrix . . . 18 Table 4.3 Descriptive statistics of the APIs. . . 19 Table 5.1 Analysis of the 25 most important modules in OpenStack. TC :Total
Commits, MSC : Method Signature Changes, NMSC : Non Method Signature Changes, FB : Fixing Bugs. All percentages are relative to TC. . . 23 Table 5.2 Prevalence of API fault types . . . 26 Table 5.3 Prevalence of API failure types . . . 30 Table 5.4 Decision tree top-node analysis score of metrics after 100 iterations. . 30 Table 5.5 Fault types found that affected third parties. . . 33 Table 5.6 Test case statistics. . . 33
LIST OF FIGURES
Figure 1.1 A sample of a third party program (e.g., Docker) calling OpenStack
APIs [53]. . . 2
Figure 1.2 Overview of our approach for answering RQ1, RQ2, RQ3 and RQ4 . . 2
Figure 1.3 Overview of our approach to answer RQ6, RQ7 and RQ8. . . 3
Figure 4.1 Overview of our approach for answering RQ4 . . . 17
Figure 5.1 Bug No.1362221-Small programming fault. . . 25
Figure 5.2 Bug No.1362985-Major programming fault. . . 25
Figure 5.3 Bug No.1354500-Configuration fault. . . 25
Figure 5.4 Bug No.1339235-Race condition. . . 26
Figure 5.5 Bug No.1370191-Deadlock condition . . . 27
Figure 5.6 Bug No.1333177-Data format fault . . . 27
Figure 5.7 Bug No.1272114-Improper log message . . . 27
Figure 5.8 Developer activity (number of commits in the whole data set). . . 28
Figure 5.9 Developer experience (number of commits before fixing current fault). 28 Figure 5.10 Call distance (number of modules in the stack trace). . . 28
Figure 5.11 Code churn (size of fix). . . 29
Figure 5.12 Bug activation in number of days. . . 29
Figure 5.13 Performance measurements for 100 iterations. . . 29
Figure 5.14 Do you think Small faults are the most common faults in the OpenStack ecosystem ? . . . 35
Figure 5.15 Which API fault have you experienced most ? . . . 35
Figure 5.16 Why do faults propagate from OpenStack to third party software ? . 35 Figure B.1 Survey . . . 49
LIST OF ANNEXES
Annexe A CO-AUTHORSHIP . . . 46 Annexe B SURVEY . . . 47
CHAPTER 1 INTRODUCTION
An Application Programming Interface (API) is a set of public methods [1] that is meant to be used by other software applications. For example, cloud APIs are provided by a cloud platform to enable applications in the cloud to interact with, deploy or manage the platform [6]. In general, cloud applications are divided into three parts : Software as a Service, known as SaaS, (e.g., Gmail), Platform as a Service, known as PaaS (e.g, CloudFoundry) and In-frastructure as a Service, known as IaaS such as Amazon Web Services1 as a closed source and OpenStack as one of the popular open source in this context [47]. In PaaS, the sys-tem’s provider determines how the application infrastructure should operate [49]. PaaS uses container tools (e.g., Docker) to build and deploy applications [51] on the cloud platforms such as OpenStack. Containers are a method of virtualization that allows to run applications and their dependencies in resource-isolated processes. Tools such as Docker take advantages of IaaS APIs (Figure 1.1) to accomplish their tasks, e.g., the creation of containers and other deployment activities [50] [52].
In practice, cloud platforms experience outages [55] and it is unavoidable. Too often, develo-pers experience API call failures that threaten the reliability and availability of their cloud apps. Failures of cloud apps generally result in big economic losses as core business activities now rely on them [9]. For example, on December 24, 2012, a failure of Amazon web services caused an outage of Netflix cloud services for 19 hours. An outage of Google in 2013 brought down the Internet traffic by 40% [56], and Amazon Web Services outage brought down Quora, Reddit, FourSqure, part of the New York Times website, and almost 70 other sites [57] [59] in 2011. Hence, understanding factors affecting the reliability of cloud APIs is important to improve the availability of cloud services.
Lu et al. [7] who investigated API failures in Amazon EC2 services classified their causes in three categories : development, physical and interaction faults. There have also been studies that have attempted to detect faults (e.g., [9] [15] [16]) responsible for these API failures. However, to the best of our knowledge, the analysis and characterization of the causes (faults) of API failures have not been studied so far.
Figure 1.1 A sample of a third party program (e.g., Docker) calling OpenStack APIs [53].
API
(Git) Change Extraction
Bug Repo. Bug Related To API API Related Failures 230 Samples Random Sampling RQ2 RQ1 RQ3 Mailing List Characteristic Extraction Failure Extraction Explanatory Model RQ4
Figure 1.2 Overview of our approach for answering RQ1, RQ2, RQ3 and RQ4
1.1 Research Objectives
In this thesis, we quantitatively examined API failures in OpenStack. We consider as API failure any run-time problem related to the interface or implementation of an API, caused by API designers or implementers, eventually causing an outage of a service. Additionally, we qualitatively analyze the causes of API failures by mining the source code from which the failures originated, as well as their fixes. Moreover, we aim to find out why and which faults in OpenStack mostly are causing failures that impact third parties applications. By third parties, we mean containers (e.g., Dockers) that uses the OpenStack APIs. Specifically, we address the following research questions :
(RQ1) How often are APIs changed to fix API failures ?
Figure 1.3 Overview of our approach to answer RQ6, RQ7 and RQ8.
A quantitative study of the 25 most important modules in OpenStack shows that (a) A median of 23% of API changes are related to the API interface (b) A median of 7% of all API interface changes are due to the fixing of a failure and (c) Of all the API changes that do not alter the API interface, a median of 24% are due to the fixing of a failure. In total, we observed that one third of changes to the API are due to fixing failures.
(RQ2) What are the most common types of API failures and faults ?
Based on our analysis of 230 randomly selected fixes, we classify the causes of the API failures into seven categories including : small programming faults (56%), major programming faults (14%), configuration faults (14%), race conditions (5%), deadlock conditions (5%), improper log message faults (4%) and data format faults (3%). We also observed that db errors (16%), test errors (15%), network errors (10%), deployment errors (4%) and security errors (4%) are the most frequent symptoms of failures.
(RQ3) What are the bug fixing characteristics of the different fault types ?
The small programming faults are fixed by developers with less development activity in comparison to major programming faults. We also found that there is no significant difference in call distance between major programming faults and configuration faults. We observed that small programming faults do not take less time to fix in comparison to major programming faults. Furthermore, there is no difference in developer experience (who fixed) between small programming, configuration and major programming faults.
(RQ4) What are the main factors explaining the bug fixing process of small programming faults ?
We developed a composite model of a Naive Bayesian and Decision Tree classifier that takes into account features such as subject, message, stack trace and reply lag from issue report. We noticed that the subject, message and stack trace information, and the number of developers working on a fix for a failure as well as the reply lag are the most important characteristics of failures caused by small programming faults.
(RQ5) What type of faults are the most impactful ?
Small faults again dominate. We found that 60% of failures that affect third parties ap-plications are due to small programming faults. The other faults behind these failures that propagate to third parties applications are major faults (25%), configuration (12%), deadlock (1%), improper log message (1%), data format (1%) and race (0%).
(RQ6) Are code style checkers able to localize the faults behind the API failures ?
Code style checkers are powerful developers’ assistants which are able to recommend refacto-ring points and check for errors that are violating code conventions. Based on our observation they could not localize the faults behind the studied API failures. The faults that were fixed did not fall into the problematic blocks suggested by the code style checkers. The reason is that these faults are so tied to the logic of the program that developers implemented at the time, according to the business situations or requirements.
(RQ7) Why do faults propagate from OpenStack to third-party software ?
Our observations and a survey of 38 OpenStack and third party developers, team leaders and architects, suggest that (1) low testing coverage, (2) infrequent code reviews, and (3) a rapid release frequency, are the main reasons behind the propagation of API failures.
1.2 Thesis Plan
Chapter 2 presents background in the area of cloud computing, its tools and terminology. Chapter 3 outlines literature review in the areas of software reliability, focusing on APIs in cloud and non-cloud environments, failure characterization, mining software repositories and followed by our goal in this thesis. Chapter 4 includes the design methodology ; our two case study setups and the overall layout by which we perform empirical studies on the API failures and faults taxonomy, and the impact of API failures in OpenStack cloud environments. It also explains the machine learning models that we built for the study. In Chapter 5 we present our findings. Chapter 6 presents the limitations and threats to the validity of our work and finally in Chapter 7, we conclude our work and outline some avenues for future works.
CHAPTER 2 BACKGROUND
In this chapter, we discuss concepts essential to the comprehension of this thesis.
2.1 Cloud computing
“Cloud computing refers to both the applications delivered as services over the Internet and the hardware and systems software in the data centers that provide those services" [46]. Cloud computing has enabled industries to get their applications up and running faster. In fact, In cloud computing, IT and end-users can access cloud resources such as servers, networks and applications via the Internet, following the Pay-As-You-Go model in which users can pay only for the amount of computing services that they might need.
2.2 Public cloud
In public cloud, a service provider makes resources, such as applications and storage, available to the general public over the Internet. This type of cloud computing is often criticized in terms of data exposure and security concerns.
2.3 Private cloud
Private clouds are similar to public clouds, but a private cloud is dedicated to a single organization. Security issues are less likely to happen in comparison to public cloud. This solution is suitable for protecting sensitive and valuable data.
2.4 Hybrid Cloud
A combination of public and private cloud allowing work loads to move between private and public cloud. Important and sensitive data can be stored in a private cloud while less-critical computations can be in a public cloud. Hybrid cloud is a solution for dynamic or highly changeable work loads.
2.5 Hypervisor
A hypervisor which is known as virtual machine monitor (VMM) is a software, firmware or hardware that enables creating and running virtual machines.
2.6 IaaS
Infrastructure as a service (IaaS) is a form of cloud computing that provides virtualized computing resources over the Internet. The best known example is Amazon Elastic Compute Cloud (EC2), which provides a variety of instances that customers can lease to deploy their applications.
2.7 PaaS
Platform as a service (PaaS) is a category of cloud computing that offers a platform to customers, allowing them to develop and manage applications without the complexity of building and maintaining the infrastructure associated with launching the applications. The key benefit of PaaS is that users can focus only on the development and deployment of their applications. Microsoft Azure is the best known example of such services in cloud. Other examples of PaaS providers include Heroku, Google App Engine, and Red Hat’s OpenShift.
2.8 SaaS
Software as a Service (SaaS) offers all the functions of an application through a Web browser, not a locally-installed application. SaaS tends to eliminate tasks concerning servers, storage, application development and common concerns of IT. GMail by Google is the best known example of SaaS.
2.9 AWS
Amazon Web Services (AWS)1 is a comprehensive cloud computing platform and
infrastruc-ture provided by Amazon Inc.
2.10 OpenStack
OpenStack2 is an open source cloud infrastructure that controls large pools of compute, storage, and networking resources which all are managed through a dashboard giving ad-ministrators control while giving power to their users to provision resources through a web interface. In fact OpenStack lets you build an Infrastructure-as-a-Service (IaaS) cloud that runs on commodity hardware. The long-term goal of open stack is to produce a ubiquitous open source cloud computing platform that meets the needs of public and private cloud provi-ders regardless of their size. These days OpenStack is being widely used by many organization in their private clouds.
2.11 Containers
A container is a stand-alone, executable package of a piece of software that includes everything needed to run the application inside : code, runtime, system tools, system libraries, settings. In fact containers’ goal are application isolation and they do it by providing an abstract OS to the apps inside them. Containerized software will always run the same, regardless of the environment. Containers isolate software from its surroundings and help reduce conflicts between teams running different software on the same infrastructure. Containers use cloud infrastructure APIs to process their functions. An example of a container tools is Docker.
2.12 Containers vs Vms
Virtualization has a significant role in the cloud computing. It enables creating virtual re-sources, such as computer server, storage device, or an operating system. A virtual machine provides an abstract machine that uses device drivers targeting the abstract machine, while a container provides an abstract operating system. Applications running in a container envi-ronment share an underlying operating system, while VM systems can run different operating systems. If you want run multiple copies of a single app, maximum amount of particular ap-plications on a minimum of servers, say PostgreSQL, you use a container. If you need to run multiple applications on servers or have a wide variety of OS you’ll want to use VMs. And if security is number one for your company, then stay with VMs.
CHAPTER 3 LITERATURE REVIEW
In this chapter, we discuss related works and explain how these works are different from our work.
3.1 API Changes
Nowadays, frameworks are widely used in modern software development to reduce both deve-lopment costs and time. Software frameworks and libraries change their APIs as they evolve. Dig et al. [1] studied five well known open source systems (Eclipse, Log4J, Struts, Mortgage and JHotDraw) in order to understand how APIs change. Their goal was to allay the burden of reuse on maintenance efforts. For each component under the study they chose two major releases that held large architectural changes. The advantages of choosing major releases as comparison points are : (1) the large number of changes between two major releases, and (2) the documentation of these changes, which allow for a detailed analysis of the API changes. Dig et al. [1] report that changes that break existing applications are not random and 80% of these changes are due to refactorings.
Wu et al. [43] studied the Apache and Eclipse open source projects to understand API changes and usages. They developed a tool named ACUA to analyse and classify the API changes and usages in 22 framework releases from the Apache and Eclipse ecosystems as well as their client programs. Their data set included 11 framework releases, which represent 20,399 classes, 171 internal client programs including 95,273 classes, and 42 third-party client programs, composed of 26,227 classes. They found that (1) Missing interfaces are rare and new releases of frameworks often experience missing classes and methods and this affects client programs more often than other API changes. (2) On average, 35% of client’s classes and interfaces use the APIs of a framework. (3) Refactorings help reduce the API usages in the client programs. (4) Client programs can encapsulate 14% and 8% of APIs in Apache and Eclipse frameworks. This encapsulation helps reduce the API usages. (5) Apache internal programs showed that API changes and encapsulable API-injection usages are correlated.
3.2 Failure Characterization
Gray [2] examined the root cause of a sample of failures reported at Tandem Computers Inc., over a period of seven month. The sample set included more than 2,000 systems and represents over 10,000,000 system hours or over 1,300 system years. His analysis shows that
administration and software are the major causes of system failures. He also pointed out that a software product often undergoes soft faults and a transaction mechanism combined with persistent process-pairs can provide a fault-tolerant state in executions, which can reduce the faults of a software.
Oppenheimer et al. [3] performed a qualitative study on a mature internet portal (Online), a global content hosting service (Content), and a mature read-mostly service (ReadMostly). In their analysis they found that improvement in the tools related to maintenance activities would decrease time to diagnose and repair problems. All of these services were geographi-cally distributed and use commodity hardware and networks. They extracted more than 500 component failures and analyzed the causes of the failures along with effectiveness of various techniques for preventing and mitigating these failures. They found that (1) in two of the three studied services, the operator error is the largest cause of failures (2) operator error is the largest contributor to the time to repair in two of the three services, (3) configura-tion errors are the largest category of operator errors, (4) failures in front-end software are significant, and (5) more extensive online testing could reduce failure rates in at least one service.
Li et al. [4] studied bugs in Microsoft Bing’s data analytic jobs, which were written in SCOPE [5]. They investigated not only major failure types, failure sources, and fixes, but also de-bugging practices. They found that (1) 84.5% of the failures are caused by defects in data processing rather than defects in code logic. (2) Table-level failures (22.5%) are caused by developers’ mistakes and frequent data-schema changes while row-level failures (62%) are mainly caused by exceptional data. (3) 93% of bug fixes do not change data processing logic, and (4) 8% of failures have their root causes far from the failure-exposing stage, making their debugging hard.
3.3 API Failures in the Cloud
The closest work to our work that categorizes failures in a cloud environment is the work of Lu et al. [7]. They studied nearly 900 issues related to API failures from Amazon EC2 forums. They classified the causes of failures into three categories : development, physical and interaction. They found that (1) 60% of failures are due to “stuck" API calls or unresponsive calls. (2) 12% of cases of failures are due to slow responsive API calls which included un-successful calls with unclear error messages, missing output, wrong output, and unexpected output. (4) 9% of failures were pending for a period of time and when they were called again they were successful.
Lu et al. also conducted another study about the performance of APIs in the cloud. They first observed API issues during the development of their commercial disaster recovery software, i.e., Yuruware Bolt, which heavily relied on APIs to perform disaster recovery operations. They extracted 2,087 cases of API failures from a wide range of sources (a broader investiga-tion than their previous empirical study [7] which only covered 922 cases). A large percentage of the cases were inevitable latency or timing failures, i.e., stuck API calls and slow responses which can not be reduced in a large system. They gathered failure reports from several pu-blic sources including the Amazon EC2 discussion forum as well as technical analysis of API issues during outages from reputable sources such as Amazon outage reports, Netflix tech-nical blogs, and Availability Digest. In total, they classified the 2,087 API failures into two sub-types : content failures (55% of API issues) and timing failures (45% of API issues). Distributed data-intensive systems are the building blocks of many internet software services. Distributed systems are widely used and are considered production quality. These systems can fail and do so sometimes catastrophically, where users might experience an outage or data loss. Ding et al. [55] studied 198 randomly real world failures in five widely used, data-intensive distributed systems ; Cassandra and HBase (two NoSQL distributed databases), Hadoop Distributed File System (HDFS), Hadoop MapReduce (a distributed data analytic framework), and Redis (an inmemory key-value store supporting master/slave replication). Their goal was to better understand how errors evolve into application failures and eventually some of them evolve into service-wide catastrophic failures.
They found that the error logs of these systems contain enough data on both the errors and the input events enabling the diagnostic process and the reproduction of the failures. From a testing point of view, the failures required only 3 nodes or fewer to be reproduced which is a good news since these services normally need a large number of nodes to run. They concluded that the majority of catastrophic failures could easily have been prevented by performing simple testing even without an understanding of the software design.
Gunawi et al. [17] performed a quantitative and qualitative analysis of cloud issues. They conducted rather a large comprehensive study of the deployment and development issues of the most important cloud systems ; Hadoop, MapReduce, HDFS, HBase, Cassandra, Zoo-Keeper and Flume. They reviewed 21,399 issues from bug repositories (1/1/2011-1/1/2014) and they performed a deep analysis of 3655 “vital" issues, i.e., the issues that affected de-ployments activities. For each vital issue, they analyzed the patches and all the developer’s answers, and classify them in eight categories : security, reliability, availability, performance, scalability, data consistency, topology and QoS. They also considered hardware failures such as disks, memory, network and processors. Examples of the reason for hardware failures are
mentioned as stop, corrupt or limp. In their findings, they could categorize the issues by a variety of bug types such as optimization, configuration, error handling, data race, hang, space, load and logic bugs. Gunawi et al. [17] also studied the bug issues by implication such as performance, failed operations, performance problems, data loss, component downtime, staleness, and corruption. Additionally, they measured the impact of bugs as single machine, multiple machine or the whole cluster.
3.4 Mining Software Repositories (MSR)
Mining Software Repository (MSR) has been widely used over the past decade in software engineering. Researchers have proposed techniques that augment traditional software engi-neering data and tools, to solve important and challenging problems, such as bug detection, code reuse, and–or process improvements Hassan [12].
For example, Tian et al. [13] have proposed a classification model that takes advantage of both textual and source code features to identify defect fixes out of all submitted commits, instead of manual inspection which might missed many data. Ibrahim et al. [26] used a composite data mining approach to determine the main factors that drive developers to contribute to a particular discussion thread based on a corpus of historical thread discussions.
In this thesis, we leverage similar MSR techniques to analyze artifacts from OpenStack repo-sitories, in order to better understand the reasons behind API failures and the propagation of these failures in the OpenStack ecosystem.
3.5 Our Goal and Motivation
Our overall goal in this work is to understand the failures and sources of faults in the OpenS-tack cloud platform, that have been propagated and impacted third parties, using mining software repository techniques. To achieve this goal, we perform an empirical study of OpenS-tack bug reports including those issues related to failures by considering the sOpenS-tack traces and third parties components within bug repositories’ contents. We also survey OpenStack and third party developers, to obtain their opinion about the causes of API failures that propagate to third party applications.
There are several factors that motivated us to pursue this goal. First, understanding the type of API failures and faults could help make OpenStack practitioners aware of development pitfalls to be avoided, and the results could give them insights for better debugging techniques. Second, by performing a survey and analysing the participants’ feedbacks on the impact of
these faults, more specifically, the reasons behind the propagation of API faults could draw the attention of developers, team leaders, architects and testers towards these faults, hence potentially helping to identify them early.
CHAPTER 4 METHODOLOGY AND DESIGN
In this chapter, we describe our two case studies : (1) for RQ1 to RQ4 and (2) for RQ5 to RQ7.
4.1 Case Study Setup 1
In this section, we describe the studied systems, and present our data extraction and analysis approach. Figure 1 shows our approach to answer the research questions.
4.1.1 Studied Systems
OpenStack is an open source cloud infrastructure project launched by Rackspace Hosting and NASA in 2010. It is governed by a consortium of organizations who have developed multiple components that together build a cloud computing platform. OpenStack is an “Infrastructure as a Service" platform. This means that users can deploy their own OS or applications on top of OpenStack to virtualize resources like storage, networking and computing.
OpenStack hosts its bug repository on launchpad1. When a bug is reported related to an
API failure, a user would normally put the stack trace of the exception into the bug report message. Then, the bug would be triaged by a developer in order to evaluate whether it is valid or not and a priority to that bug would be assigned as well. At the end, when a patch or a fix has been reviewed, a link to the corresponding git commit is added to the corresponding bug report. We selected OpenStack as the case study system based on the following criteria : Criterion 1 : Accessibility
Since OpenStack is an open source project, its source code, bugs and stack traces are available online2. OpenStack is the most popular open source cloud platform, rivaling commercial
competitors like Amazon and Microsoft in popularity and feature set. Criterion 2 : Traceability
The bug repository is linked with the review system through a hyperlink to review environ-ment (Gerrit), and it is also possible to link to the resulting bug fix in the version control system (git). Since we want to do a qualitative study on the files in which an API failure has been fixed in order to understand the causes of the analyzed failures, this well-established linkage is a must for our research.
1. https ://bugs.launchpad.org 2. https ://github.com/openstack
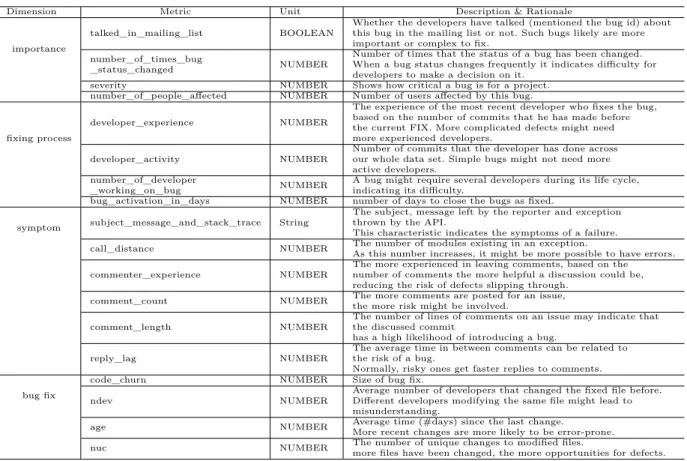
Table 4.1 Characteristics studied
Dimension Metric Unit Description & Rationale
importance
talked_in_mailing_list BOOLEAN
Whether the developers have talked (mentioned the bug id) about this bug in the mailing list or not. Such bugs likely are more important or complex to fix.
number_of_times_bug
_status_changed NUMBER
Number of times that the status of a bug has been changed. When a bug status changes frequently it indicates difficulty for developers to make a decision on it.
severity NUMBER Shows how critical a bug is for a project.
number_of_people_affected NUMBER Number of users affected by this bug.
fixing process
developer_experience NUMBER
The experience of the most recent developer who fixes the bug, based on the number of commits that he has made before the current FIX. More complicated defects might need more experienced developers.
developer_activity NUMBER
Number of commits that the developer has done across our whole data set. Simple bugs might not need more active developers.
number_of_developer
_working_on_bug NUMBER
A bug might require several developers during its life cycle, indicating its difficulty.
bug_activation_in_days NUMBER number of days to close the bugs as fixed.
symptom subject_message_and_stack_trace String
The subject, message left by the reporter and exception thrown by the API.
This characteristic indicates the symptoms of a failure.
call_distance NUMBER The number of modules existing in an exception.
As this number increases, it might be more possible to have errors.
commenter_experience NUMBER
The more experienced in leaving comments, based on the number of comments the more helpful a discussion could be, reducing the risk of defects slipping through.
comment_count NUMBER The more comments are posted for an issue,
the more risk might be involved.
comment_length NUMBER
The number of lines of comments on an issue may indicate that the discussed commit
has a high likelihood of introducing a bug.
reply_lag NUMBER
The average time in between comments can be related to the risk of a bug.
Normally, risky ones get faster replies to comments.
bug fix
code_churn NUMBER Size of bug fix.
ndev NUMBER
Average number of developers that changed the fixed file before. Different developers modifying the same file might lead to misunderstanding.
age NUMBER Average time (#days) since the last change.
More recent changes are more likely to be error-prone.
nuc NUMBER The number of unique changes to modified files.
more files have been changed, the more opportunities for defects.
In order to select the most important APIs for our study, we queried Amazon for the most popular books related to OpenStack, resulting in 143 records. We reviewed the top 3 books [21] [22] [23] and concluded that Nova, Swift, Heat, Neutron and Keystone are the five most significant APIs. Books have been considered before in empirical studies on SE [18], especially in cases where popularity, experience or terminology of practitioners are required.
4.1.2 Data Extraction
In order to access the bug and source code change data of OpenStack, we mined the official launchpad as well as the data set provided by Gonzalez-Barahona et al. [19]. In launch-pad, we manually investigate the cause of the failures (faults), while we use the data set of Gonzalez-Barahona et al. [19] to perform our quantitative study such as exploring the faults’ characteristics. This data set has 221,671 commits from 2010-05 to 2015-02 in the scmlog table. Its most important columns are revision (the hash id of the commit), committer_id (the id of the person that made the commit), date and the message (the text that the deve-loper writes at the time of commit). It also has 55044 bug reports starting from 2010-07 to 2015-02. The most important columns of this table are issue (the bug number), type (the
de-cision status), summary (subject of the bug), description, status (whether it is Fixed Release, Invalid or etc.), priority (High, Low or etc.) and submitted_on (the date that is reported). Finally, there are 88842 emails starting from 2010-11 to 2015-02. It has two most important columns : subject and message_body. Since recent data has a lower chance of being fixed than older data, we limited the data to 2015-02, in order to assure that we have more stable resolved issues.
Change Extraction. For RQ1, we focus on the 5 most important API git repositories ; Nova, Swift, Heat, Neutron and Keystone. For each API, we fetched the 5 most important modules. The programming language in OpenStack is Python and a module is a file (.py) containing Python definitions and statements. We compared the differences between each pair of consecutive commits of these modules to understand whether any changes related to method signature occur or not, such as removing or adding parameter or even a deleting method. If yes, we then checked whether the change happened for fixing a bug.
To know whether a commit is fixing a bug, we looked for “bug", “fix",“defect" and “patch" keywords inside the commit messages. A similar approach to determine defect-fixing changes has been used in other work [29] [30].
Failure Extraction. For this aim, we first use the data set of Gonzalez-Barahona et al. [19] to fetch all fixed bugs for the year 2014. To further understand the causes of these failures (“faults"), we then consider the subject, message and stack traces of the thrown exceptions because they contain symptoms (side effects) of the failure and help understand better the causes. We manually studied some bugs related to APIs and we understood that 90% of bug reports related to API failures contain api and traceback keywords inside. Hence, we performed a query to search for those bugs containing “api" and “traceback" within the body of the bug messages. This resulted in 923 reports related to 135 projects.
Because investigating all of these reports is a time consuming task, we performed a statisti-cal sampling with a 95% confidence level and a confidence interval of 5.5% to see how many samples we need to study [24]. As such, we randomly selected 230 samples out of the 923 reports. Through these samples, we distinguished between bugs related to failures in OpenS-tack APIs or client application programming failures. We were conservative and we studied the developers’ and commenters’ messages to ensure that a bug is relevant to an OpenStack API failure. We removed any unrelated bug from the list and randomly replaced it by another bug. In launchpad, given the traceability between bug repository, review system and version control system, we tracked each sampled bug’s review and fixes to analyze the differences between the version before and after fix.
we select them to be used in RQ3 and RQ4 to build an explanatory model of small program-ming faults, which are the most common kind of faults found in our analysis results. The table shows 4 different dimensions of information available during the resolution of a cloud API bug. We used bug, e-mail and source code repositories to extract the characteristics. Amongst these metrics, the code churn, the number of developers working on a bug, ndev, age, nuc and whether a bug is discussed in the mailing list are not in the bug reports, but are extracted from source code and mail repository. The Call_distance represents the number of modules (files) called between the calling module until and API module raising a failure. Our definition for experience is the number of commits that the developer has done before in the control version system (git) before fixing the current bug [20], while developer activity is the total number of commits the developer has done across our whole data set.
4.1.3 Explanatory Model
In this section, we describe our approach for constructing our explanatory model in RQ4 from the sample of 230 bugs.
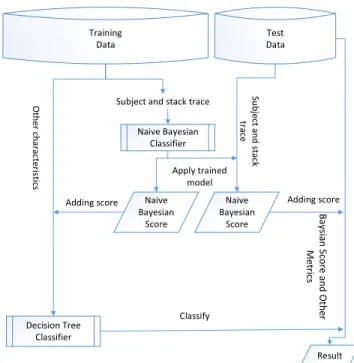
Composite Data Mining Approach. While RQ2 analyzes and classifies failures, RQ3 builds an explanatory model to understand the important characteristics of the bug fixing process of API failures caused by small programming faults as opposed to other faults. Since a Decision Tree classifier does not have good support for the “String" data type and we want to include textual subject, message and stack trace content into our model, we use a Naive Bayesian classifier to deal with these fields of a bug report.
As shown in Figure 2, we use a composite model, similar to Ibrahim et al. [26], which involves two data mining approaches. First, we apply a Naive Bayesian classifier (as used by spam filters) [39] on the bug subject, message and stack trace content to determine how much this information is relevant to small programming faults. Second, we add the calculated Bayesian score (probability) to the other characteristics of Table 1 as the input to a Decision Tree classifier.
The Naive Bayesian classifier. Similar to a spam filter, this classifier takes the subject, message and stack trace from the training corpus. In fact, the Naive Bayesian classifier divides the content into tokens and counts the occurrences of each token. These counts are used to determine the probability of each token to be an indicator of the fault type. Finally, it gives a score indicating whether a whole string is relevant to small programming faults. The closer the score is to 1, the higher the probability that the content will be relevant.
Training Data Test Data Naive Bayesian Classifier Subject and stack trace
Naive Bayesian Score O ther cha ra cteris tics Decision Tree Classifier
Adding score Naive Bayesian Score Su bject and stack tra ce Result Adding score Ba ysian S core and Ot her M etrics Classify Apply trained model
Figure 4.1 Overview of our approach for answering RQ4
and stack trace score from the Naive Bayesian classifier algorithm as input instead of the original string data, together with the other characteristics discussed before. We use a Deci-sion Tree classifier as a machine learning algorithm, since this classifier offers an explainable model explicitly showing the main factors that affect a fault type, while many of the other ma-chine learning techniques produce black box models that do not describe their classification decisions. We have used the C4.5 algorithm [28] to create our Decision Tree.
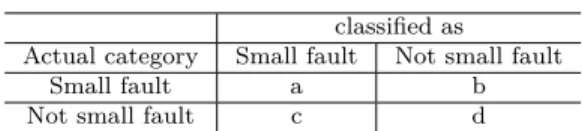
Evaluation of the Model. To validate our model, similar to the strategy used by Macho et al. [41], we use an 80-20 split. To this aim, we divide the studied bugs into two parts : the training containing 80% of the data (randomly selected) and the testing corpus-containing the remaining 20%. The training corpus is used to build the classification model, while the testing corpus is used to test the accuracy of the model. This process is repeated 100 times to get more robust measurements. To this aim, we build a confusion matrix at each iteration to measure the performance of our model. The confusion matrix looks like Table 4.2.
Based on the confusion matrix, we evaluate our explanatory model using the metrics below : — Precision (P) : Proportion of failures correctly classified as small programming faults
(a) over all failures classified as small programming faults (a+c), i.e., p = a+ca
Table 4.2 Confusion Matrix
classified as Actual category Small fault Not small fault
Small fault a b
Not small fault c d
(a) over all failures that are caused by small programming faults (a+b), i.e., R = a+ba — F-Measure : The harmonic mean of precision and recall, i.e., F = 2.precision−recallprecision+recall — Area Under Curve (AUC) : The range of AUC is [0,1], with a large value indicating
better model performance than random guessing and a value of 0.5 indicates that the classifier is no better than random guessing.
4.2 Case Study Setup 2
Figure 1.3 shows our overall approach for studying the faults that impact the third parties.
4.2.1 Fault Type Identification
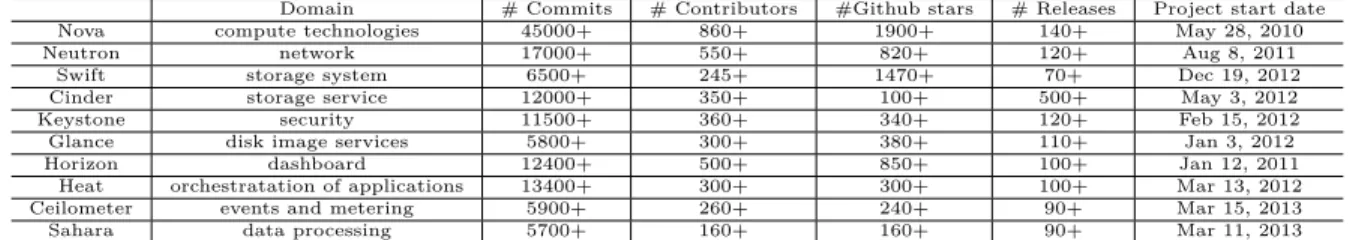
For RQ1, we looked at OpenStack [52] official website and we found out that Docker, Kubernetes, and Apache Mesos are the recommended containers. Then we went through their bug repositories to check if we can find out any bugs that originates from one of OpenStack APIs. We searched several terms and keywords to see if we are able to find out any clues. Unfortunately it was not possible. We encountered several failures that were reported to be related to underlying layers within OpenStack APIs, but we could not track them to Openstack, because there were no links that could lead us to see the origins of those failures and their causes. We did the same for other containers bug repositories and we got a similar result. Therefore, we made the decision to check inside OpenStack bug repository3 since we were able to study the faults directly inside the source code. We first manually searched several key words including container names and API failure. The best key words that we found to track affected third parties is including the name of the container beside the name of the API with the term “trace" (e.g, “Docker heat api trace"), we included quote to reduce false positives. Similar approaches are used in Tourani et al. [60]. We repeated these steps for the 10 most important OpenStack APIs. Our reference for the most important OpenStack APIs is according to their official website [54] which includes : Nova, Neutron, Swift, Cinder, Keystone, Glance, Horizon, Heat, Ceilometer, and Sahara. Table 4.3 shows some descriptive statistics of these APIs.
Table 4.3 Descriptive statistics of the APIs.
Domain # Commits # Contributors #Github stars # Releases Project start date
Nova compute technologies 45000+ 860+ 1900+ 140+ May 28, 2010
Neutron network 17000+ 550+ 820+ 120+ Aug 8, 2011
Swift storage system 6500+ 245+ 1470+ 70+ Dec 19, 2012
Cinder storage service 12000+ 350+ 100+ 500+ May 3, 2012
Keystone security 11500+ 360+ 340+ 120+ Feb 15, 2012
Glance disk image services 5800+ 300+ 380+ 110+ Jan 3, 2012
Horizon dashboard 12400+ 500+ 850+ 100+ Jan 12, 2011
Heat orchestratation of applications 13400+ 300+ 300+ 100+ Mar 13, 2012
Ceilometer events and metering 5900+ 260+ 240+ 90+ Mar 15, 2013
Sahara data processing 5700+ 160+ 160+ 90+ Mar 11, 2013
Finally, we removed all duplicated bug reports as well as those bugs that had no links to the review system or git repository.
In addition to fault type identification, we paid special attention to the test cases as well. We tried to investigate if along with fixes developers performed any actions on related test cases, i.e, any test cases were added and/or modified. If there were no files in the commit relevant to the tests found, we searched for the possible corresponding test cases of the classes and methods in the related project by going to its CVS(git) repository. If no test cases were found, we marked it as “no test case".
4.2.2 Apply Code Style Checkers
Code style checkers are tools that check for errors in codes, tries to enforce a coding standard and looks for code smells. Since the bug repository of OpenStack is linked to its code review system, i.e, commenters leave links inside issues’ threads in bug repository which directs readers to the code review page. From the code review page, we can track committed fixes (faults) inside the VCS (git) of OpenStack and locate the faulty versions.
Inside the faulty source codes, we noticed that there are four different programming lan-guages ; Python, Ruby, Unix Shell and Infrastructure-as-code. For Python source codes we used pylint4 to find out the smelly code blocks and codes not regulating the python standards
styles, for Ruby we used reek5, for Shell scripts we used ShellChecker6 and for
Infrastructure-as-code we used Puppeteer7 [61] code style checkers respectively.
4.2.3 Survey
For RQ3, we conducted a survey in order to obtain feedbacks from practitioners on our findings, and more importantly to obtain their opinion about the reasons behind the
propa-4. http ://www.pylint.com
5. https ://github.com/troessner/reek 6. http ://www.shellcheck.net
gation of API failures. We designed a questionnaire8 to survey both OpenStack and third parties’ developers, architects and team leaders. The questionnaire has both closed-ended (where participants had to choose an answer from a set of given options) and open-ended (asking participants to write their own responses) questions. We grouped the questions the-matically and ordered them from the more generic to the more specific. Participants were able to skip any questions and could end the survey at any time. We sent out the questionnaire to both OpenStack and third parties’ application developers by using their official Website and mailing list9. The survey took place between the 15th of February and March 15th, 2017.
8. https ://goo.gl/forms/eeLTAQeGfjwgJj342 9. openstack@lists.openstack.org
CHAPTER 5 CASE STUDY RESULTS
In this section, we report and discuss the results for each research question.
5.1 (RQ1) How often are APIs changed to fix API failures ?
Motivation. Due to different activities such as re-engineering, refactoring [1] and bug fixing, libraries and frameworks often need to change. In the simplest case, only the implementation of API methods needs to be fixed. Such changes are safe for API clients. However, changes to an API’s signature would be problematic for the applications that are consuming them. For example, consider a case in which a client application is calling a public method from an API to accomplish a transaction on a user’s account. If this method in the API changes, a failure would be raised by the API noting that this method does not exist within that API, which leads the end-user of that service to suffer from the malfunctioning. In the worst case, the end-user might even make a decision to change his service provider.
Hence, this question aims to understand the rate of API change for fixing failures in a popular cloud platform like OpenStack. In this RQ, we investigate changes of both API method signature and implementation.
Approach. We developed a Groovy1 script and used the JGit2 library to calculate the
following metrics for the 25 most important modules of the 5 most popular OpenStack APIs : Total Number Commits, Number of Method Signature Changes and Number of Method Signature Changes For Bug Fixing. We then distinguished between changes affecting the API signature and others.
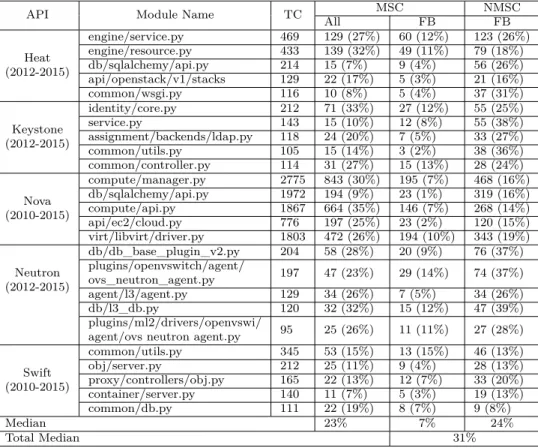
Findings. In total, 31% (one third) of all commits fixes API failures. We found that a median value of 23% of the sampled API changes is devoted to signature changes. Table 3 shows how this percentage fluctuates from 2% (keystone/common/utils.py) to 15% (swift/common/utils.py). A median value of 7% of all commits changes the method signature during the resolution of an API failure. On the other hand, the remaining 77% commits not changing method signature have a median value of 24% for fixing failures as well.
Our finding that 7% of API commits changes an API’s signature to fix a failure confirms the result of Wu et al. [43], who analyzed and classified API changes and usages from 22
1. http ://www.groovy-lang.org/ 2. http ://www.eclipse.org/jgit/
framework releases in Apache and Eclipse ecosystems. Wu et al. [43] found a median value of 11% for the changes of API method signature. They considered such changes as rare. Our finding that one third of API changes are related to (the fixing of) API failures prompts us to the next research question.
5.2 (RQ2) What are the most common types of API failures and faults ?
Motivation. This RQ analyzes what API failures are the most common, as well as what are the most popular causes (“faults") of these failures. This information is useful for developers and clients alike, to better understand the failures that they are experiencing as well as to have an indication of the possible faults responsible for the failures.
Approach. We conduct a qualitative study to manually evaluate the bug reports as well as bug fixes of API failures during the year 2014 in OpenStack projects. We adopted a “Card Sor-ting" technique to classify the symptoms and causes of the failures in 230 randomly selected reports (see section 2.2). The “Card Sorting" technique [32] is an approach that systemati-cally derives structured information from qualitative data. This technique is commonly used in empirical software engineering when qualitative analysis and taxonomies are needed. For example, Bacchelli et al. [34] used this technique to analyze code review comments, while Hemmati et al. [35] used it to study survey discussions [37]. We used Google Keep3 as a tool for this purpose, since it allows to search through cards and can export them into a text file. To that end, we first read each bug report’s stack trace to analyze the reported symptoms, i.e., the exception or main error (e.g., “DbError Exception"). Second, we analyzed the cor-responding bug fix changes. For example, when a developer added try-catch, he added this kind of changes as a new card “adding try-catch". We also added the symptom of each bug in the same card as we classified its fault (cause). After analyzing all sampled defect reports, we started clustering the cards into related topics. We did one clustering for the symptoms, and one for the faults.
As initial inspiration for the fault clusters, we used the IEEE standard classification for software anomalies4 and Orthogonal Defect Classification (ODC)5. However, we soon realized
that these classifications are too coarse-grained. For instance, we found a race condition as a main cause of a failure, which is a much more detailed category than the IEEE Standard’s “logic fault" and “Timing/Serialization" category in ODC. Hence, we started to classify the faults in as much detail as possible.
3. http ://keep.google.com
4. http ://standards.ieee.org/findstds/standard/1044-2009.html
Table 5.1 Analysis of the 25 most important modules in OpenStack. TC :Total Commits, MSC : Method Signature Changes, NMSC : Non Method Signature Changes, FB : Fixing Bugs. All percentages are relative to TC.
API Module Name TC MSC NMSC
All FB FB Heat (2012-2015) engine/service.py 469 129 (27%) 60 (12%) 123 (26%) engine/resource.py 433 139 (32%) 49 (11%) 79 (18%) db/sqlalchemy/api.py 214 15 (7%) 9 (4%) 56 (26%) api/openstack/v1/stacks 129 22 (17%) 5 (3%) 21 (16%) common/wsgi.py 116 10 (8%) 5 (4%) 37 (31%) Keystone (2012-2015) identity/core.py 212 71 (33%) 27 (12%) 55 (25%) service.py 143 15 (10%) 12 (8%) 55 (38%) assignment/backends/ldap.py 118 24 (20%) 7 (5%) 33 (27%) common/utils.py 105 15 (14%) 3 (2%) 38 (36%) common/controller.py 114 31 (27%) 15 (13%) 28 (24%) Nova (2010-2015) compute/manager.py 2775 843 (30%) 195 (7%) 468 (16%) db/sqlalchemy/api.py 1972 194 (9%) 23 (1%) 319 (16%) compute/api.py 1867 664 (35%) 146 (7%) 268 (14%) api/ec2/cloud.py 776 197 (25%) 23 (2%) 120 (15%) virt/libvirt/driver.py 1803 472 (26%) 194 (10%) 343 (19%) Neutron (2012-2015) db/db_base_plugin_v2.py 204 58 (28%) 20 (9%) 76 (37%) plugins/openvswitch/agent/ ovs_neutron_agent.py 197 47 (23%) 29 (14%) 74 (37%) agent/l3/agent.py 129 34 (26%) 7 (5%) 34 (26%) db/l3_db.py 120 32 (32%) 15 (12%) 47 (39%) plugins/ml2/drivers/openvswi/
agent/ovs neutron agent.py 95 25 (26%) 11 (11%) 27 (28%)
Swift (2010-2015) common/utils.py 345 53 (15%) 13 (15%) 46 (13%) obj/server.py 212 25 (11%) 9 (4%) 28 (13%) proxy/controllers/obj.py 165 22 (13%) 12 (7%) 33 (20%) container/server.py 140 11 (7%) 5 (3%) 19 (13%) common/db.py 111 22 (19%) 8 (7%) 9 (8%) Median 23% 7% 24% Total Median 31%
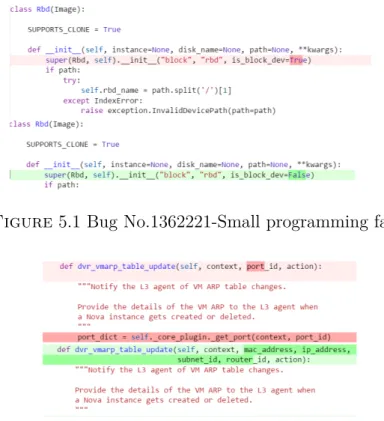
Findings. We obtained almost 30 categories of API faults, which we could group into 7 higher level categories. However, we noticed that in many cases, a bug fix only touches a couple of lines in one file, making simple logic changes like inverting logical condi-tions, fixing typos in variable names or adding a new catch exception. Since such changes only touched one file, and the changes were minor, we created one category for this and called it “small programming faults". To clarify more, Figure 5.1 shows a sample of this fault type, where the developer changes the default value of a variable to another value.
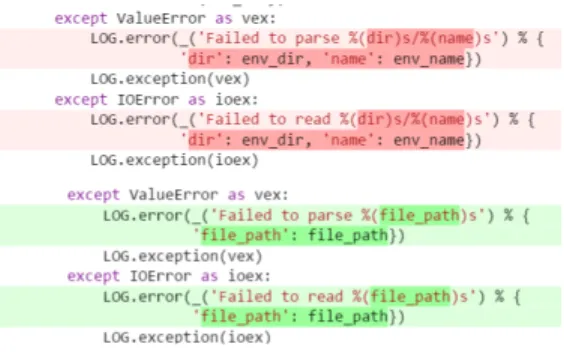
Contrary to small programming faults, we observed that many fixes involved several files and/or multiple parts of files are touched by the developers. We created a category for this and we called it “major programming faults". We include method signature changes (interface faults) into this group as well. Figure 5.2 shows a sample of this kind of faults where a developer changes the method signature by adding more parameters. While enumerating the samples for major programming faults, we separately counted the statistics for method signature changes to see whether there exists any aligned statistics with our previous result for RQ1 on the five most important APIs.
“Configuration faults" is another category of causes of API failures, where a wrong value is set in a configuration file. Figure 5.3 shows a bug that is fixed by the correction of a value in a configuration file.
As mentioned earlier, we faced “race condition faults" where a variable is accessed concur-rently by multiple threads. Also, similar to this fault, we faced “deadlock condition faults" where a process or thread locks an object and other process or thread is not able to access this object. Since these kinds of faults are difficult to identify, we were conservative and we read the commit messages to make sure what the cause of the failure is exactly about. Figure 5.4 and 5.5 show these categories.
“Data format faults" cover situations in which an incorrect data type was given to a method or the data was not in a correct format. Figure 5.6 shows how a developer fixes defects related to a data encoding issue.
“Improper log message" corresponds to cases where a wrong message or inappropriate log is sent to the users. This makes problem diagnostics and resolution difficult for users. Figure 5.7 shows that the developer tries to give a more appropriate message by modifying data in the output text string. Table 5.2 summarizes the different categories obtained.
As Table 5.2 shows, there are 7 major categories of fault type in our findings : Small programming faults, configuration faults, major programming faults, race condition, deadlock condition, improper log message and data format fault. Small programming faults are the most common type of API faults, followed by major programming and configuration faults.
In Table 4, we can see the proportion of each category. It is clear that almost half of the causes are related to small programming faults. In other words, the majority of API fai-lures were caused by a trivial programming mistake. The next most common type of fault are major programming faults, which are 4 times less common, but are caused by more se-rious programming issues. Configuration faults typically are easier to fix, depending on the understanding of the cloud configuration.
Surprisingly, the number of method signature changes in our sample data (part of major programming faults) is about 6%, which is aligned with the median number of method signature changes found in RQ1 for the 25 important modules, i.e., 7%.
The most common API failures are database and test failures. Table 5.3 shows the different types of failures and their percentages.
Figure 5.1 Bug No.1362221-Small programming fault.
Figure 5.2 Bug No.1362985-Major programming fault.
Figure 5.3 Bug No.1354500-Configuration fault.
5.3 (RQ3) What are the bug fixing characteristics of the different fault types ?
Motivation. Understanding how different API fault types are being fixed could help software organisations improve their fault triaging process (e.g., faults can be assigned to developers more adequately), their code review process (faults that require complex changes to the code could be scrutinized more deeply), and the allocation of their maintenance resources. In this RQ, we analyze possible differences in characteristics of different fault types.
Approach. Using the tool that we developed to answer RQ1, we find the commits that fix the failures studied in RQ2. The characteristics that we investigate are described in Table 1 and are obtained from bug reports, bug fix commits and developer emails. Overall, we
Figure 5.4 Bug No.1339235-Race condition.
Table 5.2 Prevalence of API fault types
Fault Type Percentage Small programming fault 56% Configuration fault 14% Major programming fault 14%
Race condition 5%
Deadlock condition 4%
Improper log message 4%
Data format fault 3%
are interested in all characteristics related to the resolution of faults, i.e., symptoms, the importance of the failure, the fixing process and the eventual fix. Because small programming, major programming and configuration faults have more occurrences than the other faults, we focus only on the differences of these three fault types.
Findings. There is a significant difference in the activity of developers fixing small and major programming faults. Results show that small programming faults require less active developers than major programming faults. The Mann-Whitney u test [36] yielded a statistically significant difference. Hence, we reject the null-hypothesis (i.e., “There is no significant difference in the activity of developers fixing small and major programming faults"), accepting the alternative hypothesis that there is a significant difference between both distributions.
A related null hypothesis is about the amount of experience of developers (Table 5.1 for the de-finition of exprience) attempting to fix API failures. In particular, we believed that developers with low experience fix small programming faults. Therefore, we created a null-hypothesis “There is no significant differences between developer experience in small programming and major programming faults". A Mann-Whitney U test with the p-value = 0.22 was not able to reject. This implies that we found no proof of significant difference in terms of experience of developers who fix small faults and developers who fix major faults. Figure 10 and Figure 11 show the boxplot of experience and developer activity metrics. As Figure 12 shows, we understand that there would be a significant difference in the call distance between configuration and major programming faults. However, a Mann-Whitney U test with alpha value of 0.01 between major and configuration faults is not able to reject the null-hypothesis (p-value=0.05), hence, there exists no significant differences in terms
Figure 5.5 Bug No.1370191-Deadlock condition
Figure 5.6 Bug No.1333177-Data format fault
Figure 5.7 Bug No.1272114-Improper log message
of call distance. This indicates that major programming faults have no longer call distance in comparison to configuration faults. The Mann-Whitney U statistical test did not show any significant difference between small programming faults and configuration faults either. This implies that any fault type can occur in an API with any number of modules inside and there is no correlation between this number and the occurrence of a specific fault type. As Figure 13 shows, the code churn of major programming faults is significantly higher than the other two categories. This is expected, since in our fault type classifi-cations, we considered bug fixes involving larger code changes as well as method signature changes as major faults.
Surprisingly, small programming faults do not take significantly less time to be fixed than major programming faults. According to Figure 14, we see no significant differences between different kinds of faults, specifically the small and major programming faults. One conjecture might be that, despite the small sizes of bug fixes, small programming faults can still be difficult to detect and diagnose.
small config major 0 10 0 20 0 30 0 40 0 50 0
Figure 5.8 Developer activity (number of commits in the whole data set).
small config major
0 50 0 10 00 15 00
Figure 5.9 Developer experience (number of commits before fixing current fault).
small config major
0
10
20
30
40
Figure 5.10 Call distance (number of modules in the stack trace).
small config major 0 20 0 40 0 60 0 80 0 10 00
Figure 5.11 Code churn (size of fix).
small config major
0 50 10 0 15 0 20 0 25 0
Figure 5.12 Bug activation in number of days.
Precision Recall F-Measure AUC
0. 4 0. 5 0. 6 0. 7 0. 8 0. 9
Figure 5.13 Performance measurements for 100 iterations.
Table 5.3 Prevalence of API failure types Symptom Percentage db error 16% test error 15% network error 10% deployment error 4% security error 4%
Other(vm error, volume error, task error, etc.) 56%
Table 5.4 Decision tree top-node analysis score of metrics after 100 iterations.
Dimension Metric Score
talked_in_mailing_list 55 number_of_times_bug _status_changed 0 severity 34 importance number_of_people_affected 61 developer_experience 0 developer_activity 42 number_of_developer _working_on_bug 193 fixing process bug_activation_in_days 35 subject_message_and_stack_trace 99 call_distance 35 commenter_experience 62 comment_count 30 comment_length 60 symptom reply_lag 124 code_churn 53 ndev 40 age 64 bug fix nuc 46
5.4 (RQ4) What are the main factors explaining the bug fixing process of small programming faults ?
Motivation. Until now, we have found that almost half of the causes of the failures are related to small programming faults. We have gathered various characteristics of these faults showing that despite requiring a simple fix, they might actually take as long to be resolved as major programming faults. Now we are interested to know the major factors in the bug fixing process of such failures. If one would be able to predict for a given reported bug, either right after the bug is reported or during the bug fixing process (when more data becomes available about the bug fixing process), that a bug likely is due to a small programming fault, bug fixing could be planned differently than in case a deadlock or major programming fault is to be expected.
Unfortunately, we do not have sufficient manually classified failures (see RQ2) to build and evaluate a prediction model. Hence, we focus on an explanatory model.
![Figure 1.1 A sample of a third party program (e.g., Docker) calling OpenStack APIs [53].](https://thumb-eu.123doks.com/thumbv2/123doknet/2341254.33891/13.918.220.693.108.265/figure-sample-party-program-docker-calling-openstack-apis.webp)