HAL Id: insu-01508666
https://hal-insu.archives-ouvertes.fr/insu-01508666
Submitted on 14 Apr 2017HAL is a multi-disciplinary open access archive for the deposit and dissemination of sci-entific research documents, whether they are pub-lished or not. The documents may come from teaching and research institutions in France or abroad, or from public or private research centers.
L’archive ouverte pluridisciplinaire HAL, est destinée au dépôt et à la diffusion de documents scientifiques de niveau recherche, publiés ou non, émanant des établissements d’enseignement et de recherche français ou étrangers, des laboratoires publics ou privés.
Distributed under a Creative Commons Attribution - NonCommercial - NoDerivatives| 4.0 International License
Effect of water table variations and input of natural
organic matter on the cycles of C and N, and mobility of
As, Zn and Cu from a soil impacted by the burning of
chemical warfare agents: A mesocosm study
Hugues Thouin, Fabienne Battaglia-Brunet, Pascale Gautret, Lydie Le
Forestier, Dominique Breeze, Fabienne Séby, Marie-Paule Norini, Sébastien
Dupraz
To cite this version:
Hugues Thouin, Fabienne Battaglia-Brunet, Pascale Gautret, Lydie Le Forestier, Dominique Breeze, et al.. Effect of water table variations and input of natural organic matter on the cycles of C and N, and mobility of As, Zn and Cu from a soil impacted by the burning of chemical warfare agents: A mesocosm study. Science of the Total Environment, Elsevier, 2017, 595, pp.279 - 293. �10.1016/j.scitotenv.2017.03.218�. �insu-01508666�
1
Effect of water table variations and input of natural organic matter on the
1cycles of C and N, and mobility of As, Zn and Cu from a soil impacted by the
2burning of chemical warfare agents: a mesocosm study.
3Hugues Thouin a,b,c,d, Fabienne Battaglia-Brunet a,b,c,d, Pascale Gautret b,c,d, Lydie Le Forestier 4
b,c,d, Dominique Breeze a, Fabienne Séby e, Marie-Paule Norini b,c,d, Sebastien Dupraz a. 5
a BRGM, 3 avenue Claude Guillemin, 45060 Orléans, France
6
b Université d’Orléans, ISTO, UMR 7327, 45071 Orléans, France
7
c CNRS, ISTO, UMR 7327, 45071 Orléans, France
8
d BRGM, ISTO, UMR 7327, BP 36009, 45060 Orléans, France
9
e UT2A, Hélioparc Pau Pyrénées, 2 avenue du président Angot, 64053 Pau, France
10
Highlights
11
Monitoring of contaminants submitted to a change of environmental conditions. 12
Saturation and desaturation cycle had the most marked impact on nitrogen cycle. 13
The addition of organic matter increased As III mobility in saturated condition. 14
These sites provide As and Zn stock for hundred years of environmental pollution. 15 Graphical abstract 16 17 18 Abstract 19
A mesocosm study was conducted to assess the impact of water saturation episodes and of the 20
input of bioavailable organic matter on the biogeochemical cycles of C and N, and on the 21
behavior of metal(loid)s in a soil highly contaminated by the destruction of arsenical shells. An 22
instrumented mesocosm was filled with contaminated soil taken from the “Place-à-Gaz” site. 23
2
Four cycles of dry and wet periods of about one month were simulated for 276 days. After two 1
dry/wet cycles, organic litter sampled on the site was added above the topsoil. The nitrogen 2
cycle was the most impacted by the wet/dry cycles, as evidenced by a denitrification microbial 3
process in the saturated level. The concentrations of the two most mobile pollutants, Zn and As, 4
in the soil water and in the mesocosm leachate were, respectively, in the 0.3–1.6mM and 20-5
110 µM ranges. After 8 months of experiment, about 83 g.m-3 of Zn and 3.5 g.m-3 of As were 6
leached from the soil. These important quantities represent less than 1 % of the solid stock of 7
this contaminant. Dry/wet cycles had no major effect on Zn mobility. However, soil saturation 8
induced the immobilization of As by trapping As V but enhanced As III mobility. These 9
phenomena were amplified by the presence of bioavailable organic matter. The study showed 10
that the natural deposition of forest organic litter allowed a part of the soil's biological function 11
to be restored but did not immobilize all the Zn and As, and even contributed to transport of As 12
III to the surrounding environment. The main hazard of this type of site, contaminated by 13
organo-arsenic chemical weapons, is the constitution of a stock of As that may leach into the 14
surrounding environment for several hundred years. 15
Keywords: mesocosm monitoring, metals, arsenic,
16
nitrogen, organo-arsenic chemical weapons, soil saturation, organic matter 17
18
3
1. Introduction
1
Soils contaminated by inorganic pollutants can lose some or all of their functions but they may 2
also evolve under the influence of forcing factors such as climate, presence of organisms or 3
human activity, and can spontaneously recover some functions when colonized by vegetation 4
(Huot et al., 2015). Contaminated soils may contain large amounts of metals and metalloids 5
whose fate is directly dependent on their evolution and function. 6
Modern warfare is a source of environmental pollution, and has been found to have highly 7
negative effects on the structure and functioning of ecosystems (Lawrence et al., 2015). 8
Chemical weapons containing nitroaromatic, chlorine, bromine and arsenical compounds, were 9
used on a massive scale. Aromatic arsenicals (AAs), such as ADAMSITE (10-chloro-5,10-10
dihydrophenarsine), CLARK I (diphenylchloroarsine), CLARK II (diphenylcyanoarsine), and 11
PFIFFIKUS (phenyldichloroarsine) were mainly produced as vomiting or vesicant agents 12
during World Wars I and II. After the conflicts, the remaining weapons were either burned, or 13
abandoned in Europe, China, Japan, and other countries by sea-dumping or earth-burying 14
(Bausinger and Preuβ, 2005). The mother molecules or their degradation products were 15
detected in soils, plants, sediments and groundwater (Bada et al., 2008, Daus et al., 2010, 16
Certini et al., 2013). The behavior of these arsenic species is controlled by environmental 17
factors. 18
Dissolved organic matter was shown to mobilize arsenic from iron oxides in soils and 19
sediments, as a result of both competition between arsenic and organic anions for sorption sites, 20
and redox reactions (Bauer and Blodau, 2006; Dobran and Zagury, 2006). 21
Soil saturation can affect biogeochemical cycles, such as those of carbon and nitrogen (Rey et 22
al., 2005; Rubol et al., 2012; Parson et al., 2013; Anderson et al., 2014) and, more generally, 23
all reactions influenced by the oxygen availability (Silver et al., 1999; Dutta et al., 2015) and 24
4
the redox conditions of the environment. Organic matter biodegradation is affected by soil water 1
content, excess water reducing microbial activity (Kowalenko et al., 1978), 60% water holding 2
capacity being generally considered as the optimum moisture content for microbial respiration 3
(Howard and Howard, 1993). More generally, moisture is one of the most important factors that 4
affect microbial community structure and processes in soils (DeAngelis et al., 2010 ; Rodrigo 5
et al., 1997), the percentage of soil space filled with water being the best indicator of 6
aerobic/anaerobic microbial activity (Linn and Doran, 1984). Concerning the cycle of nitrogen, 7
experiments and models indicate an optimum of ammonification and nitrification activities with 8
moisture close to 60%, and increase of denitrification activity at higher values of soil moisture, 9
up to water saturation (Rodrigo et al., 1997). Considering other anaerobic nitrogen 10
transformations, dissimilatory nitrate reduction to ammonium (DNRA) increases with soil 11
saturation but was observed in soils presenting 50-60% moisture (Silver et al., 2001), whereas 12
ammonium oxidation coupled to ferric iron reduction (Feammox) is considered to occur only 13
in strictly anaerobic conditions (Yang et al., 2012). However, anoxic microsites can allow 14
anaerobic microbial reaction in soils that are not water saturated (Silver et al., 2001). Saturation 15
of the soil by water can influence the behavior of metals and metalloids in polluted soils as a 16
result of the change in redox conditions. Many authors have observed that As solubility 17
increases in saturated soils because of the joint dissolution of iron oxides and reduction of AsV 18
(Kumpiene et al., 2009; Weber et al., 2010; Couture et al., 2015). Anaerobic microbial 19
reduction of Fe(III) and Mn(IV) may induce release of metals such as Cu or Zn, and this process 20
may be enhanced by soil polymers like humic materials, related compounds, and organic acids 21
produced by organic matter degradation (Gadd 2004). 22
Biogeocycles are influenced not only by the saturation level but also by its temporal dynamics. 23
Thus, carbon mineralization rate was shown to be stimulated in the zones of cyclic variation of 24
groundwater table (Banks et al., 1999, Blodau and Moore, 2003). Enhanced substrate release 25
5
due to redox-induced chemical breakdown and enhanced recycling of biomass after the redox 1
disturbance explain the stimulation of biogeochemical processes in these zones (Aller, 1994). 2
Studies describing As behavior during redox oscillation (Parsons et al., 2013, Couture et al., 3
2015) have shown that the successive cycles of oxidizing and reducing conditions affect As 4
mobility in relation with As speciation and sorption onto hydrous ferric oxide (HFO). The 5
mobility of metals such as Cu and Zn is also related to iron dissolution related to oscillation of 6
redox conditions (Schulz-Zunkel et al., 2015). 7
Here, the influence of organic matter supply and water saturation status on the dynamics of As 8
and metals was studied in a soil highly polluted by the destruction of chemical weapons. During 9
the 1920–1928 period, 200,000 shells were broken down and open-burned near Verdun 10
(France), on a site named “Place-à-Gaz”. The burning of Blue Cross shells – loaded with high 11
explosives coating a glass bottle containing solid diphenylchloroarsine (CLARK 1) and 12
diphenylcyanoarsine (CLARK 2) – resulted in locally intense soil contamination by arsenic and 13
heavy metals and a lack of vegetation (Bausinger et al., 2007; Thouin et al., 2016). 14
The pollution of this site has already been characterized and detailed in two studies (Bausinger 15
et al., 2007; Thouin et al., 2016), that revealed As concentrations up to 73 g.kg-1, and 16
concentrations of Zn, Cu and Pb reaching 90 g.kg-1, 9 g.kg-1 and 6 g.kg-1, respectively. Their 17
results demonstrated that the main As-carriers were amorphous materials composed of a blend 18
of metals and arsenate minerals of Zn, Cu and Fe together with the crystalline phases adamite, 19
olivenite, and two pharmacosiderites. On site, the most mobile contaminants were found to be 20
Zn – whose behavior was mainly determined by pH – and As, whose behavior was correlated 21
with the availability of iron sinks. The site is located in an oak forest and is therefore subject to 22
natural deposition of litter that provides bioavailable organic matter (OM). In addition, the 23
clayey formation beneath the contaminated soil severely limits the infiltration of rainwater and 24
favors runoff of soluble inorganic pollutants from the site. Saturation of the lower part of the 25
6
contaminated layer was also observed during periods of high precipitation. The stability of the 1
pollutants can therefore be altered by the evolution of environmental conditions. 2
The contaminated soil is rich in organic carbon (about 250 g.kg-1), consisting mainly of charcoal 3
resulting from the use of firewood during destruction of the shells. However, the presence of 4
biodegradable OM at the edge of the site was also demonstrated by Thouin et al. (2016). The 5
two types of OM (charcoal and fresh OM) may influence the mobility of metals and metalloids, 6
either because of the high adsorption capacity of the charcoal (Hua et al., 2009) or by chelation 7
or methylation processes occurring in the presence of fresh organic compounds (Park et al., 8
2011; Huang et al., 2012). Bioavailable OM can also promote bacterial activity and change 9
environmental conditions locally through microbial consumption of electron acceptors, thus 10
inducing redox gradients. 11
This study aimed to evaluate the effect of (i) water saturation episodes and (ii) input of 12
bioavailable OM on the behavior of pollutants that have been submitted to these environmental 13
changes for 80 years. To this end, an 8-month experiment was conducted with a 1 m3 14
mesocosm. The originality of this work, compared with previous studies, lies in the combination 15
of its size and duration, combined with the specificity of the polluted material. A mesocosm is 16
an intermediate scale between full field scale and the laboratory microcosm. It is suitable for 17
simulating environmental events in controlled conditions and for monitoring of contaminants 18
in soil pore water. The composition of soil waters at different depths and in leachates provides 19
information on the processes that can influence the biogeocycles of carbon and nitrogen and 20
the fate of contaminants and the potential for transfer towards surrounding compartments. 21
2. Materials and methods
222.1. Study site and soil sampling
7
The study site, known as “Place-à-Gaz”, is located in the Spincourt forest, 20 km northeast of 1
Verdun, France (Bausinger et al., 2007; Thouin et al., 2016). On the site, there is a black layer 2
of soil containing slag, coal ashes and ammunition residues resulting from the thermal 3
destruction of arsenical shells (Bausinger et al., 2007; Thouin et al., 2016). The substrate 4
beneath this contaminated layer is a clayey Woëvre formation of Callovian. These clays limit 5
the infiltration of rainwater and induce the runoff together with the saturation of the lower parts 6
of black layer. 7
An instrumented mesocosm was filled with about 1 m3 of material taken from the black layer 8
(between 0 and 30 cm) with an excavator in October 2015. The material was excavated from 9
the most contaminated part of the site. The concentrations of the main pollutants, analyzed by 10
NITON© X-ray fluorescence field apparatus, were 132.44 ± 3.66 g.kg-1, 87.31 ± 5.08 g.kg-1, 11
18.36 ± 0.63 g.kg-1, 4.78 ± 0.19 g.kg-1 for As, Zn, Cu and Pb respectively. Oak organic litter 12
was taken from the edge of the forest, close to the study site. The surface litter corresponding 13
to the previous year's deposit was not sampled, only the thinner older organic litter was taken. 14
It contained 305 g.kg-1 of total organic carbon and a C/N ratio of 21.4. 15
2.2. Instrumented mesocosm
16
The instrumented mesocosm (Fig. 1) consisted of a closed stainless steel column (1 m in 17
diameter and 1.2 m high) filled with 610 kg of homogenized contaminated soil, placed in a 18
temperature-regulated room at 23 ±1 °C . A layer of inert gravel (centimetric quartz and flint 19
particles) and a geotextile membrane were disposed at the bottom of the mesocosm to facilitate 20
outflow drainage without loss of soil particles. During filling, the column was equipped at four 21
8
depths (H1: 5 cm, H2: 20.5 cm, H3: 36 cm and H4: 48 cm, measured from the top) with time 1
domain reflectometry (TDR) probes (TRIME-PICO32, IMKO), to measure soil moisture and 2
Figure 1: A. Schematic of the mesocosm experiment. a: stainless steel column, b: controlled atmosphere, c: organic litter, d: contaminated soil, e: geotextile membrane, f: inert gravel, g: feedwater, h: LED lighting, i: watering system, j: porewater samplers, k: soil moisture and temperature probes, l: water table in wet condition, m: water table in dry condition, n: water level control, o: balance, p: Fluorinated ethylene propylene water tubing, q: gas tubing. B. Experiment design. P1, P3, P5, P7 were dry periods, P2, P4, P6, P8 wet. From the beginning of P5 forest litter was added at the top of the contaminated soil. H4 was permanently saturated; (blue) H2 and H1 were never saturated. The H3 level was not saturated in the dry period and saturated in the wet period. The leachate (L) was sampled at the outlet of the mesocosm.
9
temperature, and with inert Polytetrafluoroethylene/Quartz porous probes (pore size 2 µm, three 1
probes for each sampling depth) to sample soil water. These probes were inserted into the soil 2
at 30 cm from the column wall. Five Horticultural light-emitting diode (LED) at the top of the 3
column simulated 12-hour day/night cycles. Rainfall was simulated by a sprinkler system 4
connected to a water reservoirand fed by two pumps. The leachate was collected in a steel tank 5
and quantified using a weighing balance. Outflow weight and soil moisture and temperature at 6
the four sampling levels (H1, H2, H3 and H4) were monitored continuously, with a frequency 7
of one hour. 8
2.3. Experiment design
9
The study of vertical flows, in this instrumented mesocosm, will allow understanding the 10
phenomena related to the water flows, constrained on the site by the clayey substrate. We 11
consider that the flows studied in the unsaturated levels of the mesocosm are representative of 12
the vertical flows taking place in the unsaturated zone of the polluted soil on site, and that flows 13
in the saturated part of the mesocosm corresponds to runoff taking place at the base of the 14
polluted layer on site. Water soil saturation effects were studied by simulation over around 15
8 months of cycles of dry/wet periods (P) of about one month each, referred to below as P1 to 16
P8 (Fig.1B). The dry period was characterized by a saturation of the bottom of the mesocosm 17
limited to the H4 level, and by the addition of around 12 L of Mont Roucous water once a week. 18
This mineral water was used because of its chemical composition close to that of rainwater (pH 19
= 6.38, electrical conductivity = 160 µS.cm-1, Cl- = 56 µM, NO3- = 24 µM, SO42- = 16 µM, Na+ 20
= 109 µM, K+ = 7.7 µM, Ca2+ = 25 µM, Mg2+ = 21 µM). The wet period was characterized by 21
elevation of the water table in order to saturate both H3 and H4 levels, and by the addition of 22
6 L of water every two days. After two dry-period/wet-period cycles (day 126), 24 kg of fresh 23
organic forest litter taken from the “Place-à-Gaz” site was added above the topsoil in order to 24
study the impact of a supply of fresh OM. The mesocosm atmosphere was controlled and 25
10
renewed by wet compressed air (N2 = 82.45 ± 0.15 %, O2 = 22.68 ± 6.7 10-2 % and CO2 = 1
0.053 ± 6.7 10-4%) at a flow rate of 60 L.h-1 for the duration of the experiment. 2
2.4. Sampling and analyses of soil water and leachate
3
Sampling of soil waters from levels H2, H3, H4 (not from H1 because this level did not contain 4
enough water) and of the mesocosm leachate L was performed twice a week (before sprinkle) 5
via fluorinated ethylene propylene (FEP) tubing connected to a peristaltic pump. Major ions 6
and physicochemical parameters of water samples were measured directly. Electrical 7
conductivity (EC), redox potential (Eh), pH, dissolved oxygen (DO), and temperature of 8
interstitial water were measured with a benchtop meter (multiparameter analyzer C3040, 9
Consort) connected to an ORP sensor (platinum electrode, with a Ag/AgCl reference electrode,
10
3M KCl, Eh value refers to the normal hydrogen electrode (NHE)), oxygen probes 11
(Fisherbrand), pH electrode (Fisherbrand) and conductivity probe (Sentek). Total alkalinity 12
(TA) of the leachate was measured by titration, with the 848 Titrino plus (Metrohm). 13
Major ions (Li+, Na+, NH4+, K+, Ca2+, Mg2+, F-, Cl-, NO2-, Br-, NO3-, SO42-, PO43-) were
14
analyzed and quantified by ion chromatography (IC) using a 940 Professional IC Vario
15
instrument (Metrohm, Herisau, Switzerland) equipped with conductivity detectors. Anions
16
were separated with a Metrosep A Supp 16 ionic resin column (150 mm × 4 mm i.d.) and
17
cations with a Metrosep C6 (150 mm × 4 mm i.d.). The quantification limits and precision of
18
all analytical methods are presented in supplementary material SM.6.
19
In addition, trace element concentrations (As, metals) and dissolved organic carbon (DOC) 20
were determined once a week. The soil water samples were filtered at 0.45 µm and As
21
speciation was performed immediately with an ion exchange method (Kim, 2001). Separation
22
was performed on anionic resin (AG 1-X8©, Biorad, Hercules, CA, USA). In these conditions
23
(pH < 9.3), this method separates non charged species, such as As III, from anionic species
11
including As V. Data obtained with this method were presented as As III-like and As V-like
1
species. A water sample was acidified for determination of total As, Fe, Cu, Zn and Pb. Arsenic
2
and metals were quantified with an Atomic Absorption Spectrometry oven (AAS; Varian, Palo
3
Alto, CA, USA). DOC concentration was measured using a TOC 5050/SSM 5000-A
4
(Shimadzu) elemental analyzer.
5
As speciation in soil waters was determined once a month by HPLC-ICP MS. Chromatographic
6
separation was carried out with a Model 1100 HPLC pump (Agilent, Wilmington, DE, USA)
7
as the delivery system. The exit of the column was connected directly to the Meinhard nebulizer
8
(Glass Expansion, Romainmotier, Switzerland) of the ICP MS (Agilent 7500cx, Tokyo, Japan)
9
via PEEK tubing. Injections were performed using a Rheodyne valve with a 100 µL loop.
10
Arsenic species separation was performed using an anion exchange column (Hamilton
PRP-11
X100 – 250 mm x 4.1 mm). The mobile phase used was a carbonate based gradient at pH 8.9
12
(20 mM from 0 to 10 min and 50 mM from 10 to 25 min). This allowed determination of
13
arsenobetaine, As III, As V and methylated As species (DMAA and MMAA). Phenylated As
14
compounds (courtesy of Lionel Lumet, Laboratoire de l’Environnement et de la Vendée,
15
France) such as diphenylarsinic acid (DPAA), triphenylarsine oxide (TPAO) and
16
triphenylarsine (TPA) were also injected but were not eluted from the column in these
17
conditions. Concentration values and uncertainties found were calculated from a duplicate
18
determination.
19
A previous study has described the presence on the site of nitroaromatic and organoarsenical
20
compounds (Bausinger et al., 2007). Twenty five nitroaromatic and six aromatic arsenical
21
compounds were searched in the contaminated soil and the mesocosm leachate at the end of the
22
experiment (P8) by a specialized laboratory (Envilytix, Wiesbaden, Germany) Nitroaromatic
23
compounds were analyzed according to ISO 11916-1 (2013) and KORA-TV 5 method (Joos et
24
al., 2008). Diphenylarsinic acid was analyzed by HPLC-DAD and cacodylic acid, clark I, clark 25
12
II, triphenylarsine, 9-phenylarsafluorene were analyzed by GC-MS applying the method 1
detailed in Bausinger and Preuβ (2005) and Bausinger et al. (2007). 2
2.5. Gas analyses of atmosphere and respiratory test
3
CO2, O2, H2, N2, N2O,CO and CH4 as well as light hydrocarbons in the atmosphere of the
4
mesocosm were analyzed online, every week, using a gas chromatograph (Compact GC 5
Interscience, CPG) equipped with three columns and detectors in parallel, with He as carrier 6
gas. H2, O2, N2, and CO were separated in an Rt-Msieve 5A column (5A, 15 m × 0.32 mm) and 7
CO2, CH4 and N2O were separated in a HayeSep D column (30 m × 0.32 mm). Gaseous species
8
were analyzed by thermal conductivity detector (TCD). In the third column (Stabilwax,
9
12 m × 0.32 mm), volatile organic carbon (VOC) and BTEX were separated and analyzed by
10
flame ionization detection (FID). The gas chromatograph was linked directly to the column
11
atmosphere via 0.8–1.6 mm (1/16) PEEK capillary tubing.
12
The mineralization of CO2 by the mesocosm was evaluated 6 times, at the end of each period
13
with the exception of P1 and P2. The increase of CO2 in the column atmosphere was measured
14
in dark conditions and without input of atmospheric air. CO2 concentrations were analyzed
15
about every 7 minutes over 3 hours. Carbon mineralization rates were calculated from the linear 16
increase of CO2 concentration in the column over time.
17
Arsine gases, including arsine, monomethylarsine (MeAsH2), dimethylarsine (Me2AsH) and
18
trimethyl arsine (TMAs), were quantified at the end of each period P using the method from
19
Mestrot et al. (2009). Arsines were trapped on silver nitrate impregnated silica gel containing
20
tubes connected to the outlet of the mesocosm for 3 days. Traps were eluted with 5 mL of
21
boiling water. Concentrated hydrogen peroxide (100 µL) was added to the eluate in order to
22
respectively oxidize TMAs to trimethylarsine oxide (TMAO), Me2AsH to dimethylarsinic acid
23
(DMAA), MeAsH2 to monomethylarsonic acid (MMAA) andarsenite to arsenate, for further
13
determination. Solutions obtained from the gaseous traps were determined by HPLC-ICP MS
1
in the elution conditions given in Mestrot et al. (2009) using a phosphate buffer (10 mM pH
2
6.2) as mobile phase. These conditions allow the determination of TMAO, DMAA, MMAA
3
and As(V) in solutions originally corresponding to the following gaseous arsines (TMAs,
4
Me2AsH, MeAsH2 and AsH3, respectively) after their oxidation
5
2.6. Leaching tests
6
In parallel to the mesocosm experiment, leaching tests were performed to estimate the mobility 7
of major compounds, metals and arsenic from the different solid materials used in this study. 8
Tests were performed with solid/liquid ratios from 1 to 10 (wet solid equivalent to 10 g of dry 9
weight, 100 mL of Mont Roucous water in tubes) for both materials: polluted soil (similar to 10
soil mesocosm, “Soil”) and forest litter (“OM”). Tubes were rotated on a roller mixer for 24h 11
at 20°C. All conditions were performed in triplicates. Chemical parameters, ions, metals and 12
arsenic concentrations were measured by methods previously described. 13
2.7. Statistical analyses
14
All statistical tests were conducted in R 3.2.4 (www.r-project.org). To summarize temporal 15
trends of element concentration, values were plotted with a smooth curve based on the loess 16
function (ggplot 2 package). The Loess function is a smooth local regression for 17
“geom_smooth” in the ggplot2 package for a small sample size; it is controlled by the “span” 18
setting (Wickham, 2009) ranging from 0 (exceedingly “wiggly” smooth curve) to 1 (less 19
“wiggly” smooth curve). In this study, span was set between 0.3 and 0.4, depending on the 20
variation of the temporal data. 21
Overall trends, without the effect of dry/wet cycles, were also statistically tested using the 22
Seasonal Kendall (SK) test (Hirsch et al., 1982; Hirsch and Slack, 1984), which is a modified 23
version of the non-parametric Mann Kendall test (Mann, 1945; Kendall, 1948) for monotonic 24
trend. The SK test, which is robust to outliers and missing values, can be used considering inner 25
14
dependence of data. The seasonal effect (here the shift between dry and wet periods) is reduced 1
by making comparisons between data from a similar season (period). Kendall’s tau (τ) measures 2
the degree of correspondence between two variables. If τ = 0 no correlation exists between the 3
pairs, if τ is positive there is an upward trend and a negative τ is associated with a downward 4
trend. The statistical significance of the trend is indicated by the corresponding p-value (p ≤ 5
0.05 is considered significant). The statistical parameters τ and p-value were shown on the 6
curves exclusively for significant trends. All results of SK test are given in SM.4. 7
Results from leaching tests were tested for homogeneity of variance and normality. One-way 8
analysis of variance and Tukey tests were carried out to test for any differences between each 9
treatment. For each treatment the number of observations was equal to 3, and a difference of 10
5% between means (p ≤ 0.05) is considered significant. 11
3. Results
123.1. Composition of soil water and leachate
13
3.1.1. Physicochemical parameters
14
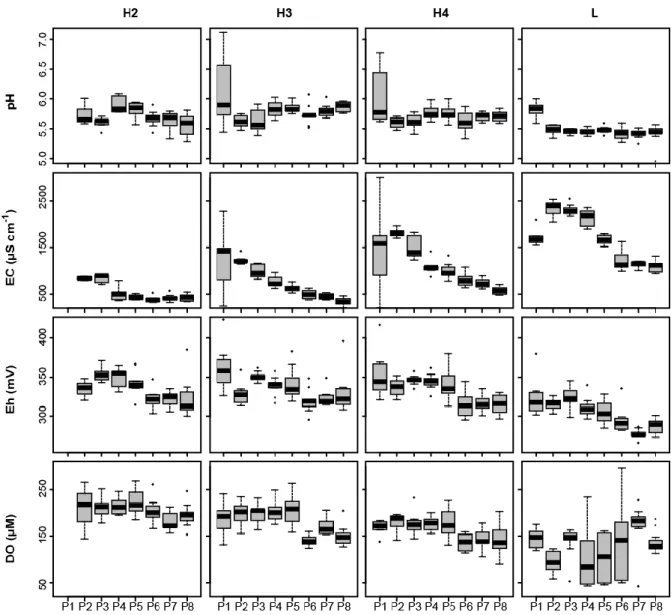
The physicochemical parameters of water (pH, EC, Eh and DO) for the 3 levels of soil waters 15
and leachate are shown in Figure 2. Soil waters and leachate were characterized by pH values 16
between 5.5 and 6.0 at all of the different depths of soil water and throughout the experiment. 17
Leachates were slightly more acid than the soil waters. Electrical conductivity ranged from 500 18
to 2,500 µS.cm-1. EC increased with depth and was highest in the leachate. In the samples from 19
each level, the maximum EC was measured in the first or second period and decreased until the 20
end of the experiment. 21
15 1
The redox potential (Eh) varied between 270 and 380 mV, indicating moderately oxidized soil 2
waters and leachates. Eh was stable during the first 4 periods and then decreased, particularly 3
in H4 and L. DO varied between 250 and 160 µM in H2 to 180 and 140 µM in H4. In H3 and 4
H4, DO was lower in P6–P8 than in P1–P5 (about 180 to 140 µM). DO in the leachate fluctuated 5
widely between 200 and 50 µM throughout the experiment. 6
3.1.2. Major ion concentrations
7
Figure 2: Evolution of physicochemical parameters in each sampling level. Boxplots represent the median, 25th percentile and the 75th percentile, error bars indicate 10th and 90th percentile. Data not included between the whiskers were plotted as an outlier. Each boxplot includes values of one period P (n = 5–10).
16
Major ions, with an average content greater than 0.05 mM, were Cl-, NO3-, SO42-, K+, Na+, Ca2+ 1
and Mg2+. In order, their concentrations in soil waters were, respectively: Cl- > NO3- > SO4 2-2
and Ca2+ > Na+ > Mg2+ > K+ (SM.5). However, NO3- concentrations were lower (< 0.01 mM) 3
at the bottom of the mesocosm and in the leachate. Concentrations of most of the ions analyzed 4
(Cl-, SO42-, K+, Na+, Ca2+, Mg2+) increased with depth and increased in the leachate in 5
accordance with EC. 6
7
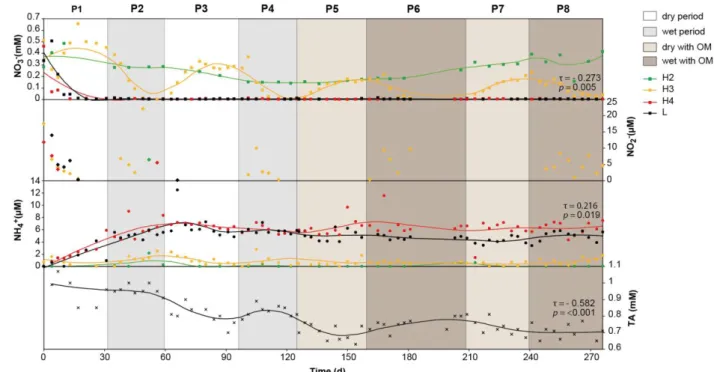
The evolution of NO3-, NO2- and NH4+ with depth (Fig. 3) was different. In the unsaturated 8
level H2, NO3- concentration varied between 0.15 and 0.4 mM and for the saturated level H4 9
and the leachate L, concentration decreased quickly under 0.01 mM during the first period P1. 10
At level H3, NO3- concentrations increased to reach a plateau in the dry periods then decreased 11
until they disappeared in the wet periods. The maximum concentrations decreased from 0.5 mM 12
during P1 to 0.2 mM at the end of P7. This significant trend for NO3- concentrations was found 13
only in level H3 level (τ = -0.273, p = 0.005).Small amounts of NO2- were present in the water 14
in H4 and L at the beginning of the experiment, and in H3 during each wet period. However, 15
Figure 3: Measured evolution of NO3- (square), NO2- (diamond), NH4+ (circle) and TA (cross) concentrations. Curves correspond to smooth local regression (span = 0.3). Kendall’s tau (τ) and p-value were given for significant trends with SK test (p < 0.05).
17
except for P1, no NO2- was detected during dry periods. NH4+ concentrations showed no 1
significant trend, but two different behaviors. In H2 and H3, NH4+ concentrations were low (< 2
2 µM) and constant, but in H4 and L concentrations increased until 6 µM during the two first 3
periods and then remained constant. 4
Total alkalinity (TA) in the leachate decreased from 1 to 0.65 mM (Fig. 3). This decrease was 5
statistically significant based on the SK test (τ = - 0.582, p < 0.001). TA was subjected to 6
monthly variability and therefore increased to a local maximum during wet periods (P2, P4 and 7
P6) and decreased in dry periods (P1, P3 and P5). These variations were narrower in the last 8
two periods, P7 and P8. 9
10
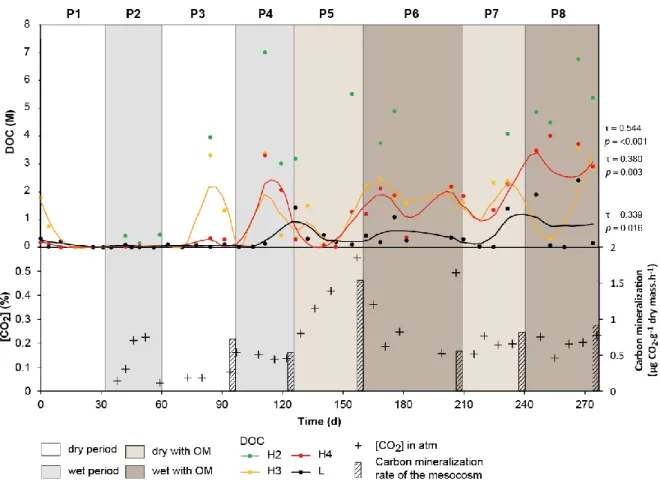
Figure 4: Evolution of DOC (circle), gaseous CO2 in mesocosm atmosphere (cross) and carbon mineralization rate of the mesocosm (bar), measured at the end of periods P3–P8. Curves correspond to smooth local regression (span = 0.4). For H2 level sampling no local regression was calculated because of the low frequency of measurement. Kendall’s tau (τ) and p-value were given for significant trends with SK test (p < 0.05).
18
Dissolved organic carbon (DOC) concentrations were very high in the soil water at level H2 (> 1
2 M) and decreased with depth (Fig. 4). DOC was less concentrated before the addition of forest 2
litter, but a few samples in H2, H3 and H4 revealed high concentration peaks. After the addition 3
of organic litter to the top of the mesocosm, DOC concentrations increased in all the samples 4
until the end of period P8. Despite the measurement of sporadic extreme values, monthly cyclic 5
variations are visible at each sampling level. Focusing on seasonal variability induced by 6
dry/wet periods revealed significant positive trends in H3 (τ = 0.544, p < 0.001), H4 (τ = 0.380, 7
p = 0.003) and L (τ = 0.339, p = 0.016) (not calculated in H2 because of the low frequency of 8
measurement). 9
3.1.3. Evolution of metals and arsenic concentrations
10
Zn was the metal with the highest concentration in soil water and leachate. Zn concentrations 11
evolved in a similar manner at each sampling level, with an increase at the beginning of the 12
experiment followed by a slight decrease (Fig. 5). However, a lag time was observed with depth, 13
with maximum concentration in P1 for H2 and H3, in P2 for H3, and in P4 in the leachate. Zn 14
also became more concentrated with depth. It seems that dry/wet cycles have no major effect 15
on the Zn concentrations in soil water but, following the addition of fresh OM, the Zn 16
concentration in the output water decreased sharply from 1.40 to 1.21 mM. 17
Cu and Fe concentrations in solution were low, with maximum amounts of about 5 µM and 40 18
µM , respectively (Fig. 5). Negative trends were observed in H2, H3 and L, with higher values 19
before the addition of organic matter. In H4, Cu was mostly below the quantification limits (LQ 20
= 1.57 µM) from P1 to P4 but, after the addition of litter, Cu concentrations in H4 were higher 21
than at other depths. Moreover, Cu concentrations at each sampling level stabilized to a constant 22
value after the addition of organic litter. Fe concentration increased significantly in H3, H4 and 23
L (τ = 0.298, p = 0.035; τ = 0.343, p = 0.011; τ = 0.519, p < 0.001), while negative trends were 24
19
observed in H2 (τ = - 0.302, p = 0.047). Pb concentrations were below the quantification limits 1
(LQ = 0.5 µM) in the soil waters. 2
3
Together with Zn, As was a mobile inorganic contaminant throughout the experiment, although 4
the evolution of As concentration was very different: As concentrations were generally higher 5
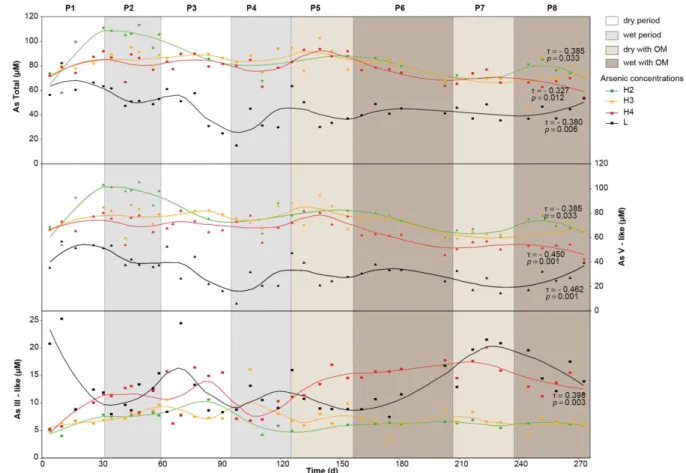
in the H2 level and decreased with depth (Fig. 6). No clear impact of dry/wet period was 6
observed, even if monthly cycles are enhanced by the smooth curve of the data. Furthermore, 7
the evolution of As total showed significant negative trends for H2 (τ = - 0.385, p = 0.033), H4 8
(τ = - 0.327, p = 0.012) and L (τ = - 0.380, p = 0.006), and it seems that, for soil waters, this 9
trend was accentuated after the addition of OM and was visible after 140 days. The same 10
Figure 5: Evolution of concentrations of Zn (circle), Cu (triangle) and Fe (square). For Cu and Fe concentration, measurements were plotted at respectively 1.57 and 1.79 µM when value was below the quantification limit (LQCu = 1.57 µM and LQFe = 1.79 µM)). Curves correspond to smooth local regression (span = 0.3). Kendall’s tau (τ) and p-value were given for significant trends with SK test (p
20
evolution was observed with As V-like, which was the dominant As species in solution. At H4, 1
however, As V-like decreased more significantly (τ = -0.450; p = 0.001) than As total. As III-2
like increased significantly (independently of the cyclical variability) in level H4 (τ = 0.398, p 3
= 0.003), especially after the addition of organic matter. In H2 and H3, As III-like concentration 4
ranged from 5 to 10 µM, with low amplitude of cyclic variation, while the concentration in L 5
ranged from 10 to 25 µM 1, with a high amplitude of monthly variation. 6
7
Results of arsenic speciation obtained with HPLC-ICP MS in water from H2, H3 and H4 (Fig. 8
7) show that As V concentration presents a distribution similar to that of As V measured as total 9
As after separation on anionic resin. Conversely, As III concentrations measured with HPLC-10
ICP MS were lower. Four other As species were detected in soil water. Diphenylarsinic acid 11
Figure 6: Evolution of concentrations of total As (circle), As V-like (triangle) and As III-like (square) obtained by separation with resin and analyses by AAS. Curves correspond to smooth local regression (span = 0.3). Kendall’s tau (τ) and p-value were given for significant trends with SK test (p < 0.05).
21
(DPAA) was identified and quantified in the mesocosm leachate at the end of the experiment 1
(P8), its concentration reaching 30.6 µg.L-1 (SM.2). Three unidentified species were also 2
detected. Concentrations of the first unidentified compound ranged from 2 to 2.5 µM and were 3
very homogeneous over all of the sampling levels and each of the periods. Unidentified 1 was 4
the third main arsenic species after As V and As III in terms of concentration. The second 5
unidentified compound was only detected in H4 and L, with concentrations increasing from 6
about 1 to 2.5 µM, and in H3 during the wet periods (P2, P4, P6 and P8). A third unidentified 7
compound was detected in the leachate L and at all depths, however, it could not be quantified 8
because of its lesser concentrations. 9
22 1
3.2. Fluxes of solutes
2
Fluxes and total leaching of compounds were calculated for: the first four periods (P1–P4, 126 3
days) with a mean water flux of 2.65 L.d-1; for the four periods after theaddition of forest litter 4
(P5–P8, 138 days) with a mean water flux of 2.01 L.d-1; and for the whole experiment (Tab. 1). 5
Table 1: Solute fluxes during the periods P1–P4 and P5–P8 (respectively before and after the addition 6
of organic litter). Water leachate volume was measured with a balance. Total compound leaching was 7
calculated by assuming that compound concentration in the leachate between two sampling operations 8
was equal to the concentration measured in the last sample. Water fluxes were calculated by dividing 9
Figure 7: Arsenic speciation in soil water samples at the end of each period measured with HPLC-ICP MS. Unidentified 1 and unidentified 2 were unidentified As species. Their concentrations were evaluated from calibration of other species and are only indicative. (LQ = 1.3 10-3 µM for As III and LQ = 6.7 10-3 µM for the other species).
23
the leachate volume by the total period duration and the elemental fluxes were calculated by dividing 1
the amount of compound leached during the period by the total period duration. 2 Period P1-P4 P5-P8 Total Duration (day) 126 138 264 Leachate volume (L) 334 278 612 Water flux (L.d-1) 2.65 2.01 2.32 Flux Total leaching Flux Total leaching Flux Total leaching Major compounds (mg.m-3.d-1) (g.m-3) (mg.m-3.d-1) (g.m-3) (mg.m-3.d-1) (g.m-3) DOC 4,959.1 624.8 30,626.3 4,224.4 18,372.9 4,849.2 TA 4.1 0.5 2.5 0.4 3.3 0.9 Cl- 203.9 25.7 87.9 12.1 143.3 37.8 Br- 2.7 0.3 1.0 0.1 1.8 0.5 SO42- 134.3 16.9 65.8 9.1 98.5 26.0 K+ 8.1 1.0 4.5 0.6 6.2 1.6 Na+ 11.4 1.4 5.9 0.8 8.6 2.3 Ca2+ 162.1 20.4 72.9 10.1 115.5 30.5 Mg2+ 12.8 1.6 6.4 0.9 9.4 2.5 Metals and arsenic Fe 1.90 0.24 3.03 0.42 2.49 0.66 Zn 374.85 47.23 260.63 35.63 315.16 83.18 Cu 0.75 0.10 0.34 0.05 0.54 0.14 As total 14.46 1.82 12.56 1.73 13.47 3.55 As III-like 4.45 0.56 3.62 0.50 4.01 1.06 As V-like 11.47 1.45 7.61 1.05 9.45 2.50
During P6, 12 days have been excluded from calculation because the monitoring was stopped and no 3
water was input to the mesocosm. 4
After 276 days, the most leached compounds were DOC, Zn2+, Cl-, Ca2+, SO42- and, to a lesser 5
extent, As, Mg2+, Na+ and K+. Among these compounds, Zn and As were the most mobile 6
metal(loid)s, with, respectively, total amounts of 83.18 and 3.55 g.m-3 leached, with about 30% 7
of As III-like. Fluxes of DOC and Fe increased after the addition of OM, ranging from 4,959 8
to 30,626 mg.m-3.d-1 for DOC and 1.90 to 3.03 mg.m-3.d-1 for Fe. Between the first periods (P1-9
P4) and the periods following the addition of organic litter (P5–P8), the majority of the other 10
compound fluxes were significantly halved, with the exception of As total flux which decreased 11
less after the addition of OM (from 14.46 to 12.56 mg.m-3.d-1). 12
24
3.3. Gas composition and carbon mineralization
1
Among all the gases analyzed (i.e. CO2, O2, H2, N2, N2O,CO, CH4 and BTEX) only CO2, O2,
2
H2, N2 were detected in the atmosphere of the mesocosm during the experiment. CO2 was the
3
only gas for which concentrations varied (Fig. 4). The sum of the concentrations of CO2, O2,
4
H2 and N2 was less than 100% because of the presence of water vapor in the mesocosm
5
atmosphere. Prior to the addition of OM, the CO2 concentrations seem to have been driven by
6
the wet/dry periods, with higher concentration during the wet periods. CO2 concentration was
7
clearly affected by the addition of organic litter, with a strong increase from 0.137 to 0.556%
8
during period P5. After this increase, the values dropped and stabilized at about 0.200%.
9
The rate of carbon mineralization in the mesocosm was evaluated at the end of periods P3, P4,
10
P5, P6, P7 and P8 (Fig. 4). It was highest at the end of P5, the first period following the addition
11
of OM, at 1.54 µg CO2 g-1 dry mass.h-1. No major difference was observed in the other periods,
12
but rates were slightly higher at the end of dry periods (mean(P3, P5, P7) = 1.03 ± 0.27 µg CO2.g-1
13
dry mass.h-1) than wet periods (mean(P4, P6, P8) = 0.67 ± 0.12 µg CO2.g-1 dry mass.h-1), and were
14
also higher after the addition of OM (mean(P3-P4) = 0.63 ± 0.08 µg CO2.g-1 dry mass.h-1, mean
(P5-15
P8) = 0.95 ± 0.24 µg CO2.g-1 dry mass.h-1).
16
As volatilization from the mesocosm was evaluated at the end of each period. Dimethylarsine, 17
quantified as dimethylarsinic acid (DMAA), was detected in traps for all periods. The mean 18
rate of dimethylarsine volatilization was 1.65 ± 0.66ng.m-2.d-1 for the first four periods and 19
5.83 ± 3.04ng.m-2.d-1 after the addition of forest litter. The maximum rate of dimethylarsine 20
volatilization was 16.13 ng.m-2.d-1 and corresponded to period P5. No other volatile As species 21
was detected in the traps. 22
3.4. Leaching test
25
The contribution of soil and litter to the composition of water from the mesocosm experiment 1
was estimated by a leaching test with Mont Roucous water. The results for chemical parameters 2
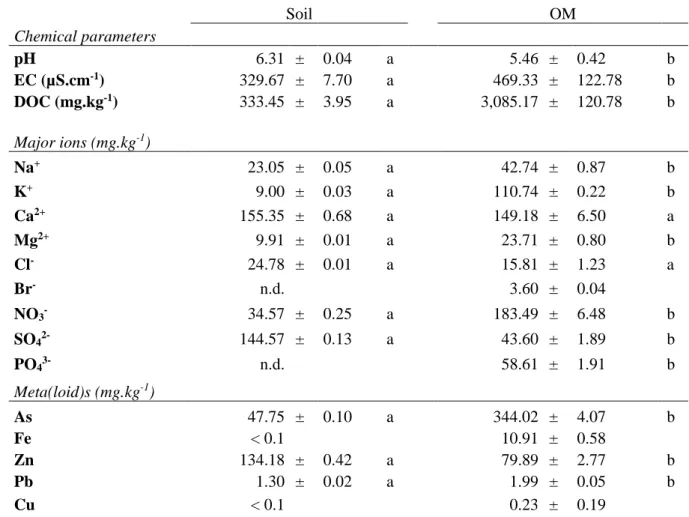
and quantities of major ions and metal(loid) compounds are presented in Table 2. 3
Table 2 Leaching test of the polluted soil (Soil) and the forest litter (OM). 4 Soil OM Chemical parameters pH 6.31 ± 0.04 a 5.46 ± 0.42 b EC (µS.cm-1) 329.67 ± 7.70 a 469.33 ± 122.78 b DOC (mg.kg-1) 333.45 ± 3.95 a 3,085.17 ± 120.78 b Major ions (mg.kg-1) Na+ 23.05 ± 0.05 a 42.74 ± 0.87 b K+ 9.00 ± 0.03 a 110.74 ± 0.22 b Ca2+ 155.35 ± 0.68 a 149.18 ± 6.50 a Mg2+ 9.91 ± 0.01 a 23.71 ± 0.80 b Cl- 24.78 ± 0.01 a 15.81 ± 1.23 a Br- n.d. 3.60 ± 0.04 NO3- 34.57 ± 0.25 a 183.49 ± 6.48 b SO42- 144.57 ± 0.13 a 43.60 ± 1.89 b PO43- n.d. 58.61 ± 1.91 b Meta(loid)s (mg.kg-1) As 47.75 ± 0.10 a 344.02 ± 4.07 b Fe < 0.1 10.91 ± 0.58 Zn 134.18 ± 0.42 a 79.89 ± 2.77 b Pb 1.30 ± 0.02 a 1.99 ± 0.05 b Cu < 0.1 0.23 ± 0.19
Average values are expressed with their standard deviation (n=3). Values with different letters are 5
significantly different (p < 0.05, ANOVA Tukey-HSD) 6
The pH of leaching tests ranged from 6.31 in the “Soil” test to 5.46 in the “OM” test. EC and 7
DOC were significantly higher in the “OM” test. In the “Soil” leachate, Ca2+ and SO42- were 8
the most mobile ions, while Ca2+, K+ and NO3- were the dominant ions in the “OM” leachate. 9
As indicated by EC, the “OM” leachate contained higher amounts of ions, especially Na+, K+, 10
Mg2+, NO3- and PO43-. As, Fe, Pb and Cu were significantly more concentrated in leachate from 11
the forest litter than from contaminated soil, up to seven times for As. DPAA was identified in 12
the “Soil” leachate, with a concentration of 114 µg.L-1 (SM.2). 13
26 1
4. Discussion
2
4.1. Influence of saturation and OM on C and N cycles
3
Apart from the important concentration of metals and arsenic on the “Place-à-Gaz” site , this 4
soil also contains a high amount of organic carbon (up to 250 g/kg, Thouin et al., 2016). As 5
demonstrated in the previous study (Thouin et al., 2016), two types of organic matter with very 6
different biodegradabilities are present on the site: low degradable organic matter, inherited 7
from the burning of firewood used during the destruction of ammunition (charcoal); and more 8
biodegradable organic matter that comes from the forest litter. Charcoal accounts for most of 9
the organic matter in the central part of the site. Wildfire-formed charcoals have the potential 10
to greatly enhance soil fertility by enhancing N cycling (Berglund et al., 2004), and to provide 11
habitat for microbial life (Pietikainen et al., 2000). However, the “Place-à-Gaz” site has been 12
characterized by a lack of vegetation in its central part for almost a century. It is therefore 13
obvious that charcoals, both bearing and mixed with high amounts of contaminants, have not 14
promoted growth of vegetation on the site. Charcoals' stability and resistance to microbial 15
degradation make them important long-term carbon sinks (Schmidt and Noack, 2000), meaning 16
that most of the organic matter on the site is not bioavailable for the growth of microorganisms 17
and vegetation. In the surrounding areas, close to the forest, three species have colonized the 18
contaminated soil: a moss Pohlia nutans (Hedw.), a lichen Cladonia fimbriata (L.), and an 19
herbaceous species Holcus lanatus (L.). The input of forest litter, which provides bioavailable 20
nutrients, was certainly the cause of plants establishing themselves and then also influenced the 21
site's carbon cycle. 22
The mesocosm experiment described here studied the modification of the carbon cycle induced 23
by the input of oak forest litter. DOC concentrations in the mesocosm experiment were always 24
higher than the common range of DOC concentration in soil water (Boyer et al., 1996, Clarke 25
27
et al., 2005). A major part of the DOC in the mesocosm may be derived from the burned organic 1
matter that might not have been entirely mineralized. Similar DOC concentrations, ranging 2
from 25 to 7500 mM, were reported in leachates from disposal sites which contained municipal 3
solid waste incineration residues (Seo et al., 2007). Here, the addition of forest litter induced a 4
significant increase in DOC concentration in the soil water (Fig. 4) and a very high flux of DOC 5
during the periods following the input (Tab. 2). The results of the leaching experiment – 6
showing a significantly higher amount of organic carbon leached from the forest litter than from 7
the contaminated soil (Tab. 4) – underpin the impact of forest litter on DOC content in the soil 8
water. DOC is the primary carbon source for heterotrophic bacteria in soils (Metting, 1993, 9
Horemans et al., 2013), so the increase in the carbon mineralization rate in the mesocosm after 10
the addition of organic litter (Fig. 3) seems to be directly linked to the biodegradation activity 11
of microorganisms. The increase of CO2 concentration in the mesocosm atmosphere during the 12
period P5, from 0.137% to 0.556% (Fig. 3), is another consequence of this high carbon 13
mineralization activity. 14
The mineralization of organic matter by microbial metabolism is conditioned by the 15
accessibility of terminal electron acceptors (TEA). Oxygen is the most efficient TEA available 16
in the environment, and carbon mineralization consumes oxygen. Microbial respiration 17
impacted the dissolved oxygen content and indirectly the redox potential, which decreased after 18
the addition of organic matter (P6-P8). The reductive process, and hence the Eh decrease, are 19
generally driven by the consumption/oxidation of DOC coupled with the reduction of the 20
successive TEA’s by the bacterial community (Weber et al., 2006). Here, dissolved oxygen also 21
appeared to be determined by depth and by water saturation, even if it was not visible at level 22
H3, alternately saturated and unsaturated. 23
Soil moisture and oxygen availability can influence the nitrogen cycle (Silver et al., 2001; 24
Rubol et al., 2013). Cycles of nitrate disappearance at level H3 may be interpreted as 25
28
denitrification and demonstrate at least that the nitrogen cycle was strongly affected by water 1
saturation, the Eh value in level H3 being close to the limit allowing denitrification (713 mV, 2
Weber et al., 2006). During denitrification, nitrate and nitrite are reduced to N2 gas by 3
heterotrophic denitrifiers in the presence of OM as electron donor. Even though no significant 4
variation of N2 was observed in the atmosphere, the production of nitrite during each wet period 5
and the variation of alkalinity can be interpreted as the result of denitrification. Nevertheless 6
other metabolic pathways could be responsible of the observed nitrate decrease, namely 7
dissimilatory nitrate reduction to ammonium (DNRA). DNRA activity is favored by 8
temperatures superior to 10°C and is less sensitive than denitrification to variations of nitrate 9
concentrations as it can be sustained at lower concentrations (Roberts et al., 2014). 10
Additionally, DNRA activity is also less affected by the inhibitory effects of O2 ( and 11
equilibrium between denitrification and DNRA seems to be mainly driven by bioavailable 12
carbon (Fazzolari et al., 1998; Hardison et al., 2015). The large amounts of OM that have been 13
initially quantified and subsequently added to the experiments could plead in favor of DNRA 14
prevalence; nevertheless the bioavailability of this carbon source for the reduction of nitrate is 15
still unknown. Moreover, DNRA may outcompete denitrification with other sources of electron 16
donors, namely Fe II and sulfide (Roberts et al., 2014), but the present experiment displayed 17
Eh and DOs that were not compatible with the presence of such reduced species (i.e. DO > 50 18
µM and Eh > 250 mV). The amounts of ammonium detected during the experiment in the lower 19
part of the mesocosm could be attributed to ammonification processes or DNRA. Nevertheless, 20
in the saturated level (H4) and in the leachate, the rapid disappearance of nitrate concomitant 21
with the appearance of nitrite and the increase in ammonium concentration seem more logically 22
linked to DNRA activity. The fact that these quantities (few µM) does not match with the loss 23
of nitrate (few hundreds µM) is however not a proof of low DNRA activity because ammonium 24
can possibly be consumed by other metabolic pathways. For instance, it can be assimilated to 25
29
form biomass or oxidized into N2 by Anammox and/or Feammox dissimilative processes with 1
nitrite and Fe III respectively (Francis et al., 2007). The coupling of DNRA and Anammox 2
metabolic pathways is known to be difficult to discriminate with denitrification processes in 3
terms of mass balance and is possibly responsible of frequent false interpretations in that matter 4
(Francis et al., 2007). As a result, it appears difficult to state which of these two metabolic 5
pathways was predominant in the mesocosm during our study. 6
The increase of nitrate concentration during dry periods at level H3 may have been the result
7
of nitrification thanks to ammonium production from DNRA providing a source of NH4+ for
8
nitrifying bacteria (Burgin and Hamilton, 2007). However, the small amount of NH4+ in this
9
level during the saturation periods, and the absence of nitrite simultaneously with the increase 10
in nitrates during the dry periods, suggested that nitrification was not the main process inducing 11
the increase of nitrate when soil was desaturated. The soil water from the surface of the 12
mesocosm was rich in NO3- and the transport of nitrate down towards the H3 level may explain 13
this phenomenon.
14
Some nitroaromatic compounds, and particularly 1,3-Dinitrobenzene, had been detected
15
previously on the “Place-à-Gaz” site (Bausinger et al., 2007), and in another former World
16
War I ammunition destruction facility (Bausinger and Preuβ, 2005). Nitroaromatic compounds
17
on this site (range 1 mg.kg-1) were less concentrated than soil from ammunition plants (range 1 18
g.kg-1) resulting from the recent incineration of explosives (Kalderis et al., 2011). Even after 19
more than 80 years, the nitroaromatic concentrations in soil from the “Place-à-Gaz” highlight 20
the persistence of nitroaromatic explosives and their metabolites in the environment. However, 21
no nitroaromatic compound was detected in the soil or solution water of the mesocosm (SM.2
22
and SM.3). This observation may be caused to the complete degradation of nitroaromatic
23
compounds. Several studies have shown that microbial aerobic degradation of nitroaromatic
24
compounds releases nitrogen as nitrite into the environment (Marvin-Sikkema and de Bont,
30
1994; Spain, 1995). The total degradation of nitroaromatic compounds to inorganic forms
1
was potentially an important source of nitrogen in this type of site. The organic litter was also
2
rich in leachable NO3- (Tab. 2), arising mainly from the decomposition of plant OM. The 3
increase in NO3- in level H2 following the addition of organic matter highlighted the supply of 4
NO3- by the forest litter. 5
4.2. Behavior of metals and metalloids, and possible evolution of their mobility in the
6
context of changing site conditions
7
In line with the in situ observations of the “Place-à-Gaz” soil (Bausinger et al., 2007; Thouin 8
et al., 2016), Zn and As were the most mobile metal(oid)s in the mesocosm. Zn concentration 9
in the soil water showed a time related evolution with a delay in maximum concentration with 10
depth. This particular evolution, also observed for Ca2+ and Mg2+ (SM.5) concentrations and 11
EC, can be attributed to the leaching of Zn which was mobile in the pH range of 5–6. The initial 12
concentrations of Zn at each depth and in the leachate were fairly similar and mobilization of 13
Zn at the beginning of the experiment was thus comparable throughout the soil profile. 14
However, after several periods, Zn mobility was greater in the saturated soil. The amount of Zn 15
leached in saturated soils is commonly explained by a pH decreased cationic exchange capacity 16
releasing the adsorbed Zn. However, in this case, the stability of pH during the experiment and 17
throughout the soil profile suggests that desorption of easily exchangeable Zn is not the only 18
phenomenon driving Zn mobility in water. Previous studies (Bausinger et al., 2007, Thouin et 19
al., 2016) showed that the main carrier of Zn was an amorphous material that also contained 20
large amounts of As, Pb, Cu and Fe. The dissolution of this amorphous material, whose 21
conditions of stability are unknown, may release enough Zn to explain the increase in Zn 22
concentration in the saturated soil. However, the other metals present in this amorphous phase 23
were not very abundant in the solution. 24
31
The pH of the soil water may explain the low solubility of Pb and Cu, as Bausinger et al. (2007) 1
have shown that Pb and Cu were not mobile in the soil of the site at pH 5–6. Cu and Pb were 2
probably adsorbed on soil grain surfaces or precipitated with the other ions present in solution. 3
The oxidation-reduction potential (Eh) and pH conditions of the experiment were favorable to 4
the precipitation of ferric oxides like hematite or magnetite or hydrous ferric oxides (HFO) like 5
ferrihydrite or goethite. The precipitation of HFO allows the sorption of Cu and Pb onto their 6
surface (Swallow et al., 1980; Morin et al., 2001), and would explain their low solubility. Fe 7
seemed to be the metal most impacted by dry/wet cycles, but the trend was not very clear even 8
if the behavior of Fe in the top soil seems to be different from that in the saturated levels. In 9
addition, the Fe concentration trends showed that Fe mobility decreased significantly in the 10
unsaturated soil and increased significantly in soil levels that were alternately or permanently 11
saturated. The addition of organic litter enhanced these trends and DOC seemed to have a 12
greater impact on Fe mobility than dry/wet cycles. Moreover, it was probable that iron analyzed 13
in soil water and in the leachate was particulate or colloidal. The study of the colloidal fraction 14
and the iron speciation could help to explain the behavior of iron in this specific polluted 15
material. 16
Together with Zn, As was the major metal(loid) present in the soil water, with concentrations 17
up to 800 times higher than the maximum level of 10 µg L-1 recommended by the WHO (2011). 18
However, As behaved differently from Zn, with higher concentration at the top of the mesocosm 19
and immobilization with increasing depth. Previous studies describing As behavior during 20
redox oscillation (Parsons et al., 2013, Couture et al., 2015) have shown that the successive 21
cycles of oxidizing and reducing conditions (between -300 and +500 mV) affect As mobility in 22
relation with As speciation and sorption onto HFO. During oxidizing cycles, As is strongly 23
associated with HFO; during reducing periods, the combination of reduction of Fe oxides and 24
microbial reduction of As V to As III raises As solubility (Couture et al., 2015). Under the 25
32
conditions of this experiment, dry/wet cycling did not induce reducing conditions, even in the 1
permanently saturated level. Moreover, As V was always the major As species in solution and 2
presented an evolution similar to total As. However, the decrease in As V concentration with 3
depth could be induced by the precipitation of HFO or iron oxide from Fe leached by the 4
dissolution of the amorphous phase in the saturated level, as As V is more readily adsorbed 5
onto HFO than As III at pH 5–6 (Dixit and Hering, 2003). Between H4 and L, As V 6
concentration decreased by about 50%(Fig. 6). This very large decrease may be linked to the 7
precipitation of HFO or the growth of a biofilm from the soil, perhaps on the geotextile 8
membrane. The precipitation of secondary arsenates as an explanation for the immobilization 9
of As V in solution cannot be excluded. 10
As III seems to be affected by the wet/dry cycles: the higher As III concentration at the end of 11
wet periods at all levels (Fig. 7) was probably linked to less oxygenated water and decreased 12
ORP. Previous studies demonstrated the importance of iron and As V reduction by 13
microorganisms on the mobility of As in groundwaters (Islam, 2005). Also, the proportion of 14
As III in water increased with depth, supporting the fact that As III behavior may be by soil 15
saturation. Biological As III oxidation activity had been detected previously in the soil of the 16
“Place-à-Gaz” site under unsaturated conditions (Thouin et al., 2016), thus bacteria involved in 17
the cycle of arsenic were present in the mesocosm. The hypothesis of microbial reduction of 18
As V cannot be ruled out, whereas desorption of As III might be involved in the observed 19
evolution of dissolved As speciation (Tufano et al., 2008). 20
The excess of DOC after the addition of bioavailable OM promoted microbial respiration and 21
Eh drop, but also enhanced Fe mobility. This process should have enhanced As mobility, but 22
in fact immobilization of As, mainly as As V, was observed over the different depths. The 23
addition of fresh organic matter may have contributed by providing adsorption sites enough to 24
trap some As V. It also appears that more dimethylarsine was produced after the input of OM. 25
33
However, despite the important concentration of As in soil, arsine volatilization were lower 1
than As fluxes observed earlier in wetland (160-540 ng.m-2.d-1 ; Vriens et al., 2014) paddy soil 2
(Bangladeshi paddy soil 65 ng.m-2.d-1, Spain paddy soil 12 ng.m-2.d-1 ; Mestrot et al., 2011) or 3
amended mine soil (Moreno-Jiménez et al., 2013). The volatilization of arsines and by As 4
methylation seems to be limited by the sub-oxic conditions and was too low to explain As 5
decrease in solution. However, increase of dimethylarsine flux after OM addition confirmed 6
the influence of OM on the activity of As transforming microbes in this soil (Huang et al., 7
2011). The addition of OM also induced an increase in As III concentration in the saturated soil 8
(Fig. 6 and Fig. 7).The organic carbon concentration influences the rate of microbial As III 9
oxidation in soils, a decrease in oxidation rate being observed beyond 0.08 g.L-1 of organic 10
carbon (Lescure et al., 2016). 11
Among the soluble As species, DPAA (SM.2) and three unidentified species were also detected 12
(Fig. 7). The sum of these compounds and As III and As V was approximately equal to total 13
As, indicating that no other main As species was present. It also appears that the unidentified 14
species were not in ionic form, since the sum of these species and As III (Fig. 7) was similar to 15
the As III-like species concentration given by anionic resin separation (Fig. 6). DPAA, the 16
hydrolysis product of the chemical warfare agent (Clark I and Clark II), was detected in low 17
concentration at the outlet of the mesocosm. This compound was identified in water from this 18
contaminated soil for the first time, since aromatic arsenicals had not been detected previously 19
on the site (Bausinger et al., 2007). The bacterial degradation pathway of DPAA in soil may 20
produce phenylarsonic acid (PAA; Harada et al., 2010) or phenylarsine oxide (PAO) in less 21
oxidizing conditions (Daus et al., 2010). DPAA was not detected in the deeper zones of 22
groundwater contaminated by a former ammunition deposit and chemical warfare agent filling 23
station (Daus et al., 2010). This absence was concomitant with occurrence of PAO and with As 24
III increase, while PAA was detected all along the depth profile. In our experiment, with similar 25