This paper is available online free of all access charges (see http://jxb.oxfordjournals.org/open_access.html for further details)
RESEARCH PAPER
Malate as a key carbon source of leaf dark-respired CO
2
across different environmental conditions in potato plants
Marco M. Lehmann1,2,*, Katja T. Rinne1, Carola Blessing2, Rolf T. W. Siegwolf1, Nina Buchmann2 and Roland A. Werner21 Laboratory of Atmospheric Chemistry, Paul Scherrer Institute (PSI), CH-5232 Villigen, Switzerland 2 Institute of Agricultural Sciences, ETH Zurich, Universitaetsstr. 2, CH-8092 Zurich, Switzerland
* To whom correspondence should be addressed. E-mail: [email protected]
Received 28 January 2015; Revised 30 April 2015; Accepted 6 May 2015 Editor: Howard Griffiths
Abstract
Dissimilation of carbon sources during plant respiration in support of metabolic processes results in the continu-ous release of CO2. The carbon isotopic composition of leaf dark-respired CO2 (i.e. δ13CR) shows daily enrichments up to 14.8‰ under different environmental conditions. However, the reasons for this 13C enrichment in leaf dark-respired CO2 are not fully understood, since daily changes in δ13C of putative leaf respiratory carbon sources (δ13CRS) are not yet clear. Thus, we exposed potato plants (Solanum tuberosum) to different temperature and soil moisture treatments. We determined δ13C
R with an in-tube incubation technique and δ13CRS with compound-specific isotope analysis during a daily cycle. The highest δ13C
RS values were found in the organic acid malate under different environ-mental conditions, showing less negative values compared to δ13C
R (up to 5.2‰) and compared to δ13CRS of soluble carbohydrates, citrate and starch (up to 8.8‰). Moreover, linear relationships between δ13C
R and δ13CRS among dif-ferent putative carbon sources were strongest for malate during daytime (r2=0.69, P≤0.001) and nighttime (r2=0.36,
P≤0.001) under all environmental conditions. A multiple linear regression analysis revealed δ13C
RS of malate as the most important carbon source influencing δ13C
R. Thus, our results strongly indicate malate as a key carbon source of 13C enriched dark-respired CO
2 in potato plants, probably driven by an anapleurotic flux replenishing intermediates of the Krebs cycle.
Key words: Compound-specific isotope analysis (CSIA), drought, organic acids, plant respiration, stable carbon isotopes,
sugars, temperature, tricarboxylic acid (TCA) cycle.
Introduction
The investigation of plant respiration as a major process in plant biochemistry has expanded our understanding of bon cycling in autotrophic organisms. Plants dissimilate car-bon sources for the production of intermediates and reducing
equivalents in support of metabolic processes, thereby contin-uously releasing CO2 via plant respiration (Hopkins, 2006).
Leaf-respired CO2 is mainly derived from oxidative
decarbox-ylation reactions catalysed by enzymes from the Krebs cycle
This is an Open Access article distributed under the terms of the Creative Commons Attribution License (http://creativecommons.org/licenses/by/3.0/), which permits unrestricted reuse, distribution, and reproduction in any medium, provided the original work is properly cited.
© The Author 2015. Published by Oxford University Press on behalf of the Society for Experimental Biology. Abbreviations: δ13C
R, carbon isotopic composition of leaf dark-respired CO2; δ13CRS, carbon isotopic composition of putative leaf respiratory carbon sources; An, net assimilation rate; Ci, intercellular CO2 concentration; CSIA, compound-specific isotope analysis; gs, stomatal conductance; HPLC, high performance liquid chromatography; KC, Krebs cycle; LEDR, light-enhanced dark respiration; ME, malic enzyme; OAA, oxaloacetate; PDH, pyruvate dehydrogenase; PEPC, phosphoenolpyruvate carboxylase; SPS, sucrose phosphate synthase; SWC, volumetric soil water content.
(KC) and from interacting anabolic and catabolic reactions (Voet and Voet, 2011).
Using stable isotopes, the pathway of carbon can be traced from photosynthetic carbon fixation to respiratory carbon loss. On the one hand, C3 plants discriminate heavily against 13C due to photosynthetic isotope fractionation, leading
to general 13C depletion in plant biomass of about 20‰ in
comparison to atmospheric CO2 (Farquhar et al., 1989). The
exact magnitude of photosynthetic carbon isotope discrimi-nation depends on the intercellular CO2 concentration (Ci) in
the substomatal cavity, which is regulated by other physiolog-ical parameters such as net assimilation rate (An) and
stoma-tal conductance (gs). Environmental conditions such as light,
temperature, soil moisture, and air humidity will influence these parameters and with them the photosynthetic carbon isotope discrimination. On the other hand, the carbon iso-topic composition of leaf dark-respired CO2 (i.e. δ13CR) has
clearly been shown to be less negative than leaf metabolites in several plant species (Ghashghaie et al., 2003; Bowling et al., 2008; Werner and Gessler, 2011; Ghashghaie and Badeck, 2014). In a daily cycle, leaf dark-respired CO2 follows a
pro-gressive 13C enrichment during the day and a gradual 13C
depletion during the course of the night (Hymus et al., 2005;
Prater et al., 2006), resulting in a strong temporal variability of up to 14.8‰ (Barbour et al., 2007; Werner et al., 2009;
Wegener et al., 2010), which differs among functional groups (Priault et al., 2009; Werner et al., 2009).
δ13C
R is thereby linked to the carbon isotopic
composi-tion of putative leaf respiratory carbon sources (i.e. δ13C RS)
such as carbohydrates (soluble mono- and di-saccharides, and starch) and organic acids. Previous studies showed that environmental drivers such as temperature and soil moisture influence δ13C
R and δ13CRS. More negative δ13CR values with
increasing temperature have been observed with short-term changes in leaf temperature during darkness in Phaseolus
vulgaris (Tcherkez et al., 2003), while long-term effects of
higher temperatures on δ13C
R and δ13CRS have not yet been
investigated under controlled conditions. Other studies have demonstrated less negative δ13C
R and δ13CRS values under
dry conditions compared to those under wet conditions (Duranceau et al., 1999; Ghashghaie et al., 2001). Similar observations were made in field experiments (Sun et al., 2009;
Dubbert et al., 2012). Conversely, more negative δ13C R
val-ues have been found under dry conditions for Mediterranean trees and herbs such as Quercus ilex and Tuberaria guttata compared to those under wet conditions (Unger et al., 2010), which have been explained with accompanied increases in temperatures and vapour pressure deficit. Nevertheless, the combined effects of temperature and soil moisture on δ13C
R
and δ13C
RS under controlled conditions have yet to be tested.
Moreover, δ13C
R is determined by various
post-photo-synthetic carbon isotope fractionation processes at pivotal branching points in respiratory pathways, carbon isotope effects on enzymatic reactions, and changes in respiratory substrates (for a detailed review see Werner and Gessler, 2011). The 13C enrichment in leaf dark-respired CO
2 itself
is thought to be a result of fragmentation fractionation pro-cesses based on heterogeneous intramolecular carbon isotope
distribution in respiratory carbon sources (Tcherkez et al., 2004). For instance, C-3 and C-4 positions of glucose are known to be enriched in 13C compared to the other
mole-cule positions due to an isotope effect of the aldolase reac-tion (Rossmann et al., 1991; Gleixner and Schmidt, 1997). Breakdown of glucose during glycolysis produces pyruvate with a 13C enriched C-1 position (former C-3 and C-4
posi-tions of glucose). Thereafter, the pyruvate dehydrogenase reaction (PDH) releases the C-1 position as 13C enriched CO
2,
whereas the more 13C depleted acetyl-CoA residue is used
in the KC (Priault et al., 2009; Werner and Gessler, 2011). Thus, a PDH dominated respiratory pathway may lead to 13C
enrichment in leaf dark-respired CO2.
However, the knowledge about δ13C
R is often based on
light-acclimated leaves, which have been transferred into darkness to allow respiratory measurements. This approach holds an unpreventable bias known as ‘light-enhanced dark respiration’ (LEDR), which needs to be taken into account when interpreting daytime δ13C
R values. LEDR is a
short-term light-dark transition period, describing an increase in the amount of leaf dark-respired CO2 shortly upon
dark-ening for about 20 min, which depends on light intensity (Atkin et al., 1998). On the one hand, LEDR may be influ-enced by reassembly of the KC, which is thought to be only partially active under light conditions (Tcherkez et al., 2005;
Sweetlove et al., 2010; Werner and Gessler, 2011; Werner et al., 2011). On the other hand, LEDR may be driven by a breakdown of a light-accumulated malate pool, causing
13C-enriched leaf dark-respired CO
2 (Barbour et al., 2007;
Gessler et al., 2009; Werner et al., 2009; Barbour et al., 2011;
Werner and Gessler, 2011). Malate itself is also known to be 13C enriched compared to other carbon sources (Gleixner
et al., 1998; Ghashghaie et al., 2001). The 13C enrichment
in malate was attributed to an anapleurotic flux via the phosphoenolpyruvate carboxylase reaction (PEPC), which fixes 13C-enriched hydrogen carbonate and replenishes KC
intermediates (Melzer and O’Leary, 1987; Savidge and Blair, 2004). Thus, a possible breakdown of malate by the mito-chondrial malic enzyme reaction, or within the KC, may influence δ13C
R (Barbour et al., 2007; Werner et al., 2011).
In addition, plants may also use to a certain extent more complex carbon sources such as lipids and proteins under severe environmental conditions or under prolonged dark-ness (Tcherkez et al., 2003; Usadel et al., 2008). However, the driving processes, the respiratory carbon sources, and the mechanisms causing changes in δ13C
R during day and night
are not fully resolved thus far.
Hence, with this study we intend to assess two major research questions. What causes the high daily variations in
δ13C
R? How are δ13CR and δ13CRS influenced by temperature
and soil moisture conditions? Our main objectives were (i) to analyse the relationship between δ13C
R and δ13CRS values and
(ii) to determine changes in δ13C
R and δ13CRS values, as well as
in concentrations of the putative carbon sources under differ-ent environmdiffer-ental conditions. Therefore, we exposed potato plants to different controlled temperature and soil moisture conditions and measured δ13C
R with an in-tube incubation
technique, as well as δ13C
carbohydrates, organic acids and starch from leaves with compound specific isotope analysis (CSIA) on a daily basis.
Materials and methods
Plant materialPotato plants (Solanum tuberosum L. cv. Annabell) were grown from tubers of the same size in 5 l pots filled with bark humus soil (Ökohum, Herrenhof, Switzerland) in a greenhouse, with average temperatures of 20/16°C and vapour pressure deficits (VPD) of about 0.9/0.4 kPa (day/night). The plants were exposed to a 16 h daylight period supplemented by 400 W sodium-lamps (Powertone Son-T Plus, Philips, Amsterdam, Netherlands). Forty days after planting, plants were transferred into walk-in climate chambers for acclimati-zation for 2 weeks. The 16 h daylight in the climate chambers had an averaged photosynthetic photon flux density of ~400 µmol m-2 s-1 at
leaf level, thus plants were not fully light-saturated. Before the treat-ment period, soil water status was optimal for at least 3 d after water-ing, while an individual plant consumed about 300 ml water per day. 50 ml of a 0.4% fertilizer solution (v/v, Gesal, Zürich, Switzerland) was applied twice to all plants during the whole experiment of 70 d.
Treatments were applied during the last 15 d of the experiment. Plants were exposed to high temperature (Thigh) of 28/23°C (day/
night) and low temperature conditions (Tlow) of 22/17°C, at a VPD
of about 0.9/0.35 kPa for both temperature treatments. Three cli-mate chambers were used for replication of each temperature treat-ment. Within each climate chamber there were two soil-moisture treatments with nine plants each. Dry soil moisture conditions were kept constantly at 50–60% of the daily water consumption of each individual plant, determined by weighing the entire pots. Plants under wet conditions were kept at 100%.
The final sampling period lasted 32 h during the last 2 d of the experiment, when dry soil conditions were established for both tem-perature treatments. Sampling was done on a daily basis every 2 h (nighttime) or 4 h (daytime). During sampling, individual plants had 3–6 ranks, with about four fully developed leaves per rank. Always the third-last fully developed leaf per rank was sampled at all points in time, but within 24 h only one sample was taken from each individ-ual plant to avoid any stress response induced by sampling. Sampled leaf material was immediately frozen in liquid nitrogen and stored at −80°C. Subsequently, the leaf material was freeze-dried and milled to powder by a steel ball mill (MM200, Retsch, Haan, Germany) for all further isotopic and biochemical analyses. In addition to leaf sampling, air CO2 samples from all six climate chambers were
col-lected at the same points in time during the sampling period, show-ing a mean δ13C value of −12.2‰ and typical daily variations of SD
≤1.4‰; no differences between temperature treatments (P≥0.05) and points in time (P≥0.05; linear mixed effects model) were observed during the daily cycle.
Physiological measurements and biomass determination
Several leaf physiological parameters were determined with an infrared gas analyser (LI-6400, LI-COR, Lincoln, Nebraska, USA), including net assimilation rate (An), intercellular CO2 concentration
(Ci), and stomatal conductance (gs). All measurements were taken in the last 4 h of the daylight phase. To monitor volumetric soil water content (SWC), up to three soil moisture sensors (EC-5 and log-ger Em5b, Decagon Devices, Pullman, USA) were installed for each treatment. Shortly after the sampling period, total plant biomass was harvested, oven-dried (at 60°C), and weighed. The fresh tuber weight and tuber count (number of potatoes) were determined.
Carbon isotope and concentration analyses
δ13C values are expressed as described by Craig (1957) and modified
by Coplen (2011):
δ13
sample standard
C ( )‰ =R /R −1
where Rsample is the 13C/12C ratio of the sample material and Rstandard
is that of the international standard VPDB (Vienna Pee Dee Belemnite).
Determination of δ13C R
The in-tube incubation technique was used for the collection of leaf dark-respired CO2 during daytime and nighttime (Werner et al., 2007). A leaf was placed in a 12 ml gas-tight exetainer (Labco, Lampeter, UK), which was immediately darkened with a lightproof casing to trigger leaf dark respiration. The tube was then flushed for 1 min with synthetic air until a CO2-free atmosphere was
estab-lished, which was monitored with an infrared gas analyser (LI-6262, LI-COR, Lincoln, Nebraska, USA). After an incubation time of 3 min in darkness, an aliquot of dark-respired CO2 was transferred
with a gas-tight syringe into a new exetainer filled with dry N2. δ13CR values were determined with an IRMS, using a modified Gasbench II (Thermo Fisher, Bremen, Germany) connected to a Deltaplus
XP-IRMS, similar to Zeeman et al. (2008). The transfer of the CO2
sam-ple into a new exetainer, as well as the IRMS measuring procedure, were both tested with air of known δ13C of CO
2 to ensure no
iso-tope fractionation had occurred. Measurement precision of a qual-ity control standard (three standards per 24 samples) was SD≤0.1‰.
Determination of δ13C in bulk leaves and leaf starch
Extraction of leaf starch was performed as described in previous stud-ies (Wanek et al., 2001; Goettlicher et al., 2006; Richter et al., 2009). Leaf starch was isolated from 50 mg leaf material with methanol/ chloroform/water (MCW, 12:5:3, v/v/v) at 70°C for 30 min. Samples were centrifuged (10 000 ×g, 2 min) and supernatants removed, while the leaf-starch-containing pellets were washed with MCW and deionized water and dried at room temperature (RT). Pellets were then re-suspended in water and boiled at 99°C for 15 min to facili-tate starch gelatinization. Subsequently, leaf starch was enzymati-cally digested with α-amylase (EC 3.2.1.1, Sigma-Aldrich, Buchs, Switzerland) at 85°C for 2 h, and cleaned with centrifugation filters to remove enzymes (Vivaspin, Sartorius, Göttingen, Germany). To determine δ13C of bulk leaves (δ13C
leaf) and starch, an elemental ana-lyser (Flash EA 1112 Series) coupled to a DeltaplusXP-IRMS was
used (both Thermo Fisher, Bremen, Germany; Werner et al., 1999). Measurements of samples, blanks, and reference material followed the identical treatment principle described by Werner and Brand (2001). The long-term precision of a quality control standard for all sequences was SD≤0.12‰.
Isotopic and concentration analysis of soluble carbohydrates and organic acids
Water-soluble compounds were extracted from 100 mg leaf mate-rial with water at 85°C for 30 min, similar to Streit et al. (2013). Subsequently, soluble carbohydrates and organic acids were separated by ion-exchange chromatography (Wanek et al., 2001;
Goettlicher et al., 2006; Richter et al., 2009), using Dowex 50WX8 in H+-form and Dowex 1X8 in NaCOO--form (both 100–200 mesh,
Sigma-Aldrich, Buchs, Switzerland). To avoid clogging of the HPLC column by polyphenols, all samples designated for carbohydrate analyses were filtered with 100 mg Sep-Pak C18 Vac RC Cartridges (Waters AG, Milford, Massachusetts, USA). Finally, all carbohy-drate and organic acid samples were cleaned with 0.45 µm PTFE syringe filter (Infochroma AG, Zug, Switzerland) prior to HPLC measurements.
To determine δ13C
RS values and the concentrations of soluble carbo-hydrates and organic acids, a HPLC-IRMS system consisting of a high performance liquid chromatograph coupled to a Delta V Advantage IRMS by a LC IsoLink (all Thermo Fisher, Bremen, Germany)
was used according to Krummen et al. (2004). Carbohydrates were separated on a 3 × 150 mm anion-exchange column CarboPac PA20 (Dionex, Olten, Switzerland) using 2 mM NaOH as the mobile phase and a flow speed of 250 µl min-1 (Boschker et al., 2008; Rinne et al., 2012). Low column temperature of 20°C was used to prevent isomeri-zation of hexoses (Rinne et al., 2012). This enabled chromatographic separation for sucrose and glucose, but fructose δ13C
RS and concen-tration measurements were affected by partial co-elution of fructose with other compounds. To correct δ13C
RS values and to calculate con-centrations from the peak areas, interspersed standard solutions in a concentration range of 20–180 ng C µl-1 were measured within each
sequence. The measurement precision of δ13C
RS values in all carbohy-drate standards was SD<0.5‰. Below a concentration of 60 ng C µl-1,
the precision of fructose standards was lower for certain batches, and therefore these results were excluded.
Organic acids were separated on a 4.6 × 300 mm Allure Organic Acids column (Restek, Bellefonte, USA) at 5–10°C. The mobile phase was a 100 mM monopotassium phosphate buffer (pH 3) with a flow speed of 500 μl min-1 (Hettmann et al., 2005). The measurement
precision of δ13C in organic acid standards was SD<0.4‰. Low
cit-rate concentrations from Tlow samples (<45 ng C µl-1) impeded the
analytical accuracy of the δ13C
RS values, therefore these samples were not taken into account.
All purification steps were verified for each batch of 24 samples using 2.5 mg standard solutions of known δ13C (by EA-IRMS) for all
carbohydrates and organic acids measured in this study. Differences between δ13C values before and after purification were generally
≤0.2‰, indicating no significant isotope fractionation for any stand-ard. Mean recovery was 101 ± 6% for fructose, 96 ± 6% for glucose, 89 ± 3% for sucrose, 91 ± 3% for malate, and 86 ± 3% for citrate.
Determination of starch concentration
For the extraction of leaf starch for concentration analyses we used a modified method of Critchley et al. (2001). Leaf starch was iso-lated with 1.12 M perchloric acid from 50 mg leaf material at RT for 15 min and centrifuged (10 min, 3000 ×g, 4°C). The supernatant was removed and the leaf-starch-containing pellet was washed free from pigments with deionized water and ethanol. Pellets were then dried at RT, resuspended in water, and gelatinized. Subsequently, starch samples were enzymatically hydrolysed to glucose for 2 h at 37°C with a solution mix of α-amylase (EC 3.2.1.1, Sigma-Aldrich, Buchs, Switzerland) and α-amyloglucosidase (EC 3.2.1.3, Roche, Rotkreuz, Switzerland) in 220 mM sodium acetate buffer (pH 4.8). The glucose concentration was determined at 340 nm with a 96-well microplate reader (EL×800, BioTek, Luzern, Switzerland) using a coupled enzymatic reaction (Hoch et al., 2002). Potato starch was used as a standard. Glucose concentrations are expressed in molar-ity of starch monomers.
Data analysis
R version 3.0.2 (R Core Team, 2013) was used for (multiple) lin-ear regression analyses and linlin-ear mixed effects models (R package nlme). Models included fixed effects (temperature, soil moisture, sampling time) and random effects (climate chambers, individual plants). If applicable, δ13C values and concentrations were
logarith-mically transformed to ensure normal distribution. For the best-fit combination of the multiple linear regression analysis, variables were excluded if P≥0.05.
Results
Physiological parameters and biomass
Physiological parameters (An, Ci, gs, and SWC) of potato plants
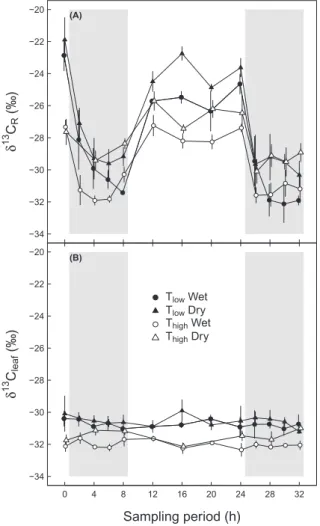
exposed to four different treatments were monitored during the treatment period of 15 d (Fig. 1). The net assimilation rate
declined during the treatment period under all four treatments (Fig. 1A). During the sampling period (Fig. 1A, day 15), An
was significantly influenced by soil moisture (P=0.02, Table 1), with lowest values (1.9 µmol m-2 s-1) under T
high and dry
condi-tions, and highest values (5.4 µmol m-2 s-1) under T
low and wet
conditions, whereas the temperature influence on An was not
significant (P=0.07, Table 1) but tended to cause lower An
val-ues under Thigh than under Tlow under both soil moisture
con-ditions. The intercellular CO2 concentration increased during
the treatment period for all four treatments (Fig. 1B). During the sampling period (Fig. 1B, day 15), Ci was independently
influenced by temperature (P=0.012, Table 1) and soil moisture (P=0.01, Table 1), with lowest Ci (247.5 µmol mol-1) under Tlow
and dry conditions and highest Ci (332.8 µmol mol-1) under Thigh
and wet conditions. Stomatal conductance during the treat-ment period was lower under dry treattreat-ments compared to those under wet treatments (Fig. 1C). During the sampling period (Fig. 1C, day 15), gs was significantly influenced by soil
mois-ture (P≤0.001, Table 1), with lowest gs (about 0.06 mol m-2 s-1)
in plants of both dry treatments and highest gs (0.22 mol m-2
s-1) in plants under T
high and wet conditions, whereas the
tem-perature influence under wet conditions tended to cause higher gs values under Thigh than under Tlow. The volumetric soil water
content was lower under dry conditions (~7–14%) compared to wet conditions (23–27.5%) for the last 9 d of the treatment period (Fig. 1D), including the sampling period (Fig. 1D, day 15), where SWC was significantly affected only by soil moisture treatments (P=0.002, Table 1). Generally, no significant inter-actions between temperature and soil moisture were observed for any parameter (Table 1). In addition, only soil moisture treatments affected plant biomass (P=0.008, Table 1) and tuber weight (P=0.023, Table 1) taken shortly after the sampling period, independent of temperature treatments. Highest values tended to be under Tlow and wet conditions and lowest values
under Thigh and dry conditions (Tables 1, 2), indicating different
stress levels created by the four treatments.
Carbon isotopes in potato leaves
Daily cycles of δ13CR and δ13Cleaf
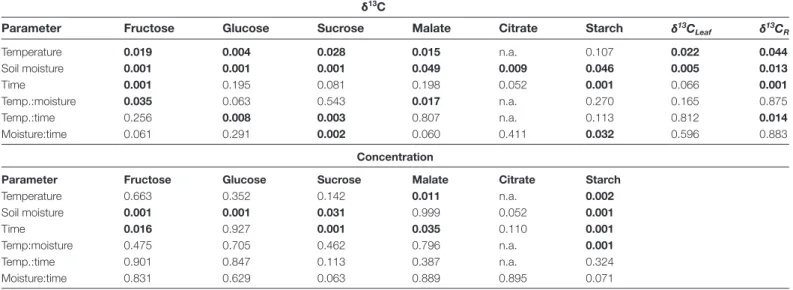
δ13C values of leaf dark-respired CO
2 (δ13CR) varied
signifi-cantly over time (P≤0.001, Table 3) with values in the range of −21.9‰ and −32‰, declining strongly during nighttime and increasing again during the daytime for all four treat-ments (Fig. 2A). An interaction between temperature and time showed that the influence of temperature differed with time (P=0.014, Table 3). Daytime δ13C
R values under Thigh were up to
4.7‰ more negative compared to those under Tlow,
independ-ent of soil moisture conditions, whereas nighttime δ13C
R values
of both temperature treatments were very similar, particularly in the second night. Dry soil moisture conditions caused less negative δ13C
R values compared to those under wet conditions
during the daily cycle (P=0.013, Table 3), with a maximum dif-ference of 2.7‰, independent of temperature treatments. On average, the difference between daytime and nighttime δ13C
R
values was highest under Tlow and wet conditions, at 5.7‰, and
The bulk leaf material reflects all environmental conditions experienced during the whole growth period. δ13C
leaf of all
treatments showed no changes during the sampling period and no interactions between treatments and time (Fig. 2B;
Table 3). Under Thigh, δ13Cleaf values were up to 2.2‰ more
negative compared to those under Tlow, resulting in a
signifi-cant temperature effect independent of soil moisture condi-tions (P=0.022, Table 3). Similarly, soil moisture showed a
significant effect on δ13C
leaf (P=0.005, Table 3),
independ-ent of temperature treatmindepend-ents, with values up to 1.1‰ less negative under dry than under wet conditions mainly during nighttime.
δ13C
RS of soluble carbohydrates, organic acids, and starch
Highest δ13C values in putative leaf respiratory carbon
sources (δ13C
RS) were found in the organic acid malate, while ● ● ● ● ● ● ● ● ● ● ● ● 0 2 4 6 8 10 (A) An (µ mol m −2 s −1 ) ● ● ● ● ● ● ● ● ● ● ● ● 150 200 250 300 350 (B) Ci (µ mol mol −1 ) ● ● ● ● ● ● ● ● ● ● ● ● 0.00 0.05 0.10 0.15 0.20 0.25 (C) gs (mol m −2 s −1 ) ● ● ● ● ● ● ● ● ● ● ● ● ● ● ● ● ● ● ● ● ● ● ● ● ● ● ● ● ● ● ● ● ● ● ● ● ● ● ● ● ● ● ● ● ● ● ● ● 0 3 6 9 12 15 0.0 0.1 0.2 0.3 ● Tlow Wet Tlow Dry Thigh Wet Thigh Dry (D) SWC (m 3 m −3 ) Treatment period (d)
Fig. 1. Physiological parameters under different environmental conditions
during the treatment period: (A) net assimilation rate (An, µmol m-2 s-1), (B)
intercellular CO2 concentration (Ci, µmol mol-1), (C) stomatal conductance
(gs, mol m-2 s-1), (D) volumetric soil water content (SWC, m3/m-3). Potato
plants were treated with a combination of Tlow (low temperature; closed symbols), Thigh (high temperature; open symbols), and wet (circles) or dry (triangles) conditions. Boxed areas indicate the sampling period. Means ±SE are given (n=3).
Table 1. Environmental influences on physiological parameters
Results of linear mixed effects models testing the effects of temperature (low, high) and soil moisture (wet, dry) on physiological parameters (An, net assimilation rate; Ci, intercellular CO2 concentration; gs, stomatal conductance; SWC, volumetric soil water content),total plant biomass, tuber weight, and tuber count during the sampling period. P-values are given for treatments and their interaction. Significant differences are given in bold (P≤0.05).
Parameter An Ci gs SWC Plant biomass Tuber weight Tuber count
Temperature 0.070 0.012 0.127 0.863 0.978 0.359 0.400 Soil moisture 0.020 0.010 0.001 0.002 0.008 0.023 0.233 Temp.:moisture 0.522 0.110 0.174 0.845 0.565 0.892 0.486 ● ● ● ● ● ● ● ● ● ● ● ● ● ● ● ● ● ● ● ● ● ● ● ● ● ● ● ● ● ● ● ● ● ● ● ● ● ● ● −34 −32 −30 −28 −26 −24 −22 −20 (A) δ 13 C R (‰) ● ● ● ● ● ● ● ● ● ● ● ● ● ● ● ● ● ● ● ● ● ● ● ● ● ● ● ● ● ● ● ● ● ● ● ● ● ● ● 0 4 8 12 16 20 24 28 32 −34 −32 −30 −28 −26 −24 −22 −20 (B) Sampling period (h) δ 13 C leaf (‰) ● Tlow Wet Tlow Dry Thigh Wet Thigh Dry
Fig. 2. Daily cycles of the carbon isotopic composition of (A) leaf
dark-respired CO2 (δ13CR) and (B) bulk leaves (δ13Cleaf) under different
environmental conditions during the sampling period. Potato plants were treated with a combination of Tlow (low temperature; closed symbols), Thigh (high temperature; open symbols), and wet (circles) or dry (triangles) conditions. Grey areas indicate nighttime. Means ±SE are given (n=3).
soluble carbohydrates (fructose, glucose and sucrose) exhib-ited generally lowest δ13C
RS values (Fig. 3). δ13CRS of soluble
carbohydrates of all treatments were in the range of −27.2‰ and −36.6‰. More negative δ13C
RS values of glucose and
sucrose under Thigh compared to those under Tlow were found,
independent of soil moisture conditions, while less nega-tive δ13C
RS values under dry conditions compared to those
under wet conditions were observed, independent of tem-perature treatments (Fig. 3B, C; Table 3). Significant inter-actions between temperature and time for δ13C
RS of glucose
(P=0.008, Table 3) and sucrose (P=0.003, Table 3) showed that daily cycles differed between temperatures. Additionally, soil moisture conditions caused significant temporal varia-tions during the daily cycle in δ13C
RS of sucrose (P=0.002,
Table 3).
We observed significant linear relationships between fructose and glucose for δ13C
RS (r2=0.74, P≤0.001) and
concentration values (r2=0.8, P≤0.001), while relationships
between the other δ13C
RS values and concentrations of
differ-ent carbon sources were weaker (data not shown). However, the deviant results for δ13C
RS of fructose in comparison to the
other sugars are assumed to reflect peak overlap issues of this sugar (Tables 3, 4). This is clearly reflected also in the concen-tration results (Fig. 4A). Consequently, the fructose results will not be discussed further in detail.
δ13C
RS of malate (Fig. 3D) in the range of −24‰ and
−29.3‰ and δ13C
RS of citrate (Fig. 3E) in the range of −29.6‰
and −32.1‰ showed no temporal variations (P=0.198 and P=0.052 for malate and citrate, respectively, Table 3). Significant interactions between temperature and soil mois-ture treatments were observed for δ13C
RS of malate (P=0.017;
Table 3), resulting in larger differences between δ13C RS
val-ues of soil moisture conditions under Thigh than under Tlow
(Fig. 3D). Citrate showed less negative δ13C
RS values under
dry conditions than under wet conditions (P=0.009; Table 3).
δ13C
RS of starch of all treatments (Fig. 3F), ranging from
−25.2‰ and −32.1‰, was influenced by soil moisture con-ditions (P=0.046, Table 3), independent of temperature treatments, while temperature showed no significant effect (P=0.107, Table 3). In addition, soil moisture conditions caused significant temporal variations during the daily cycle in δ13C
RS of starch (P=0.032, Table 3).
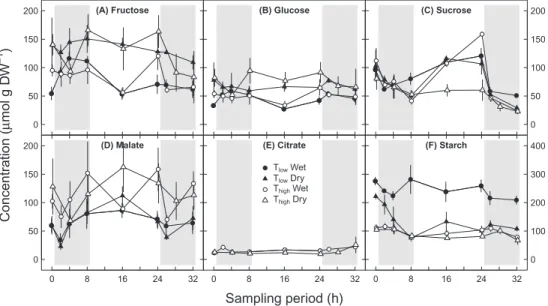
Concentrations of soluble carbohydrates, organic acids, and starch
Concentrations of glucose of all treatments (Fig. 4B), rang-ing from 27 to 95 µmol g DW-1, showed no temporal
varia-tions (P=0.927, Table 3). In contrast, concentrations of sucrose Table 2. Biomass and tuber analyses after sampling period
Total plant biomass (dry weight), tuber weight (fresh weight), and tuber count (number of potatoes) after the sampling period. Potato plants were treated with a combination of Tlow (low temperature), Thigh (high
temperature), and wet or dry conditions. Means ±SE are given (n=3). Refer to Table 1 for statistical analysis.
Treatments
Parameter Tlow wet Tlow dry Thigh wet Thigh dry
Total biomass (g) 10.6 ± 1.4 7.8 ± 1.2 10.3 ± 1 8.1 ± 0.5 Tuber weight (g) 513.9 ± 18.4 458.3 ± 15 481.4 ± 15.9 430 ± 24.2 Tuber count (no.) 21.3 ± 2.7 20.2 ± 1.7 19.3 ± 1.2 19 ± 2.3
Table 3. Environmental influences on leaf dark-respired CO2 and respiratory carbon sources
Results of linear mixed effects models testing the effects of temperature (low, high) and soil moisture (wet, dry) on δ13C values in different
putative leaf respiratory carbon sources, bulk leaves (δ13C
leaf), and in leaf dark-respired CO2 (δ13CR), as well as on concentrations of different carbon sources during the sampling period. Results for fructose are affected by co-elution with other compounds. P-values are given for treatments, time, and their interactions. Significant differences are given in bold (P≤0.05).
δ13C
Parameter Fructose Glucose Sucrose Malate Citrate Starch δ13C
Leaf δ13CR Temperature 0.019 0.004 0.028 0.015 n.a. 0.107 0.022 0.044 Soil moisture 0.001 0.001 0.001 0.049 0.009 0.046 0.005 0.013 Time 0.001 0.195 0.081 0.198 0.052 0.001 0.066 0.001 Temp.:moisture 0.035 0.063 0.543 0.017 n.a. 0.270 0.165 0.875 Temp.:time 0.256 0.008 0.003 0.807 n.a. 0.113 0.812 0.014 Moisture:time 0.061 0.291 0.002 0.060 0.411 0.032 0.596 0.883 Concentration
Parameter Fructose Glucose Sucrose Malate Citrate Starch
Temperature 0.663 0.352 0.142 0.011 n.a. 0.002 Soil moisture 0.001 0.001 0.031 0.999 0.052 0.001 Time 0.016 0.927 0.001 0.035 0.110 0.001 Temp:moisture 0.475 0.705 0.462 0.796 n.a. 0.001 Temp.:time 0.901 0.847 0.113 0.387 n.a. 0.324 Moisture:time 0.831 0.629 0.063 0.889 0.895 0.071
(Fig. 4C) in the range of 23 to 159 µmol g DW-1 showed clear
daily variations (P≤0.001, Table 3), with highest concentrations for all treatments by the end of the day, except for Thigh and dry
conditions. Glucose concentrations were significantly higher under dry than under wet conditions (P≤0.001, Table 3), while converse results were observed for sucrose (P=0.031, Table 3). Generally, no effect of temperature on the concentration of any soluble carbohydrate was observed.
Malate concentrations of all treatments (Fig. 4D), ranging from 23 to 163 µmol g DW-1, showed a daily pattern with
declining concentrations in the beginning of the night and an
increase after 2–4 h in the dark (P=0.035, Table 3). In contrast to soluble carbohydrates, malate concentrations were signifi-cantly higher under Thigh than under Tlow (P=0.011, Table 3),
but were not affected by soil moisture treatments (P=0.999,
Table 3). Citrate concentrations under Thigh of ~15 µmol g
DW-1 were the lowest of all measured putative carbon sources
available for leaf dark respiration and showed no changes due to soil moisture treatments and time (Fig. 4E; Table 3).
Starch concentrations (Fig. 4F), ranging from 67 to 282 µmol g DW-1, showed significant temporal variations
(P≤0.001, Table 3), independent of any treatment. The average starch concentration of 243 µmol g DW-1 under T
low and wet
conditions was clearly higher (~2.5 times) compared to those under other treatments. In addition, interactions between temperature and soil moisture treatments led to smaller dif-ferences between the values of wet and dry conditions under Thigh compared to those under Tlow (P≤ 0.001, Table 3).
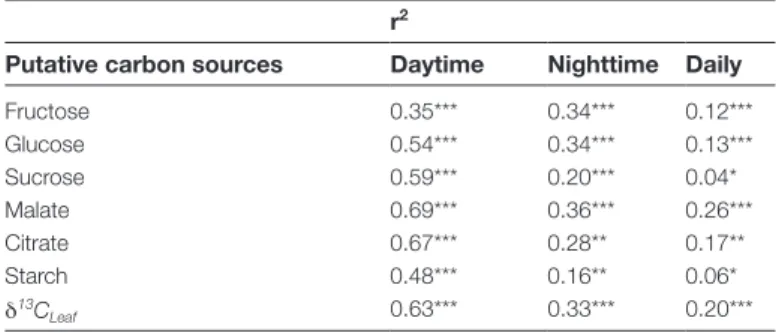
Linear relationships between δ13CR and δ13CRS
Linear regression analyses were performed to understand the biochemical link between δ13C
R and δ13CRS across
all treatments (Table 4; Supplementary Fig. S1). δ13C RS
of malate explained most of the daily variation of δ13C R
(r2=0.26, P≤ 0.001), while the explanatory power of
fruc-tose, glucose, and citrate was lower. The lowest linear rela-tionships during the daily cycle were found between δ13C
R
and δ13C
RS of sucrose and starch. Due to the high daily
variations in δ13C
R we carried out the same analysis
sepa-rately for daytime and nighttime. Daytime linear relation-ships were generally stronger than during nighttime, with
δ13C
R strongly related to δ13CRS of malate, citrate, and
δ13C
leaf (r2>0.6, P≤0.001), but lower related to δ13CRS of
sol-uble carbohydrates and starch. During nighttime, δ13C RS of
malate explained 36% of the variation in δ13C
R, but δ13CRS ● ● ● ● ● ● ● ● ● ● ● ● ● ● ● ● ● ●● ● ● ● ● ● −37 −34 −31 −28 −25 −22 (A) Fructose ● ● ● ● ● ●● ● ● ● ● ● ● ●● ● ● ● ● ● ● ●● ● (B) Glucose ● ● ● ● ● ● ● ● ● ● ● ● ● ● ● ● ● ● ● ● ● ● ● ● (C) Sucrose ● ● ● ● ● ● ● ● ● ● ● ● ● ● ● ● ● ● ● ● ● ● ● ● 0 8 16 24 32 −37 −34 −31 −28 −25 −22 (D) Malate ● ● ● ● ● ● ● ● 0 8 16 24 32 (E) Citrate ● Tlow Wet Tlow Dry Thigh Wet Thigh Dry ● ● ● ● ● ● ● ● ● ● ● ● ● ● ● ● ● ● ● ● ● ● ● ● 0 8 16 24 32 (F) Starch δ 13 C RS (‰) Sampling period (h)
Fig. 3. Daily cycles of the carbon isotopic composition of different leaf respiratory carbon sources (δ13C
RS) under different environmental conditions
during the sampling period: (A) fructose, (B) glucose, (C) sucrose, (D) malate, (E) citrate, and (F) starch. Potato plants were treated with a combination of Tlow (low temperature; closed symbols), Thigh (high temperature; open symbols), and wet (circles) or dry (triangles) conditions. Results for fructose are affected by co-elution with other compounds. Grey areas indicate nighttime. Means ± SE are given (n=2–3).
Table 4. Relationships between δ13C of leaf dark-respired CO 2 and δ13C of respiratory carbon sources
Linear regression analyses relating δ13C of leaf dark-respired CO 2
to δ13C of putative respiratory carbon sources and to δ13C of bulk
leaves (δ13C
leaf) across all environmental conditions for daytime (0 h, 16 h, 24 h), for nighttime (2 h, 4 h, 8 h, 26 h, 28 h, 32 h), and for the total daily cycle (sampling period over 32 h). Results for fructose are affected by co-elution with other compounds. Generic regression equation y=mx+b was used. r2 values are given, stars indicate P-values. All correlation coefficients were positive.
r2
Putative carbon sources Daytime Nighttime Daily
Fructose 0.35*** 0.34*** 0.12*** Glucose 0.54*** 0.34*** 0.13*** Sucrose 0.59*** 0.20*** 0.04* Malate 0.69*** 0.36*** 0.26*** Citrate 0.67*** 0.28** 0.17** Starch 0.48*** 0.16** 0.06* δ13C Leaf 0.63*** 0.33*** 0.20*** *, P≤0.05; **, P≤0.01; ***, P≤0.001
of fructose and glucose, as well as δ13C
leaf, showed similarly
high explanatory power.
Influence of environmental drivers and carbon sources
on δ13CR
Furthermore, a stepwise (backward) multiple linear regression analysis was performed to identify environmental drivers and carbon sources influencing δ13C
R (Table 5). Daytime/nighttime
showed the strongest positive effect on δ13C
R (β=0.73, P≤0.001),
while δ13C
RS of malate was the carbon source that affected δ13CR
most (β=0.4, P≤0.001). By comparison, the influence of δ13C RS
of starch and soil moisture conditions on δ13C
R values was minor.
Discussion
This study clearly demonstrates that different temperature and soil moisture conditions influence δ13C of leaf dark-respired
CO2 (δ13CR), δ13C of different putative leaf respiratory
car-bon sources (δ13C
RS), and concentrations of carbon sources
during a daily cycle in potato leaves. Furthermore, our find-ings strongly indicate malate as a key carbon source of day-time and nightday-time δ13C
R across different environmental
conditions.
Influence of temperature and soil moisture on isotopic compositions
After 2 weeks of treatment, we already found a clear tempera-ture effect on δ13C
leaf, with up to 2.2‰ more negative δ13Cleaf
values under Thigh conditions compared to those under Tlow
conditions (Fig. 2B). This is in agreement with a study show-ing more negative δ13C values with increasing temperature for
bulk leaves of Xanthium species (Smith et al., 1976). Similar to Tcherkez et al. (2003) under short-term temperature treat-ments, we observed more negative δ13C
R value with increasing
temperature (Fig. 2A), but due to our long-term treatment we found also more negative δ13C
RS values (Fig. 3). On the other
hand, dry conditions in both of the temperature treatments caused less negative δ13C
leaf, δ13CR, and δ13CRS values
com-pared to those under wet conditions, which is consistent with previous studies under controlled conditions (Duranceau et al., 1999; Ghashghaie et al., 2001).
The isotopic results under the different environmental con-ditions can be directly linked to the leaf gas exchange observed during the 32 h sampling period (day 15 of the treatment period). Increasing temperature caused lower An values under
both soil moisture conditions (Fig. 1A; Table 1), indicating that plants under Thigh were beyond the photosynthetic optimum.
This result is in agreement with earlier studies, showing that cold-adapted potato plants have reduced rates of photosynthe-sis with temperatures above 20°C (Levy and Veilleux, 2007). Additionally, An might be also influenced by leaf ageing, since
Table 5. Environmental drivers and carbon sources influencing
δ13C of leaf dark-respired CO 2
Result of stepwise (backward) multiple linear regression analysis showing the best-fit combination of independent environmental drivers (temperature, soil moisture, daytime/nighttime), time, and δ13C of glucose, sucrose, malate, and starch as variables influencing
δ13C of leaf dark-respired CO
2 (δ13CR) during the sampling period in potato leaves. Standardized β-coefficients and P-values are given.
Drivers and carbon sources influencing δ13C R Standardized β-coefficient P-value Daytime/nighttime 0.73 <0.001 Malate 0.40 <0.001 Starch 0.11 0.019 Soil moisture 0.14 0.013 ● ● ● ● ● ● ● ● ● ● ● ● ● ● ● ● ● ● ● ● ● ● ● ● 0 50 100 150 200 (A) Fructose ● ●● ● ● ● ● ● ● ●● ● ● ● ● ● ● ●● ● ● ● ● ● (B) Glucose ● ●● ● ● ● ● ● ● ●● ● ● ● ● ● ● ●● ● ● ● ● ● 0 50 100 150 200 (C) Sucrose ● ● ● ● ● ● ● ● ● ● ● ● ● ● ● ● ● ● ● ● ● ● ● ● 0 8 16 24 32 0 50 100 150 200 (D) Malate ●●● ● ● ● ● ● 0 8 16 24 32 (E) Citrate ● Tlow Wet Tlow Dry Thigh Wet Thigh Dry ● ● ● ● ● ● ● ● ● ● ● ● ● ● ● ● ● ● ● ● ● ● ● ● 0 8 16 24 32 0 100 200 300 400 (F) Starch Sampling period (h) Concentration (µ mol g DW −1 )
Fig. 4. Daily cycles of the concentration of different leaf respiratory carbon sources under different environmental conditions during the sampling period:
(A) fructose, (B) glucose, (C) sucrose, (D) malate, (E) citrate, and (F) starch. Potato plants were treated with a combination of Tlow (low temperature; closed symbols), Thigh (high temperature; open symbols), and wet (circles) or dry (triangles) conditions. Grey areas indicate nighttime. Results for fructose are affected by co-elution with other compounds. To facilitate comparison with other metabolites, sucrose concentrations were multiplied by 2 to count for hexose units, while starch concentrations are given in molarity of starch monomers. Note different y-axis scale in (F). Means ±SE are given (n=2–3).
An decreased under all treatments during the treatment period.
On the other hand, gs tended to higher values with increasing
temperature, but only under wet conditions (Fig. 1C; Table 1). An increase of gs under Thigh might be triggered by increasing
transpiration rates, which could be a physiological response to compensate reduced rates of An by cooling the leaf
tempera-ture under Thigh conditions. However, this was only observed
in plants under Thigh and well-watered conditions, when SWC
was high. Subsequently, lower carbon fixation and higher CO2
diffusion into the stomatal cavities under Thigh, in comparison
to Tlow, caused an increase of Ci (Fig. 1B) and more negative
δ13C
R and δ13CRS values (Table 6). Furthermore, dry soil
mois-ture conditions caused reduced rates of An and gs compared
to those under wet conditions (Fig. 1A, C; Table 1), independ-ent of temperature treatmindepend-ents. This can be explained with the severe drought stress, reflecting low SWC values (Fig. 1D). Consequently, plants under dry conditions experienced reduced CO2 diffusion into the stomatal cavities, leading to
lower Ci and less negative δ13C values (Table 6).
Plants under Thigh and dry conditions showed the
low-est performance during the sampling period compared to plants under other treatments, which is reflected in low An
values (Fig. 1A), plant biomass, tuber weight and tuber count (Table 2). δ13C
R and δ13CRS in these plants were expected to
be the most positive compared to other treatments due to a severe drought caused by the double effect of high tempera-ture and dry soil moistempera-ture. Instead, δ13C
R and δ13CRS of the
plants under the highest stress level (Thigh and dry conditions)
were rather similar to those under lowest stress level (Tlow and
wet conditions). This was particularly observed for δ13C RS of
soluble carbohydrates and starch (Fig. 3). Again, this is an indicator of low An under Thigh and dry conditions, resulting in
a moderate reduction of Ci, while at the same time gs strongly
reduces CO2 diffusion into the stomatal cavities, causing an
increase of Ci. Consequently, this led to intermediate δ13CR
and δ13C
RS values under Thigh and dry conditions (Table 6). In
summary our findings indicate that combined effects of tem-perature and soil moisture conditions on δ13C
R and δ13CRS
could cancel out the individual effect of each driver.
Environmental influences on concentrations of putative carbon sources
Soil moisture and temperature affected concentrations of putative leaf respiratory carbon sources differently. Sucrose concentration decreased under dry conditions (Fig. 4C;
Table 3), which is in contrast to the recent study by Lemoine et al. (2013). This may be explained by reduced rates of sucrose synthesis due to lowering of the sucrose phosphate synthase reaction (SPS) (Vu et al., 1998). The decrease in the enzyme activity is probably triggered by limited rates of phloem sugar transport observed under drought (Ruehr et al., 2009). This in turn could be an explanation for lower plant biomass and tuber weight/count in response to higher temperatures and dry conditions (Tables 1, 2). Subsequently, the increase of fructose and glucose concentrations under drought may also be a consequence of lower SPS activity (Fig. 4A, B; Table 3), since the demand for both hexoses for sucrose synthesis was reduced. Additionally, increasing fructose and glucose concentrations under drought might have osmotic functionality, maintaining metabolic activity (Lemoine et al., 2013).
On the other hand, malate concentrations increased with temperature (Fig. 4D; Table 3), which is most likely a conse-quence of higher PEPC activity (Chinthapalli et al., 2003). Higher malate concentrations may also support respira-tory processes in the KC or regulation of stomatal opening (Finkemeier and Sweetlove, 2009). Moreover, decreased starch concentrations in leaves under treatments with higher environmental stress than Tlow and wet conditions (Fig. 4F)
were similar to previous findings (Lemoine et al., 2013). The result also supports the assumption that reduced amounts of assimilated carbon due to lower An under Thigh or dry
con-ditions were used for maintenance of biochemical processes rather than for carbon storage. Additionally, this indicates that plants under Thigh or dry conditions were under severe
environmental stress.
Malate as a key respiratory carbon source of daytime
and nighttime δ13CR
The daily cycle of δ13C
R was highly variable, showing less
negative daytime and more negative nighttime values, while
δ13C
RS values generally showed lower changes during the
same period (Figs 2A, 3; Table 3). δ13C
RS values of all
treat-ments compared to δ13C
R values were more negative for
sol-uble carbohydrates (up to 9.3‰) and citrate (up to 4.1‰), but also less negative for starch (up to 4‰) and malate (up to 5.2‰) during the daily cycle (Figs 2A, 3). In particular, malate was strongly enriched in 13C, by up to 8.8‰, compared
to all other putative carbon sources (Fig. 3). This was similar to a previous study investigating metabolites in potato leaves (Gleixner et al., 1998) and indicates a possible biochemical link between 13C enriched leaf dark-respired CO
2 and 13C
enriched malate.
For a better understanding of the overall biochemical con-nections between δ13C
R and different putative carbon sources,
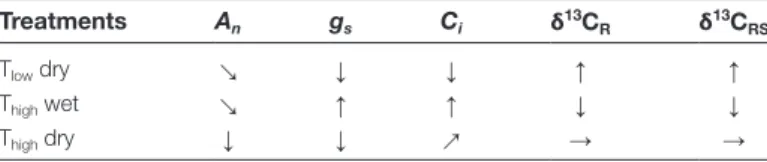
we carried out linear regression analyses, independent of environmental conditions (Table 4; Supplementary Fig. S1). Table 6. Coherence between leaf physiological parameters and
δ13C values. Leaf physiological parameters and δ13C values during the sampling period in potato plants under different treatments compared to those in potato plants growing under Tlow and wet conditions The following variables were considered: An, net assimilation rate; Ci, intercellular CO2 concentration; gs, stomatal conductance; δ13CR, δ13C of leaf dark-respired CO2; δ13CRS, δ13C of different putative respiratory carbon sources (fructose, glucose, sucrose, starch, and malate). Arrows indicate strong (↑, ↓), intermediate (↗, ↘), or no changes (→) due to the influence of treatment combinations (Tlow, low temperature;
Thigh, high temperature; and wet or dry conditions).
Treatments An gs Ci δ13CR δ13CRS
Tlow dry ↘ ↓ ↓ ↑ ↑
Thigh wet ↘ ↑ ↑ ↓ ↓
The daily linear relationship between δ13C
R and δ13CRS of
malate was stronger compared to all other putative carbon sources (r2=0.26, P≤0.001). The strength of this relationship
increased for δ13C
R and δ13CRS of malate when considering
daytime (r2=0.69, P≤0.001) and nighttime (r2=0.36, P≤0.001)
separately. Moreover, relationships of δ13C
R with δ13CRS of
malate were stronger than those of δ13C
R with δ13C of bulk
leaves (reflects the average δ13C value of all respiratory
sub-strates), which was, however, not the case for most relation-ships of δ13C
R with other carbon sources.
Please note that comparisons between daytime and night-time relationships must be done carefully (Table 4) due to the bias caused by LEDR in daytime δ13C
R, which depends on the
amount of assimilated carbon (Priault et al., 2009) and prob-ably also on environmental conditions. LEDR is considered to be fuelled by malate (Atkin et al., 1998; Barbour et al., 2007;
Gessler et al., 2009; Werner and Gessler, 2011). Consequently, the strong daytime relationship between δ13C
R and δ13CRS of
malate might be explained by a higher respiratory consump-tion of malate during the LEDR period, provoking less nega-tive daytime δ13C
R values (Fig. 2A). Furthermore, transferring
light-acclimated leaves into darkness is suggested to lead to reassembly of the KC by activation of light-inhibited enzy-matic reactions of the cycle (Tcherkez et al., 2005; Sweetlove et al., 2010; Werner and Gessler, 2011). During LEDR the KC might not be fully active, leading to changes in metabolic fluxes and isotope fractionations, which may not occur during nighttime when KC is fully reassembled (Werner et al., 2011). This could be an important factor, explaining light-dark dif-ferences in the relationships between δ13C
R and δ13CRS of
dif-ferent carbon sources in this study (Table 4). In contrast to malate, δ13C
RS of carbon storage compounds,
such as starch and sucrose, were less related to δ13C R
dur-ing daytime and nighttime (Table 4). This can particularly be explained for starch due to the fact that its isotopic composi-tion is always a mix of fresh and old assimilates, constraining good relationships with the isotopic composition of recently respired CO2. Moreover, the high daytime relationship
between δ13C
R and δ13CRS of citrate might be explained by
the close biochemical relationship of citrate with malate via the mitochondrial malate dehydrogenase and citrate synthase (Voet and Voet, 2011). However, citrate was 13C depleted and
showed very low concentrations compared to other carbon sources (Figs 3E, 4E), contradicting the role of citrate as an important carbon source of δ13C
R.
We also observed regular decreases in malate concentra-tions in the beginning of the night across all environmen-tal conditions (Fig. 4D), as observed in previous studies (Urbanczyk-Wochniak et al., 2005; Gessler et al., 2009), which may reflect the use of malate for respiratory processes shortly upon darkening, e.g. LEDR. It has also been suggested that malate accumulates during daytime (Barbour et al., 2007;
Gessler et al., 2009; Werner and Gessler, 2011). However, low temporal variations in malate concentrations during daytime do not support this hypothesis.
Furthermore, the hypothesis that δ13C
R is influenced by the
putative carbon source malate across all treatments was also indicated by a stepwise multiple linear regression analysis
(Table 5, P-values). The findings are in line with our other observations showing that (i) daytime and nighttime periods have a clear influence on δ13C
R (Fig. 2A); (ii) δ13CRS of malate
has the strongest influence on δ13C
R compared to all other
putative carbon sources; and (iii) influences of other environ-mental drivers and carbon sources are weaker and less signifi-cant compared to daytime/nighttime and malate. Overall, the findings strongly indicate δ13C
RS of malate as a key carbon
source of δ13C
R during the daily cycle across all
environmen-tal conditions within this study.
A mechanistic explanation for the respiratory use of malate can be found within the amphibole functionality of the KC and associated reactions (malic enzyme, PDH;
Fig. 5). Generally, the breakdown of glucose during gly-colysis produces pyruvate. Leaf feeding experiments using position-specific 13C labelled pyruvate have shown in
differ-ent species that respiration of the C-1 position of pyruvate is higher compared to respiration of the C-2 and C-3 position of pyruvate during daytime (Priault et al., 2009; Wegener et al., 2010), as well as during nighttime (Werner et al., 2009). This clearly indicates that acetyl-CoA (C-2 and C-3 position of pyruvate) from the PDH reaction, which enters the KC, is used for biosynthesis of diverse metabolic compounds (e.g. amino acids or lipids), rather than for respiration (Fig. 5). If this is true, withdrawn KC intermediates must be refilled due to stoichiometric reasons to maintain the functionality of the KC. This could be achieved by an anapleurotic flux via PEPC, which has often been described as replenishing KC intermediates (Melzer and O’Leary, 1987; Savidge and Blair, 2004). The PEPC reaction produces 13C-enriched
oxaloac-etate, of which the greatest proportion is directly converted into malate via the malate dehydrogenase reaction. A break-down of this malate pool within the KC or associated reac-tions (malic enzyme, PDH) would then produce 13C-enriched
leaf dark-respired CO2 (Fig. 5), explaining the close
rela-tionship between δ13C
R and δ13CRS of malate found in this
study. Moreover, malate is supposed to be 13C enriched at
the C-4 position via PEPC, while other positions of the mol-ecule are 13C depleted via glycolysis (Melzer and O’Leary,
1987; Savidge and Blair, 2004), causing dampening of the 13C
enrichment at the C-4 position when measuring δ13C of the
whole malate molecule (Fig. 3D). Therefore, slight changes in δ13C of malate may indicate higher changes at the C-4
position, which can be decarboxylated by the malic enzyme reaction or within the KC and thus be highly relevant for variations in δ13C
R. In brief, our findings strongly suggest
that δ13C
RS of malate has a strong influence on δ13CR during
daytime, as well as nighttime, across different environmental conditions in this study and that their biochemical link is driven by an anapleurotic flux via PEPC, replenishing KC intermediates.
Conclusions
Here we showed for the first time results of δ13C of leaf
dark-respired CO2 and δ13C of putative respiratory carbon sources
and soil moisture conditions on a daily basis in a C3 plant.
Overall, we found that δ13C
R values generally reflect changes
in δ13C
RS values in putative respiratory carbon sources due
to the influence of different temperature and soil moisture treatments on leaf physiological parameters. It is worth noting that the temperature in this study exceeded the pho-tosynthetic optimum of the potato plants under Thigh,
unex-pectedly leading to more negative δ13C values under T high
and dry conditions than those observed under Tlow and dry
conditions. This demonstrates that conclusions about the individual influence of an environmental driver on δ13C
val-ues should be drawn carefully and that verification of the isotopic results by gas exchange measurements is mandatory. Moreover, our findings indicate malate as a key respiratory carbon source of leaf dark-respired CO2 in potato plants.
This could also be the case in plant species comparable with potato, but should not be generalized and transferred to res-piratory processes in species of different functional groups such as trees or shrubs without verification. Please note that for exact quantification of the respiratory contribution of malate in comparison to other metabolites more knowl-edge about metabolic fluxes and turnover rates is necessary. Finally, for subsequent studies on this topic we recommend the inclusion of isotopic measurements of malate or of the organic acid pool, given the strong indications observed herein for a biochemical link between δ13C of malate and
δ13C of leaf dark-respired CO 2.
Supplementary data
Supplementary data are available at JXB online.
Supplementary Figure S1. Linear regressions between δ13C of leaf dark-respired CO
2 (δ13CR) and δ13C of different
putative respiratory carbon sources (δ13C
RS) across all
envi-ronmental conditions for daytime, for nighttime, and for the total daily cycle.
Acknowledgements
We thank Christiane Werner (University of Bayreuth) and Romain Barnard (INRA Dijon) for their experimental recommendations, Theodor Ballmer (Agroscope Reckenholz-Tänikon) for greenhouse organization, Dieter Juchelka (Thermo Fisher) for data evaluation advice, and Barbara Kornexl and Sebastian Zielis (both ETH Zurich) for setting up the starch concentra-tion measurements. Technical support at PSI Villigen was given by Kathrin Streit, Lola Schmid, Yves Letz, and Sweety; and at ETH Zurich by Annika Ackermann, Thomas Baur, Fridolin Stocker, Fiona Cimei, and EA Burns. The research project CIFRes (205321_132768) was financed by SNF. RTWS acknowledges the support by the SNF via R’equip (206021_128761).
References
Atkin OK, Evans JR, Siebke K. 1998. Relationship between the
inhibition of leaf respiration by light and enhancement of leaf dark respiration following light treatment. Australian Journal of Plant Physiology
25, 437–443.
Barbour MM, Hunt JE, Kodama N, Laubach J, McSeveny TM, Rogers GN, Tcherkez G, Wingate L. 2011. Rapid changes in δ13C of ecosystem-respired CO2 after sunset are consistent with transient 13C enrichment of leaf respired CO2. New Phytologist 190, 990–1002.
Barbour MM, McDowell NG, Tcherkez G, Bickford CP, Hanson DT. 2007. A new measurement technique reveals rapid post-illumination
changes in the carbon isotope composition of leaf-respired CO2. Plant,
Cell & Environment 30, 469–482.
Boschker HTS, Moerdijk–Poortvliet TCW, van Breugel P, Houtekamer M, Middelburg JJ. 2008. A versatile method for stable
carbon isotope analysis of carbohydrates by high-performance liquid
Fig. 5. Simplified schematic of respiratory processes in potato leaves. Breakdown of glucose during glycolysis produces pyruvate, which is converted
into CO2 and acetyl-CoA by the pyruvate dehydrogenase reaction (PDH). Acetyl-CoA is used for biosynthesis rather than for respiration, causing a drain of Krebs cycle (KC) intermediates. An anapleurotic flux via phosphoenolpyruvate carboxylase (PEPC) replenishes KC intermediates to maintain the functionality of the KC. Malate enters the KC and is used as carbon source for leaf dark-respired CO2. Dashed line indicates an alternative CO2 producing reaction via malic enzyme (ME). PEP, phosphoenolpyruvate; OAA, oxaloacetate.