Excitonic channels from bio-inspired templated
supramolecular assembly of J-aggregate
nanowires
†
Surendra B. Anantharaman,
a,bDaniel Messmer,
cAmin Sadeghpour,
d,e,fStefan Salentinig,
gFrank Nüesch
a,band Jakob Heier
*
aSupramolecular assemblies with controlled morphology are of paramount importance for energy trans-port in organic semiconductors. Despite considerable freedom in molecular design, the preparation of dyes that form one dimensional J-aggregates is challenging. Here, we demonstrate a simple and effective route to functionalize dendronized polymers (DPs) with J-aggregates to construct tubular DP/ J-aggregate nanowires. When J-aggregates are adsorbed onto DPs anchored to glass substrates, they assemble into microcrystalline domains typical for J-aggregates adsorbed on functionalized surfaces. Differently, the complexation between the dendronized polymer and J-aggregates in solution leads to dense packing of J-aggregate strands on the periphery of the DPs. Using a layer-by-layer (LBL) technique, DPs loaded with J-aggregates can also be adsorbed onto a DP monolayer. In this case, the thin film absorption spectra are narrower and indicate higher ratios of J-aggregate to monomer and dimer absorp-tion than bare J-aggregates deposited similarly. The demonstraabsorp-tion of J-aggregate adsorpabsorp-tion on filamentous polymeric templates is a promising step toward artificial 1D light harvesting antennas, with potential applications in opto-electronic devices.
1.
Introduction
The realization of artificial assemblies with efficient exciton transport properties is of utmost relevance to the development of future optoelectronic devices. Naturally occurring photo-synthetic light-harvesting systems, like chlorophyll molecules in a protein scaffold, act as antennas for exciton harvesting and transport to the special pair at the reaction center of the photosystem. This exciton funneling occurs over distances of
20–200 nm with near-unity efficiency.1,2Inspired by these self-assembled antenna systems, synthetic supramolecular struc-tures with strong transition dipole moment coupling have been a focus of recent research.3 This coupling results in efficient resonance energy transfer, which can lead to coherent exciton motion. Two-dimensional, brickstone J-aggregates are one prominent example of such structures, featuring large coherent excited state domain sizes with exciton delocalization over more than 10 000 molecules.4 Recently, unprecedented exciton coherence in J-aggregates up to 1 μm was realized,5 thereby surpassing the exciton coherence length of chlorophyll systems.2 In parallel, several hybrid systems incorporating quantum dots (QDs) and J-aggregates were developed to study the energy transfer from J-aggregates to QDs and vice versa. Walker et al.6 have reported ∼90% energy transfer efficiency from J-aggregates (donor) to QDs (acceptor) in a blend. Recently, Wang and Weiss7demonstrated that J-aggregates can act as“exciton-bridge” between lead sulfide donor and accep-tor QDs. The presence of J-aggregate bridges resulted in a 20-fold higher energy transfer rate than QDs closely linked by a polyelectrolyte. This functionality of the J-aggregate when integrated into energy harvesting systems can play a pivotal role in exciton transport for building efficient devices. Interestingly, the above mentioned studies were conducted with J-aggregates from a class of cyanine dyes with tubular morphology, as exciton transport is superior along the
aLaboratory for Functional Polymers, Swiss Federal Laboratories for Materials
Science and Technology (Empa), Überlandstrasse 129, CH-8600 Dübendorf, Switzerland. E-mail: [email protected]; Tel: +041 58 765 4356
bInstitut des matériaux, École Polytechnique Fédérale de Lausanne (EPFL),
CH-1015 Lausanne, Switzerland
cLaboratory of Polymer Chemistry, Department of Materials, ETH Zurich,
Vladimir-Prelog-Weg 5, CH-8093 Zürich, Switzerland
dCenter for X-ray Analytics, Swiss Federal Laboratories for Materials Science and
Technology (Empa), Überlandstrasse 129, CH-8600 Dübendorf, Switzerland
eLaboratory for Biointerfaces, Swiss Federal Laboratories for Materials Science and
Technology (Empa), Lerchenfeldstrasse 5, CH-9014 St Gallen, Switzerland
fLaboratory for Biomimetic Membranes and Textiles, Swiss Federal Laboratories for
Materials Science and Technology (Empa), Lerchenfeldstrasse 5, CH-9014 St Gallen, Switzerland
gDepartment of Chemistry, University of Fribourg, Chemin du Musée 9,
1700 Fribourg, Switzerland
† Electronic supplementary information (ESI) available.
http://doc.rero.ch
tubular direction.5,8 Despite extensive research into tubular J-aggregates,8–16they are scarce and tuning the morphology of J-aggregate remains challenging.9,17,18 Given these structural restrictions, it is challenging to modify optical properties without impacting J-aggregate morphology, limiting appli-cations in devices relying on exciton transport. Furthermore, J-aggregates are generally poorly soluble independent of mor-phology and processing into thin films can be a challenge. Spontaneous self-assembly of dye molecules in solution gen-erally does not yield well-defined structures, but crystals that are rich in defects and show a high degree of disorder. Also here film formation properties are poor and coherence pro-perties in the thin film are typically worse than in solution. LB techniques improve the quality of these assemblies, but are labor intensive and the transfer to a substrate is impractical.19
A way out of this dilemma is suggested by nature itself: in light harvesting antennas, protein scaffolds assemble chromo-phores in a fashion suitable for long-range exciton transport. This has inspired a number of research groups already: the scaffolding of cyanine dye molecules on one-dimensional tem-plates including DNA,20,21 viruses,22 or proteins23 has been widely studied. However, in these cases, the dye monomers are assembled on the scaffold. Given the limited spectral overlap of absorption and fluorescence, the Förster resonance energy transfer (FRET) rate in these systems is low. For instance, cyanine dye monomers coupled on DNA (with up to∼30 nm in length) have a transfer efficiency of ∼2% in solution.24 The mechanism of linear helical J-aggregate formation on DNA templates is a sequential process of inserting a co-facial (H-type) dimer into the minor groove of DNA, followed by
dis-lodging the dimers into a higher-order aggregate (H- or J-type). Consequently, the groove gets perturbed to facilitate binding to another dimer. In a cooperative fashion, this array of dimers forms an aggregate.20,21It can be postulated that the coupling between adjacent dimers is very weak, leading to exciton local-ization along the DNA. Moreover, the presence of J-dimers will adversely localize the exciton on the J-aggregate channel due to its lower optical bandgap.
We thus followed a different approach and anchored J-aggregates of a cyanine dye (Fig. 1) dispersed in the solvent onto a template. As one-dimensional templates, we used den-dronized polymers (DPs), a class of comb polymers where a linear backbone bears a dendritic (i.e. regularly and repeatedly branched) side chain on every repeating unit.25,26 An
impor-tant parameter for the description of these polymers is the dendritic generation number g, which corresponds to the number of branching points between a peripheral group and the focal point by which the dendritic side groups are attached to their common core. By virtue of the very compact structure of the dendritic side chains, DPs are more shape persistant than other branched macromolecules such as bottle-brushes, and the chain diameter becomes a parameter which can be varied in discrete steps by altering g.27 Increasing thickness
influences e.g. the overall stiffness of the polymers27,28 and creates a separation between “interior” and “exterior” at sufficiently high g.29,30Another feature of interest is the large
number of peripheral groups, which permits the facile modifi-cation of peripheral functionality and bears potential for supramolecular interactions. The DPs used in this publication feature a methacrylate-based backbone and twofold-branching
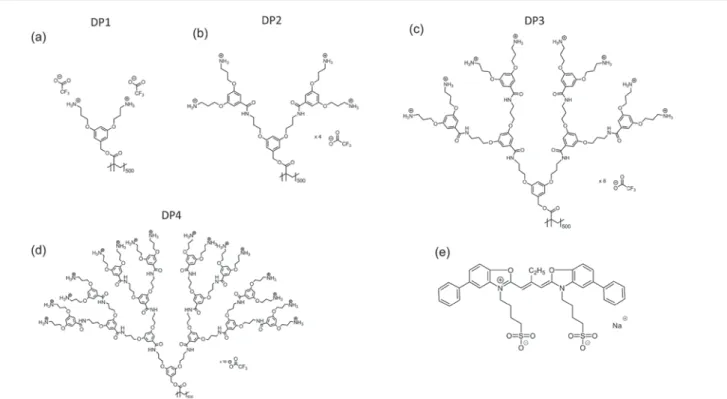
Fig. 1 Chemical structures of the DPs featured in this publication (DP1, DP2, DP3 and DP4) as shown in (a–d) and the cyanine dye J560 used for J-aggregate formation (e).
dendritic side chains bearing peripheral amines (in the form of their trifluoroacetate salts, see Fig. 1). The synthesis of the DPs follows a bottom-up protocol, building the side chains one g at a time (see ESI, sections S1 and S2†).31In solution, the degree of protonation can be controlled via the pH, permit-ting easy control of the charge density of the DP. Furthermore, the DPs are water soluble and adhere strongly to oxide sur-faces.31 These properties have previously been utilized to
immobilize covalent DP–enzyme conjugates on a variety of solid supports like mica, glass and silica.32–35
In this manuscript, we investigate different aspects of the interaction of cyanine dye aggregates with DPs. The main goal of our work is to determine the conditions under which the DP template guides high quality J-aggregate assembly. The interaction between DPs and J-aggregates is mainly electrostatic, as the positively charged protonated peripheral amine groups of the DPs’ dendritic side chains can bond ionically to the nega-tively charged sulfonate groups of the cyanine dye J560 (Fig. 1e) or its aggregates. We investigate in more detail the effect of line charge density, which varies greatly with g. Adsorbing J-aggregates to DPs anchored to a surface does not improve J-aggregate crystal quality (morphology, optical properties) over other adsorption methods. In contrast, adsorbing J-aggregates onto the DPs in solution first and then anchoring the composite onto the substrate led to spectroscopically well-defined aggre-gates. Using small angle X-ray scattering (SAXS), we demon-strated that the aggregates indeed adsorb on the DPs in solution by forming tubular aggregates, as evident from the observed con-formational changes. The J-aggregate nanowires maintain their spectroscopic properties when adsorbed onto a substrate.
2.
Results and discussion
2.1 Dye aggregation in solution
The specific dye (J560, for molecular structure see Fig. 1e) was chosen for this investigation as it favors aggregation under acidic conditions, where amine groups in the DPs are fully pro-tonated. First, J-aggregate formation in solution is discussed. The process of J-aggregate self-assembly of the dye J560 is a complex but hierarchical process influenced by solvent polarity, ionic strength and the dye concentration. J560 was dissolved in methanol (cJ560= 0.2 mM), water (cJ560= 0.2 mM)
and 100 mM acetate buffer with pH ∼3.5–4 (cJ560= 0.04 mM).
In methanol, only the monomer (M) form of the dye was observed with peak absorption at 504 nm (Fig. 2). Even though the sulfonate groups (see Fig. 1) render J560 somewhat water soluble, at the indicated concentration the monomers form J-aggregates (marked J in Fig. 2) and H-type dimers (D), visible as red- and blue shifted peaks in the UV-vis spectrum next to remnant monomers. J-aggregates formed in acetate buffer have a higher quality than J-aggregates formed in water. Suspending J560 in 100 mM acetate buffer led to complete formation of J-aggregates ( peak absorption at 560 nm) with only a small amount of remnant monomers. Modifying the ionic strength of the buffer solution provides a further
poten-tial handle to alter the equilibrium between H-type dimers and J-aggregates. The molar extinction coefficient and full-width at half-maximum (FWHM) of the J-aggregate in acetate buffer was 2.194 × 10⁵M−1cm−1and 17.1 nm respectively.
2.2 Conformation of different generation DPs on glass substrates and anchoring J-aggregates
Glass substrates were functionalized with DPs by immersion into a DP solution (∼100 mg L−1 in 100 mM acetate buffer, pH≈ 4) for 30 min, followed by rinsing with acetate buffer and water. The structure of the adsorbed layers here depends strongly on DP charge density with respect to the surface charge density.36The maximum line charge densities of fully protonated DPs are reported to decrease from 60 nm−1, to 30 nm−1, 15 nm−1and 7.5 nm−1for DP4, DP3, DP2 and DP1, respectively.37 The glass surface may have a density of Γ = 8 nm−2chargeable sites.38Under our experimental conditions,
the highly positively charged polymer chains of DP4 form a densely packed monolayer on glass or mica substrates as evident from AFM height images (Fig. 3d). The DPs showed worm-like structures, with rather elongated chains and almost equidistant spacing between neighboring polymers.37For more information on the optimization conditions, please refer to the ESI, section S1, Fig. S1 to S5.† We can assume that the majority of the segments of the DP are directly absorbed to the negatively charged surface, and that there is a slight excess of positive charges, overall. This charge overcompensation prevents additional polymer from adsorbing on top of the monolayer.
Under the same deposition conditions, films of DP3 formed a similar monolayer, but on top of that excess DPs col-lapsed into toroid shaped condensates (Fig. 3c). We suspect that the glass surface carries a higher charge density than a DP3 monolayer can compensate completely. In that case, DP3 adsorption is limited by steric interactions between adsorbed chains rather than by charge compensation. The overall charge of the surface is still negative, facilitating the adsorption of further polymers to the DP3 monolayer. The exact origin of this condensation is not quite clear: generally, long-range
Fig. 2 Attenuance (normalised) for J560 dye dissolved in methanol, water and 100 mM acetate buffer. The letters D, M and J stand for dimers, monomers and J-aggregates, respectively.
electrostatic interactions result in strongly correlated surface charge pattern that can lead to the formation of unexpected structures.39 The similarity to DNA toroids, especially the monodispersity of the condensates as visible in the AFM images, speaks for a similar formation mechanism. DNA was reported to collapse into toroidal structures in solution upon the addition of covalent cations and other agents that mediate the attractive interaction between the chains.40Desorption of small cations from the glass surface may play that role. Ubbink and Odijk calculated the stability conditions for DNA hexagonally packed within a toroid.40It was found that toroids are the stable state for sufficiently stiff chains. Toroidal struc-tures may form in solution above the charged surface and then attach to the DP monolayer. The trend for ring structure for-mation on top of a first adsorbed DP monolayer continued for DP2 and DP1 (Fig. 3a and b). The even lower line charge den-sities (7.5 and 15 nm−1 for DP1 and DP2, respectively)37 still allow for electrostatically driven adsorption of DP to the sub-strate,36but the reduced polymer charge density leads to less repulsion between the DP chains, such that a denser mono-layer can form.36For DP1 and DP2, the monolayer appears as a uniform film under the AFM, while for DP3 and DP4 the indi-vidual chains are resolved (Fig. 3 and Fig. S7, ESI†). The domi-nating substrate charge density allowed for denser packing of the toroids. Toroidal DNA condensates have been identified as a method by nature to pack genomes at high density.41Line profiles of defects in the DP1 and DP2 layers show that indeed a monolayer of the polymers, forms on the glass substrate. We show the film profiles together with cross sections of the toroi-dal structures (Fig. S7, ESI†).
To summarize, adsorbing DPs of different generation onto glass surfaces leads to different charge profiles and surface topographies. In the next section, we will discuss the depo-sition of J-aggregates on these DP films.
Glass substrates uniformly covered with DP films were immersed in J560 (cJ560 = 0.6 mM in 100 mM acetate buffer,
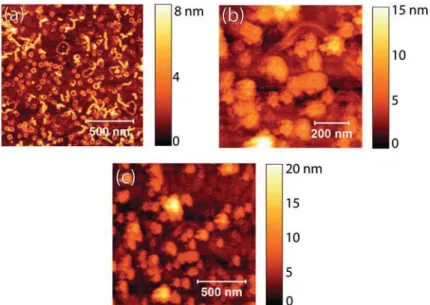
pH ≈ 4) and shaken overnight. Under these conditions, the dye is initially present in the form of dispersed J-aggregates (see section 2.1). The substrates were rinsed first with acetate buffer, then with deionized water. At pH ≈3.5–4, the proto-nated peripheral amines of the DPs should interact with the sulfonate groups of the dye to anchor the J-aggregates. The attenuance spectra of the J-aggregate films are shown in Fig. S8 (ESI†). Compared to the solution spectra, the absorp-tion peaks showed significant broadening and increased contributions from monomers and dimers. AFM images of the aggregates adsorbed from solution are shown in Fig. 4 and S9.† The aggregates adsorbed from solution crystallized into larger objects following a Volmer–Weber growth model and did not form conformal coatings on the DPs.18A crystal morphology of this type is characteristic for J-aggregates deposited onto functionalised substrates, and a direct advantage of using DPs over e.g. dendrimers cannot be recognized.18,42 Imprints of the DP monolayer are visible in the J-aggregate crystal, but a direct guiding or templating effect of the sub-strate is not apparent. Also, this process was independent of DP generation and dye solution concentration. The attenuance spectra of J-aggregates on DPs of different generation reveal further information. The contributions to total attenuance attributed to monomer or J-aggregate as well as the ratio between these contributions are shown in Fig. 5. No adsorp-tion of J-aggregates on glass substrates was observed in the absence of the DP layer. The J-aggregate peak intensity was largest for DP2, as was the ratio between monomer and J-aggregate contributions. This observation suggests a correlation between the conformation of the DP and the aggregation behavior. The dye formed better J-aggregates (i.e. high J-/M-ratio) on the toroidal structured DPs (DP1 and DP2) than on the
rod-Fig. 3 AFM height images (tapping mode) of DPs– (a) DP1, (b) DP2, (c) DP3 and (d) DP4 deposited on glass.
like DPs (DP3 and DP4). It can also be seen that the dimer (D) absorption started to increase with DP3 and DP4. Effectively, the J-aggregate films on DP3 and DP4 showed a higher dimer and monomer fraction than the starting solution.
Small-angle X-ray scattering studies (see section 2.3) indi-cate that the density of dendrons packed in a DP increases with DP generation. The shape of the DP2 surface seems to be most compatible with the conformation of the aggregates and fewer monomers or dimers find room to also adsorb to the DP. Indeed, when using a solution with higher dye concentration (cJ560= 2 mM dye in 100 mM acetate buffer), resulting in larger
aggregates, a further decrease in J-aggregate absorption was observed (Fig. S8b and d†). As the DPs were strongly adsorbed on the glass surface, limiting their conformational flexibility, J-aggregate growth does not seem to be directed by the mole-cular nature of polymers, but J-aggregate growth follows a Volmer–Weber growth mode, whereby individual J-aggregates assemble into larger crystals. J-aggregation is even more
promi-nent on low generation DPs than higher generation DPs. The adsorption onto DP monolayers is therefore also different from the cooperative mechanism of cyanine dye complexation with DNA in solution,20,21where initially formed dimers act as nucleation sites for J-aggregate growth.
2.3 Complexation of J-aggregates and dendronized polymers in solution studied by SAXS
To avoid the conformational constraints of the deposited DP films and to allow the polymers to act as true templates, we moved to complexing DPs and J-aggregates in solution. DP2 and DP4 in 100 mM acetate buffer solutions, pH ≈ 4, were prepared and different amounts of J-aggregate in acetate buffer were added to obtain 0.2 mM, 0.6 mM and 2 mM dye concen-tration (see ESI, Fig. S10†). The solutions were stirred overnight and filled into quartz capillaries for the SAXS measurements.
The solution containing DP2 was characterized with increasing amounts of dye molecules added to the sample. The SAXS scattered intensities as a function of the scattering vector magnitude, q, for those samples and the pure dye sample at 2 mM concentration are presented in Fig. 6a together with their corresponding simulated curves. Fits of the corresponding pair-distance distribution functions, p(r), are shown in Fig. 6b, as obtained from indirect Fourier transform-ation (IFT) analysis of scattering data; these plots aid in the interpretation of the systems’ structural behavior in real space. The p(r) from the pure polymer shows asymmetric behavior. A maximum appears at around 2.9 nm while a (semi-)linear decay shows up at higher dimensions, reaching zero at around 22 nm. Such p(r) behavior is typical for elongated particles (cylindrical structures) with maximum dimension (DL) of
about 22 nm. To obtain further information about the cross section of the cylindrical structures, before and after loading with dye molecules, the scattering from the cylinder cross-section, Ics(q) was separated from the cylinder length (
pro-Fig. 4 AFM topographies (tapping mode) of J-aggregates deposited on DP2-functionalized glass from (a) 0.2 mM, (b) 0.6 mM and (c) 2 mM solu-tions of J560 in 100 mM acetate buffer (pH ≈ 4).
Fig. 5 Attenuance of monomers and J-aggregates deposited on DP functionalized glass substrates from cJ560 = 0.6 mM dye solution in 100 mM acetate buffer of pH ≈ 4.
portional to q−1) via Ics(q) = I(q) × q. The resulting Ics(q) curves
are shown in Fig. 6c. These corresponding p(r) functions correspond to the spatially averaged convolution square of electron density fluctuations within the cross section of polymer chains. The cross-sectional p(r) for the pure polymer shows a bimodal distribution with a maximum cross-section dimension (Dcs) of 5.3 nm.
A similar behavior has been observed for polymer samples loaded with 0.2 and 0.6 mM of dye; the p(r) presented in Fig. 6d shows an increase in DLup to 33 nm. Consistent with
the increase in overall particle dimension, p(r) of the cross-section also demonstrates a slight increase after adsorption of dye molecules on the polymer chains (from Dcs = 5.3 nm for
pure polymer to 6.6 nm in presence of 0.6 mM of dye). Interestingly, the bimodal feature present in pure DP2 in p(r) disappears with increasing dye concentration and a uniform electron density distribution across the polymer was observed eventually (Fig. 6d). This is likely the result of the coverage of the DP surface with J-aggregates through charge–charge inter-actions and hydrophobic effects, which results in the expul-sion of water to form a homogeneous scattering volume.
At very high concentrations of dye (2 mM), the scattering patterns resemble the ones obtained for pure dye aggregates, only with extension to higher Dmax(see the broad distribution
peak at around 12 nm in Fig. 6b, blue and gray curves). This indicates that at such high concentrations of dye, the polymer is saturated and cannot adsorb additional dye molecules, and hence considerable numbers of standard J-aggregates form in the medium. It can be noted that the trend observed in attenu-ance for the J-aggregates deposited on DP2 pre-functionalized substrates shown in Fig. S8(b†) matches the SAXS measure-ment in solution: at the optimized dye concentration of 0.6 mM, the J-aggregate size is such that DP and aggregate can adapt their conformation without too high a penalty in energy. Increasing the dye concentration to 2 mM drastically increased the J-aggregates size in solution, which inhibited its adsorp-tion to the amine groups of the DP, leading to a decrease of J-aggregate adsorption (Fig. S8b†).
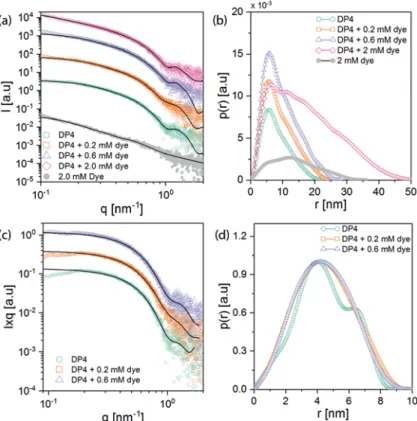
SAXS measurements on the DP4 samples (Fig. 7) revealed similar trends: DLfor DP4 showed similar values as DP2, an
increase in DL for pure polymer from around 23.5 nm to
33.5 nm for polymer subjected to 0.6 mM dye (Fig. 7a and b). As expected, the cross-sectional dimensions were significantly larger: Dcs= 8.8 nm for pure polymer increasing to Dcs = 9.7
for polymer in the presence of 0.6 mM dye. Such increased cross-sectional dimensions are in good agreement with our estimations from the molecular structure of the polymer. In further similarity to the observations made for DP2, the
Fig. 6 (a) The experimentalI(q) profiles of DP2 and its mixture with J560 dye shown in dots, and their corresponding theoretical curves shown as solid lines calculated from the IFT analysis. For better representation, the curves are shifted vertically. (b)p(r) functions corresponding to the theo-retical curves shown in (a). (c) I × q versus q curves for DP2 and polymer–dye mixtures representing cross-section scattering intensities. These curves were analyzed by IFT to obtain detailed cross sectional information. For better representation, the curves are shifted vertically. (d)p(r) functions, obtained by IFT assuming cylindrical symmetry for theI × q are shown in (c).
initially present bimodal feature in cross sectional p(r) of DP4 diminished after adsorption of dye (Fig. 7d), indicating a trans-formation of the cross-section from a core–shell to a homo-geneous structure, indicative of the replacement of initially present water with tightly interacting dye molecules (Table 1).
2.4 Layer-by-layer deposition of DP/J-aggregate nanowires SAXS experiments proved that for a dye concentration of cJ560=
0.6 mM, dye aggregates are homogeneously covering the DPs’ exterior surfaces. Also, the SAXS measurements showed an
overall increase in elongated dimension for both DP2 and DP4 upon addition of dye. We next tested a layer-by-layer (LBL) approach to adsorb the newly formed nanowires onto a substrate. The DP2/J-aggregate nanowires did not adsorb onto neat glass substrates, but they adhered well on substrates func-tionalized with DPs. From this, we conclude that the DP/ J-aggregate nanowires bear overall negative charges, i.e. that the nanowires bear >0.5 equiv. of J560 per amine of the central DPs. To deposit the nanowires, glass substrates were functio-nalized with monolayers of DP (as shown in Fig. 3), exposed to the DP2/J-aggregate nanowire solution for 24 h and then rinsed with water. AFM images revealed a low density of thick, individual DP2/J-aggregate nanowires adsorbed on the DP2-functionalized surface (Fig. 8a). The aggregates have a thicker and more elongated, rod-like shape than the underlying DPs. The structure is also very different from the J-aggregates adsorbed onto a DP functionalized surface (Fig. 5). Corroborating the SAXS results, this suggests the formation of a DP/J-aggregate nanowire whereby the DP chains stretch upon dye loading. A direct comparison between the DP/J-aggregate nanowires in solution and the ones adsorbed to the substrate is difficult because the substrate has a major influence on the conformation. It can be noted that the nanowires preferentially adsorb on top of the“isolated” rings, in agreement with our earlier interpretation that the potential at the monolayer level
Fig. 7 (a) The experimentalI(q) profiles of DP4 and its mixtures with J560 dye shown in dots along with their corresponding theoretical curves (solid lines) calculated from the IFT analysis. For better representation, the curves are shifted vertically. (b) p(r) functions corresponding to the theoretical curves shown in (a). (c)I × q versus q curves for DP4 polymer–dye mixtures, representing cross-section scattering intensities. These curves are analyzed by IFT to obtain detailed cross sectional information. For better representation, the curves are shifted vertically. (d)p(r) functions, obtained by IFT assuming cylindrical symmetry for theI × q shown in (c).
Table 1 Maximum elongated dimension (DL) and maximum cross-section dimension (Dcs) for DP2 and DP4 at different dye loadings. Note that these dimensions are underestimates, due to the inherently limited access to lowq values in the Guinier regime
Sample details Maximum elongated dimension (DL), in nm Maximum cross-section dimension (Dcs), in nm DP2 DP4 DP2 DP4 Pure DP 22 23.5 5.3 8.8 DP + 0.2 mM dye 23 25 5.7 9.7 DP + 0.6 mM dye 33 29 6.6 9.7 DP + 2 mM dye 35 53 NA NA
http://doc.rero.ch
is negative, while the top surface of the toroids is positive. We can also note that the surface is free of the J-aggregate crystals observed in the experiments described in section 2.2. This con-firms the SAXS results which suggest that all J-aggregates are complexed with the DPs to form DP/J-aggregate nanowires.
The morphology of DP4/J-aggregate nanowires analogously prepared was markedly different: DP4/J-aggregate nanowires were not found to adhere individually, but assembled into bundle-like structures when deposited on the substrate (Fig. 8b and c). This can be explained by a reduction of electro-static repulsion between DP/J-aggregate nanowires, the positive charge of the DPs is compensated by the negative charge of the dye aggregates anchoring on the DP surface. This type of nanotubular bundles are also famously present for tubular J-aggregates.43
Also here, and differently from the aggregates directly assembled onto a substrate (Fig. 5 and S9†), no platelet-shaped crystals were observed. Larger J-aggregate crystallites are prone to self-quenching at defects like grain boundaries resulting from the spontaneous self-assembly process. Moreover, static disorder is one of the limiting factors for extended diffusion length in large aggregate crystals. Next to the absence of polycrystalline domains, a J-aggregate of“high quality” shows characteristic features in UV-Vis spectroscopy. The FWHM of the absorbance peak is narrow and the fraction of monomer and dimer absorbance is low. Absorbance spectra of the DP/J-aggregate nanowires in thin films are shown in Fig. 9. It can be noted that the J- to M-ratio is much higher in DP/J-aggregate nanowires than it is in J-aggregates deposited on DPs (Fig. S8d†) for the same dye concentration (cJ560 =
0.6 mM). Also, the dimer absorption is negligible when using the solution complexation route (Fig. 9) compared to deposit-ing the aggregates on DP-functionalised substrates (Fig. S8d†). This underscores the significance of initial conformational
flexibility of the polymer, which is required for templated J-aggregation (Fig. 8), as opposed to mere adsorption (Fig. 4). In fact, the DPs acted as a much better linear template for J-aggregates than conventional DNA assemblies, which are difficult to functionalise with J-aggregates already present in the solution.
3.
Conclusion
We here demonstrated the potential of complexing DPs and J-aggregates in solution as a new method to form coherent tubular aggregates with improved properties in thin films. Critical for the ability of the J-aggregate to anchor to the den-drons of the DP is the dye concentration (size of aggregates) and generation of the DPs. The net negatively charged DP/ J-aggregate nanowires can be easily deposited onto a positively charged substrate, maintaining a high fraction of J-aggregates
Fig. 8 Complexes of J-aggregates with DP2 (a) and DP4 (b) deposited from solution (cJ560= 0.6 mM in acetate buffer) on their corresponding DP pre-functionalized glass substrates. For DP4, super-structures were observed with local ordering when they are covered with dye molecules as shown in (c).
Fig. 9 Attenuance spectrum of DP4/J-aggregate nanowires (formed at cJ560 = 0.6 mM) and deposited onto DP4-functionalized glass substrates.
in the film. Adsorbing J-aggregates from solution onto sub-strates functionalised with DPs on the other hand is not a promising route to fabricate high quality J-aggregate films.
The complexation route allows to disperse J-aggregates into other matrix materials, where they could act as energy trans-port channels in FRET mode. Moreover, due to the versatility of this technique, J-aggregates could be grown on defined pathways which provides exciting opportunities for building opto-electronic devices. The next steps will be to study the pro-perties of these tubular aggregates as excitonic channels in excitonic transistors. Specifically, we believe that this method can be extended to study donor–acceptor systems for energy transfer studies and in photovoltaics.
4.
Experimental section
Dendronized polymers of generation 1–4 were synthesized by following protocols inspired by solid phase peptide synthesis as described elsewhere.31 Glass substrates were cleaned in
acetone, ethanol, Hellmanex soap solution and water (3 times) with 5 min ultrasonication for each step separately. The sub-strates were dried using a N2 gas stream and treated with
oxygen plasma for 5 min to remove any organic residues. To deposit the DP on glass, the substrates were immersed in a solution of DP (1 mg mL−1 in 100 mM acetate buffer, pH≈ 3.5–4) for 30 min and rinsed with acetate buffer followed by rinsing with water and drying in an N2gas stream. Cyanine dye
J560 (5-phenyl-2-[2-[[5-phenyl-3-(4-sulfobutyl)-3H-benzoxazol-2-ylidene]-methyl]-but-1-enyl]-3-(4-sulfobutyl)-benzoxazolium hydroxide, inner salt, sodium salt), was dissolved in methanol, water and acetate buffer at different concentrations to study the J-aggregate formation in solution. The dye was purchased from FEW Chemicals, Germany, and used without further purification. To prepare DP/J-aggregate nanowires, the dye with different concentrations in acetate buffer (100 mM, pH ≈ 3.5–4) and DP in acetate buffer (100 mM, pH ≈ 3.5–4) were mixed together and stirred overnight. To transfer the DP/J-aggregate nanowires onto the substrate, a glass substrate was functionalized with DP2 or DP4 monolayer as described above. The functionalized glass substrate was immersed in a DP/J-aggregate nanowire solution and rinsed with acetate buffer to remove the weakly adsorbed materials. This method-ology is called layer-by-layer approach, as materials of opposite charge are subsequently adsorbed to the surface. The surface topography of the adsorbed layers was studied using a Bruker Dimension Icon AFM with Antimony-doped Si cantilevers (RTESP 300, tip radius of 12 nm, force constant of 40 N m−1, resonant frequency 300 kHz) procured from Bruker. Images were analysed using the Nanoscope software. UV-Visible spectra were acquired using a Varian Cary 50 UV-Vis spectrophotometer.
SAXS experiments were performed using a Nanostar SAXS system (Bruker AXS GMBH, Karlsruhe, Germany) equipped with a microfocus X-ray source (Cu Kα, λ = 0.154 nm) and MONTEL optics, providing a point-focused X-ray beam.
A VÅNTEC-2000, Xe-based gaseous avalanche detector capable of photon counting with 0.5 s temporal resolution, positioned at sample to detector distances of about 67 cm was used to acquire the scattering patterns. The acquisition time was 2 h. The setup is optimized and aligned to achieve the minimum scattering vector modulus of 0.1 nm−1. All experiments were performed at room temperature.
The DP samples and their mixtures with dye solution were transferred into disposable quartz capillaries of 1.5 mm in outer diameter (Hilgenberg GmbH, Malsfeld, Germany). The capillaries were sealed prior mounting in the sample chamber. The scattering patterns from empty and acetate buffer filled capillaries were also recorded for background subtraction.
Con
flicts of interest
There are no conflicts to declare.
Acknowledgements
The authors gratefully acknowledge funding from the Swiss National Science Foundation grant number: 200021-157135 and 169695 to conduct this research work. We acknowledge the Scanning Probe Microscopy user laboratory at Empa for provid-ing access to the AFM. The authors gratefully acknowledge Prof. Dr. A. Dieter Schlüter for his valuable inputs and discussion.
References
1 E. Romero, V. I. Novoderezhkin and R. van Grondelle, Nature, 2017, 543, 355.
2 T. Mirkovic, E. E. Ostroumov, J. M. Anna, R. van Grondelle, Govindjee and G. D. Scholes, Chem. Rev., 2016, 117, 249– 293.
3 T. Kobayashi, J-Aggregates, World Scientific, 2012. 4 D. Möbius, Adv. Mater., 1995, 7, 437–444.
5 D. M. Eisele, J. Knoester, S. Kirstein, J. P. Rabe and D. A. Vanden Bout, Nat. Nanotechnol., 2009, 4, 658–663. 6 B. J. Walker, V. Bulović and M. G. Bawendi, Nano Lett.,
2010, 10, 3995–3999.
7 C. Wang and E. A. Weiss, Nano Lett., 2017, 17, 5666–5671. 8 K. A. Clark, E. L. Krueger and D. A. Vanden Bout, J. Phys.
Chem. Lett., 2014, 5, 2274–2282.
9 H. von Berlepsch, C. Böttcher, A. Ouart, C. Burger, S. Dähne and S. Kirstein, J. Phys. Chem. B, 2000, 104, 5255– 5262.
10 E. Lang, A. Sorokin, M. Drechsler, Y. V. Malyukin and J. Köhler, Nano Lett., 2005, 5, 2635–2640.
11 N. Kameta, K. Ishikawa, M. Masuda, M. Asakawa and T. Shimizu, Chem. Mater., 2012, 24, 209–214.
12 D. M. Eisele, C. W. Cone, E. A. Bloemsma, S. M. Vlaming, C. G. F. van der Kwaak, R. J. Silbey, M. G. Bawendi, J. Knoester, J. P. Rabe and D. A. Vanden Bout, Nat. Chem., 2012, 4, 655–662.
13 K. A. Clark, C. W. Cone and D. A. Vanden Bout, J. Phys. Chem. C, 2013, 117, 26473–26481.
14 J. Yuen-Zhou, D. H. Arias, D. M. Eisele, C. P. Steiner, J. J. Krich, M. G. Bawendi, K. A. Nelson and A. Aspuru-Guzik, ACS Nano, 2014, 8, 5527–5534.
15 D. M. Eisele, D. H. Arias, X. Fu, E. A. Bloemsma, C. P. Steiner, R. A. Jensen, P. Rebentrost, H. Eisele, A. Tokmakoff and S. Lloyd, Proc. Natl. Acad. Sci. U. S. A., 2014, 111, E3367–E3375.
16 J. L. Banal, T. Kondo, R. Veneziano, M. Bathe and G. S. Schlau-Cohen, J. Phys. Chem. Lett., 2017, 8, 5827– 5833.
17 H. v. Berlepsch and C. Böttcher, Phys. Chem. Chem. Phys., 2018, 20, 18969–18977.
18 S. B. Anantharaman, T. Stöferle, F. A. Nüesch, R. F. Mahrt and J. Heier, Adv. Funct. Mater., 2018, 1806997, DOI: 10.1002/adfm.201806997.
19 A. V. Sorokin, N. V. Pereverzev, I. I. Grankina, S. L. Yefimova and Y. V. Malyukin, J. Phys. Chem. C, 2015, 119, 27865–27873.
20 M. Wang, G. L. Silva and B. A. Armitage, J. Am. Chem. Soc., 2000, 122, 9977–9986.
21 K. C. Hannah and B. A. Armitage, Acc. Chem. Res., 2004, 37, 845–853.
22 C. M. Soto, A. S. Blum, G. J. Vora, N. Lebedev, C. E. Meador, A. P. Won, A. Chatterji, J. E. Johnson and B. R. Ratna, J. Am. Chem. Soc., 2006, 128, 5184–5189. 23 K. D. Volkova, V. B. Kovalska, A. O. Balanda, R. J. Vermeij,
V. Subramaniam, Y. L. Slominskii and S. M. Yarmoluk, J. Biochem. Biophys. Methods, 2007, 70, 727–733.
24 S. A. Díaz, S. M. Oliver, D. A. Hastman, I. L. Medintz and P. M. Vora, J. Phys. Chem. Lett., 2018, 9, 3654–3659.
25 H. Frauenrath, Prog. Polym. Sci., 2005, 30, 325–384.
26 A. D. Schlüter, A. Halperin, M. Kröger, D. Vlassopoulos, G. Wegner and B. Zhang, ACS Macro Lett., 2014, 3, 991–998. 27 B. Zhang, R. Wepf, M. Kröger, A. Halperin and
A. D. Schlüter, Macromolecules, 2011, 44, 6785–6792.
28 Y. Guo, J. D. van Beek, B. Zhang, M. Colussi, P. Walde, A. Zhang, M. Kröger, A. Halperin and A. Dieter Schlüter, J. Am. Chem. Soc., 2009, 131, 11841–11854.
29 C. Gstrein, P. Walde, A. D. Schlüter and T. Nauser, Photochem. Photobiol. Sci., 2016, 15, 964–968.
30 C. Gstrein, B. Zhang, M. A. Abdel-Rahman, O. Bertran, C. Alemán, G. Wegner and A. D. Schlüter, Chem. Sci., 2016, 7, 4644–4652.
31 B. Zhang, R. Wepf, K. Fischer, M. Schmidt, S. Besse, P. Lindner, B. T. King, R. Sigel, P. Schurtenberger, Y. Talmon, Y. Ding, M. Kröger, A. Halperin and A. D. Schlüter, Angew. Chem., Int. Ed., 2011, 50, 737–740. 32 S. Fornera, T. E. Balmer, B. Zhang, D. A. Schlüter and
P. Walde, Macromol. Biosci., 2011, 11, 1052–1067.
33 S. Fornera, P. Kuhn, D. Lombardi, D. A. Schlüter, P. S. Dittrich and P. Walde, ChemPlusChem, 2012, 77, 98–101. 34 A. Küchler, J. Adamcik, R. Mezzenga, A. D. Schlüter and
P. Walde, RSC Adv., 2015, 5, 44530–44544.
35 A. Küchler, D. Messmer, A. D. Schlüter and P. Walde, in Methods in Enzymology, ed. C. V. Kumar, Academic Press, 2017, vol. 590, pp. 445–474.
36 O. J. Rojas, M. Ernstsson, R. D. Neuman and P. M. Claesson, Langmuir, 2002, 18, 1604–1612.
37 L. Grebikova, S. Kozhuharov, P. Maroni, A. Mikhaylov, G. Dietler, A. D. Schluter, M. Ullner and M. Borkovec, Nanoscale, 2016, 8, 13498–13506.
38 S. H. Behrens and D. G. Grier, J. Chem. Phys., 2001, 115, 6716–6721.
39 Z. Yao and M. O. de la Cruz, Phys. Rev. E: Stat., Nonlinear, Soft Matter Phys., 2013, 87, 012603.
40 J. Ubbink and T. Odijk, Biophys. J., 1995, 68, 54–61.
41 C. C. Conwell, I. D. Vilfan and N. V. Hud, Proc. Natl. Acad. Sci. U. S. A., 2003, 100, 9296–9301.
42 M. S. Bradley, J. R. Tischler and V. Bulović, Adv. Mater., 2005, 17, 1881–1886.
43 K. A. Clark, E. L. Krueger and D. A. Vanden Bout, J. Phys. Chem. C, 2014, 118, 24325–24334.