Supporting Information
12
Supporting Figure Legends
3 4
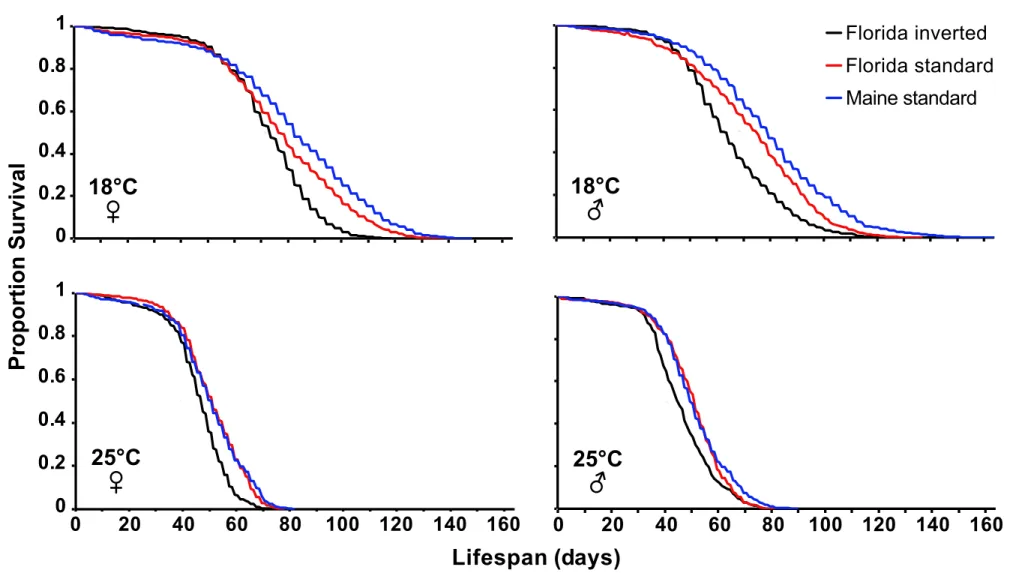
Figure S1. Survival curves as a function of In(3R)P karyotype and temperature. Effects
5
of In(3R)P and temperature (18°C vs. 25°C) on the proportion adult survival in females and 6
males. The different curves represent Florida inverted (black), Florida standard (red), and 7
Maine standard (blue). See Results, Fig. 1, and Table 1 for details. 8
9
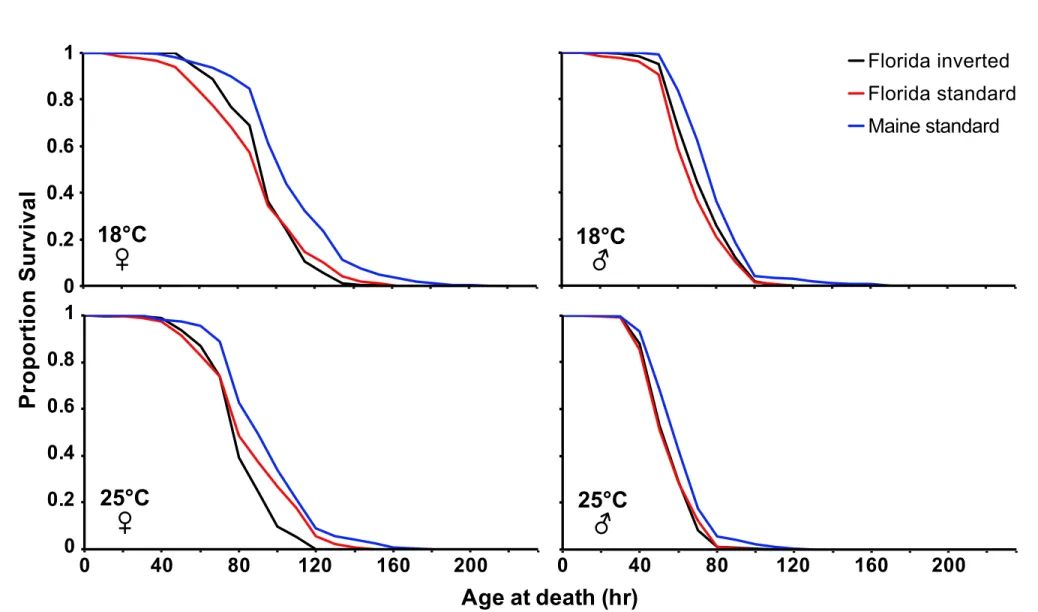
Figure S2. Starvation survival curves as a function of In(3R)P and temperature. . Effects
10
of In(3R)P and temperature (18°C vs. 25°C) on the proportion adult survival upon starvation 11
in females and males. The different curves show Florida inverted (black), Florida standard 12
(red), Maine standard (blue). See Results, Fig. 2 and Table 2 for details. 13
Figure S1 14 15 0 0.2 0.4 0.6 0.8 1 0 20 40 60 80 100 120 140 160 0 20 40 60 80 100 120 140 160
Lifespan (days)
0 0.2 0.4 0.6 0.8 125°C
♂
18°C
♂
25°C
♀
18°C
♀
Florida inverted Florida standard Maine standardProportion
Survival
Figure S2 16 17 0 0.2 0.4 0.6 0.8 1 0 0.2 0.4 0.6 0.8 1 0 40 80 120 160 200 0 40 80 120 160 200
Age at death (hr)
Proportion
Survival
25°C
♂
18°C
♂
25°C
♀
18°C
♀
Florida inverted Florida standard Maine standardA preliminary analysis of trait relationships
18
In previous work (Kapun et al., 2016b) we had shown that In(3R)P affects various proxies of 19
body size; since body size and lifespan covary positively with increasing latitude along the 20
North American east coast (e.g., Coyne & Beecham, 1987; Schmidt & Paaby, 2008), and 21
given that some non-clinal studies have found a positive relation between size and lifespan as 22
well (e.g., McCulloch & Gems, 2003 and Khazaeli et al., 2005; and references therein), the 23
question arises whether the effects of In(3R)P on lifespan might be explained by its effects on 24
size. 25
To begin to address this question we used data on female wing area (mm2), a proxy of 26
body size, collected during our experiment using the methods described in Kapun et al. 27
(2016b) (sample sizes: FI, 18°C: 265, FI, 25°C: 273; FS, 18°C: 275, FS, 25°C: 272; MS, 28
18°C: 270, MS, 25°C: 280; data at Dryad: doi:10.5061/dryad.3vb89dj). Analysis of these data 29
qualitatively confirmed that In(3R)P karyotype affects wing area, with inversion 30
homokaryons from Florida having smaller wings than standard homokaryons from both 31
Florida and Maine (mixed-effects ANOVA, karyotype: F2,23.99 = 24.57, P < 0.0001 [Tukey's 32
HDS posthoc test: FI < FS < MS, all P < 0.05]; temperature: F1,1605 = 5151.68, P < 0.0001; 33
temperature × karyotype: F2,1605 = 5151.68, P < 0.0001; variance component estimate of the 34
random effect of line[karyotype] not shown). 35
Since – for practical reasons – we could not measure wing area on the same individuals as 36
those used in the lifespan assay, we were unable to estimate the covariance between size and 37
lifespan using bivariate data collected from the same animals; we thus had to analyze the 38
relationship between these traits using line means. Because a fully factorial analysis of 39
covariance (ANCOVA) on this relatively small number of line means was likely to be 40
underpowered, we fit an ANOVA model to the residuals from a linear regression of lifespan 41
against wing area. The effect of karyotype was not significant (karyotype: F2,48 = 2.6, P = 42
0.0845; temperature: F1,48 = 2.6, P = 0.035; temperature × karyotype: F2,48 = 0.098, P < 0.90), 43
suggesting that covariation between size and lifespan might explain part of the variation in 44
lifespan among karyotypes (albeit probably not all, given the marginally non-significant P-45
value). We tentatively conclude that the effects on the assayed survival traits are affected, but 46
not driven exclusively, by the effects of karyotype on size. However, our analysis here is 47
crude and preliminary: a more refined and powerful analysis (i.e., ANCOVA) will require 48
measuring both size and age at death on the same individuals. 49
In support of the notion that In(3R)P represents a life-history supergene affecting multiple, 50
partly intercorrelated life-history traits, multivariate analysis of variance (MANOVA) showed 51
that karyotype has a significant effect on multivariate phenotype (i.e., on a linear combination 52
of size, lifespan, starvation and cold survival) (karyotype: Wilk’s λ = 0.33, approx. F8,90 = 53
8.44, P < 0.0001 [contrast inverted vs. standard, P < 0.05]; temperature: F4,45 = 110.9, P < 54
0.0001; temperature × karyotype: Wilk’s λ = 0.84, approx. F8,90 = 0.99, P = 0.45). 55
56
Supporting References
57
Coyne, J.A. & Beecham, E. 1987. Heritability of Two Morphological Characters Within and 58
Among Natural Populations of Drosophila melanogaster. Genetics, 117: 727-737. 59
Kapun, M., Schmidt, C., Durmaz, E., Schmidt, P.S. & Flatt, T. 2016b. Parallel effects of the 60
inversion In(3R)Payne on body size across the North American and Australian clines in 61
Drosophila melanogaster. J. Evol. Biol., 29: 1059-1072. 62
Khazaeli, A.A., Van Voorhies, W. & Curtsinger, J.W. 2005. The relationship between life 63
span and adult body size is highly strain-specific in Drosophila melanogaster. Exp. 64
Gerontol. 40: 377-385. 65
McCulloch, D. & Gems, D. 2003. Body size, insulin/IGF signaling and aging in the nematode 66
Caenorhabditis elegans. Exp. Gerontol. 38: 129-136. 67
Schmidt, P.S. & Paaby, A.B. 2008. Reproductive Diapause and Life-History Clines in North 68
American Populations of Drosophila melanogaster. Evolution, 62: 1204-1215. 69