HAL Id: hal-03009838
https://hal.archives-ouvertes.fr/hal-03009838
Submitted on 17 Nov 2020
HAL is a multi-disciplinary open access
archive for the deposit and dissemination of
sci-entific research documents, whether they are
pub-lished or not. The documents may come from
teaching and research institutions in France or
abroad, or from public or private research centers.
L’archive ouverte pluridisciplinaire HAL, est
destinée au dépôt et à la diffusion de documents
scientifiques de niveau recherche, publiés ou non,
émanant des établissements d’enseignement et de
recherche français ou étrangers, des laboratoires
publics ou privés.
and MUSE observations of SBS 0335-052E
Aida Wofford, Alba Vidal, Anna Feltre, Jacopo Chevallard, Stephane Charlot,
Daniel Stark, Edmund Herenz, Matthew Hayes
To cite this version:
Aida Wofford, Alba Vidal, Anna Feltre, Jacopo Chevallard, Stephane Charlot, et al.. Stars and gas
in the most metal-poor galaxies I: COS and MUSE observations of SBS 0335-052E. MNRAS, 2020,
000, pp.1 - 20. �hal-03009838�
Stars and gas in the most metal-poor galaxies I: COS and MUSE
observations of SBS 0335-052E
Aida Wofford,
1
★
Alba Vidal,
2,3
Anna Feltre,
4,5
Jacopo Chevallard,
2
Stéphane Charlot,
2
Daniel P. Stark,
6
Edmund C. Herenz,
7
Matthew Hayes
8
1Instituto de Astronomía, Universidad Nacional Autónoma de México, Unidad Académica en Ensenada, Km 103 Carr. Tijuana−Ensenada, Ensenada 22860,
México
2Sorbonne Universités, UPMC-CNRS, UMR7095, Institut d’Astrophysique de Paris, F-75014 Paris, France
3Laboratoire de Physique de l’Ecole normale supérieure, ENS, Université PSL, CNRS, Sorbonne Université, Université de Paris, F-75005 Paris, France 4INAF – Osservatorio di Astrofisica e Scienza dello Spazio di Bologna, Via P. Gobetti 93/3, 40129 Bologna, Italy
5Scuola Internazionale Superiore di Studi Avanzati (SISSA), Via Bonomea 265, I-34136, Trieste, Italy 6Steward Observatory, University of Arizona, 933 N Cherry Ave, Tucson, AZ, 85721, USA
7European Southern Observatory, Av. Alonso de Córdova 3107, 763 0355 Vitacura, Santiago, Chile
8Stockholm University, Department of Astronomy and Oskar Klein Centre for Cosmoparticle Physics, AlbaNova University Centre, SE-10691, Stockholm
Accepted XXX. Received YYY; in original form ZZZ
ABSTRACT
Among the nearest most metal-poor starburst-dwarf galaxies known, SBS 0335-052E is the most luminous in integrated nebular He ii 𝜆4686 emission. This makes it a unique target to test spectral synthesis models and spectral interpretation tools of the kind that will be used to interpret future rest-frame UV observations of primeval galaxies. Previous attempts to reproduce its He ii 𝜆4686 luminosity found that X-ray sources, shocks, and single Wolf-Rayet stars are not main contributors to the He ii-ionizing budget; and that only metal-free single rotating stars or binary stars with a top-heavy IMF and an unphysically-low metallicity can reproduce it. We present new UV (COS) and optical (MUSE) spectra which integrate the light of four super star clusters in SBS 0335-052E. Nebular He ii, [C iii], C iii], C iv, and O iii] UV emission lines with equivalent widths between 1.7 and 5 Å, and a C iv 𝜆𝜆1548, 1551 P-Cygni like profile are detected. Recent extremely-metal poor shock + precursor models and binary models fail to reproduce the observed optical emission-line ratios. We use different sets of UV and optical observables to test models of constant star formation with single non-rotating stars which account for very massive stars, as blueshifted O v 𝜆1371 absorption is present. Simultaneously fitting the fluxes of all high-ionization UV lines requires an unphysically-low metallicity. Fitting the P-Cygni like + nebular components of C iv 𝜆𝜆1548, 1551 does not constrain the stellar metallicity and time since the beginning of star formation. We obtain 12+log(O/H) = 7.45 ± 0.04 and log(C/O) = −0.45+0.03−0.04for the galaxy. Model-testing would benefit from higher spatial resolution UV and optical spectroscopy of the galaxy.
Key words: methods: statistical – techniques: spectroscopic – galaxies: dwarf – ultraviolet:
ISM – ultraviolet: stars
1 INTRODUCTION
Extremely metal-poor massive (≥ 8 𝑀 ) stars. Stars with
main-sequence (MS) masses above 20-25 𝑀 are important because they
dominate the ionizing flux of young stellar populations. Unfortu-nately, in the extremely-low metallicity regime, which is defined
as 𝑍 ≤ 𝑍 /10, where 𝑍 is the fraction by mass of metals to all
elements, the evolution of these stars and their chemical, radiative, and mechanical energy outputs are poorly understood. In this metal-licity regime, we lack observations of individual stars, in particular
★
E-mail: [email protected]
far ultraviolet (FUV) spectroscopy, which enables the character-isation of stellar wind properties and the measurement of
atmo-spheric abundances and ionizing luminosities (Garcia et al. 2014).
One looks for metal-deficient massive stars in H ii regions with a low ionized-gas O/H ratio, where O/H is the fraction by number of oxygen to hydrogen atoms. This is because i) the atmospheres of MS massive stars have metal abundances which are similar to
those of the H ii regions in which they are embeddedAsplund et al.
(2009);García-Rojas et al.(2014);Bouret et al.(2015); ii) oxygen is the most abundant metal in nearby H ii regions and optical oxy-gen lines are luminous in these regions; and iii) it is relatively easy to measure the O/H content of H ii regions from the latter lines.
Extremely metal-poor H ii regions give their name to extremely metal-poor galaxies (XMPs), which are arbitrarily defined to have
O/H ≤ (O/H) /10 in the ionized gas (Kunth & Östlin 2000), or
equivalently, using 12+log(O/H) = 8.69 as the solar reference
value (Asplund et al. 2009), 12+log(O/H) ≤ 7.56.1 Unfortunately,
the three known nearby XMPs where individual massive stars can be observed (Sextans A, SagDIG, and Leo P) are not strongly
star-forming (Camacho et al. 2016;Garcia 2018;Garcia et al. 2019;
Evans et al. 2019). Thus, their stars do not significantly cover the parameter space of mass, luminosity, effective temperature, age, ro-tation, dynamical interaction in dense massive clusters, and in the case of stars in binary systems, orbital parameters and mass ratio combinations, which is relevant for either OB-type star astrophysics or as a reference to model distant starburst galaxies. The lack of em-pirical templates for extremely metal-poor massive stars severely limits our ability to understand progenitors of gravitational-wave events, long-Gamma Ray Bursts and Supernovae of types II/Ib/Ic; the integrated light of unresolved massive star populations; and the radiative, mechanical, and chemical feedback of massive star pop-ulations. In this context, rest-frame FUV observations of super star clusters (SSCs), also known as young massive clusters (YMCs), which are located in XMPs, provide critical constraints.
Extremely metal-poor SSCs. Super star clusters are dense
aggregates of young (. 100 Myr) stars with total stellar mass
≥ 104𝑀 , which are considered to be fundamental building blocks
of galaxies (Portegies Zwart et al. 2010). In particular, the most
massive SSCs are believed to be the progenitors of today’s
glob-ular clusters (Bastian 2016). Ultraviolet observations of SSCs in
XMPs, reveal how extreme-low metallicity affects the integrated properties of massive star populations and their surrounding gas, and provide valuable constrains to spectral synthesis models, i.e., models of the integrated spectra of starlight which sometimes also include its reprocessing by interstellar gas and dust. Such models constitute the main tool for interpreting observations of unresolved stellar populations and galaxies, near and far.
XMPs in the context of future large telescopes. The James Webb
Space Telescope (JWST) and Extremely Large Telescopes (ELTs), will obtain rest-frame UV spectra of thousands of galaxies in the re-ionization era, at redshifts between 6 and 15. Spectral synthesis models will be the main tool to interpret such observations, which will challenge our understanding of galaxies with extreme low metal
content (Byler et al. 2020). Given that it only takes a few pair
instability supernovae to reach a metallicity of 2% by a redshift of
𝑧 ∼ 7 (Wise et al. 2012), it is unlikely that we will ever be able to
study distant, truly metal-free galaxies in detail. Thus, in order to understand how low metallicity affects the properties of stars and gas, it is essential to study SSCs in XMPs. Of course, XMPs are expected to also host older stellar populations which produced the oxygen that is currently present in the galaxy. This is the case in the prototypical XMP starburst, I Zw 18, which contains Red Giant
Branch stars formed at least 1 Gyr ago (Annibali et al. 2013).
Low metallicity threshold of the nearby Universe. Using SDSS
DR7,Sánchez Almeida et al.(2016) found that XMPs have a low metallicity threshold of 12+log(O/H)=7.1. This threshold corre-sponds to 1/39th (or 1/54th) of the present-day photospheric oxygen abundance of the Sun. Oxygen abundance measurements in AGC
1
Hereafter, we we use the solar reference value ofAsplund et al.(2009), which corresponds to 𝑍 = 0.0134, unless specified otherwise. We some-times give abundances in parenthesis which correspond solar reference val-ues ofCaffau et al.(2011), i.e., 12+log(O/H) = 8.83 and 𝑍 = 0.0152.
198691 (Hirschauer et al. 2016) and SBS 0335-052W (Izotov et al.
2009) push the threshold even lower to 12+log(O/H)=7.0 ± 0.03,
i.e., to 1/49th (or 1/68th) of the solar value. Interestingly, the lat-ter two XMPs have a metallicity which is similar to that of some
Damped Lyman Alpha Systems at 𝑧 ∼ 5 (Rafelski et al. 2014). The
low metallicity content of XMPs remains to be explained. It is not clear if it is due to a low time-averaged star formation rate; the pref-erential escape of oxygen from their low gravitational potential well
after type II SN explosions; accretion of metal-poor gas (Filho et al.
2015); or location in sparsely populated groups of galaxies where
inflow of IGM gas is low and tidal interactions between galaxies are rare, leading to fewer episodes of star formation.
Types of XMPs. Galaxies which have been classified as XMPs
comprise blue compact galaxies (BCGs), objects caught in a phase of substantial star-formation which appear blue and compact be-cause their star-forming regions are large relative to the galaxy’s projected size; blue compact dwarf (BCD) galaxies, which have
similar properties to BCGs, but are fainter than 𝑀B = −18 mag
(Thuan et al. 1997); dwarf irregular (dIs) galaxies, which can be considered extreme late-type spirals with large gaseous
compo-nents (Battaner & Florido 2000); and low surface brightness (LSBs)
galaxies, which are diffuse galaxies defined as having surface bright-nesses at least one order of magnitude lower than the dark night sky (Impey & Bothun 1997). These galaxies span the stellar mass range
(log 𝑀★/𝑀 = 6 − 10) and are still forming their stellar disk. Some
authors consider as "true" XMPs objects with O/H values below what is expected from their absolute blue-band magnitudes or
stel-lar masses (Ekta & Chengalur 2010;Pustilnik et al. 2016). Here we
adopt the broader definition of XMP.
How to find XMPs? Multiple methods have been used to
iden-tify XMPs.Morales-Luis et al.(2011) andSánchez Almeida et al.
(2016) searched for XMPs using spectra from the seventh data
re-lease of the Sloan Digital Sky Survey (SDSS DR7,Abazajian et al.
2009). They selected as candidate XMPs objects with weak [N ii]
lines relative to H𝛼 or strong [O iii] 𝜆4363 emission, and then mea-sured the O/H of the objects. Strong nebular [O iii] 𝜆4363 emission indicates a high electron temperature of the emitting gas, which is attributed to inefficient cooling of the gas via metal emission lines.
Based on this method, (Sánchez Almeida et al. 2016) found that
the fraction of XMPs relative to all emission line galaxies in SDSS
DR7 is only 0.01%.James et al.(2015) used a morphology-based
approach to target faint blue systems with H ii regions embedded in a diffuse continuum. Of the 12 candidate XMPs found via this approach, two were spectroscopically confirmed as XMPs. Some of the most metal-poor XMPs have been found by the Arecibo Legacy
Fast ALFA (ALFALFA,Giovanelli et al. 2005) survey, which is a
multi-wavelength study of galaxies with H i masses in the range of
106− 107𝑀 . More recently,Hsyu et al.(2018) identified 94
can-didate XMPs via photometric colours and morphologies in SDSS DR12 data, and confirmed 45 as XMPs via 3-m Lick Observa-tory and 10-m W.M. Keck ObservaObserva-tory optical spectroscopy.
Us-ing colour-colour diagrams,Senchyna & Stark(2019) uncovered 53
candidate XMPs with uniformly high specific star formation rates in SDSS imaging at magnitudes 16<i’<23, i.e. extending significantly below the completeness limits of the SDSS spectroscopic survey, and confirmed 32 as XMPs via Multiple Mirror Telescope
spec-troscopy. Finally,Kojima et al.(2019) have used a machine learning
classifier in order find XMPs candidates in Subaru/HyperSuprime-Cam optical images that are about 100 times deeper than SDSS. Spectroscopic follow up of 10 candidates confirmed three galaxies as XMPs.
Why focusing on SBS 0335-052E? Studies of the most
poor nearby XMPs in the UV face two challenges: the scarcity of suitable sources, and the difficulty of obtaining rest-frame UV spec-tra, as these require space-based observations. SBS 0335-052E is
one of the nearest (∼54.1 Mpc)2, most metal-poor (largest oxygen
abundance is 12+log(O/H)=7.338±0.012,Izotov et al. 1999)
star-burst XMP known. It is also one of most well-studied. Although it is farther and more metal-rich than the prototypical, I Zw 18, which is
located at ∼18.2 Mpc (Aloisi et al. 2007) and whose North-Western
component has 12+log(O/H)=7.17 ± 0.04 (Skillman & Kennicutt
1993), the integrated He ii luminosity of SBS 0335-052E (1.87e39
erg s−1,Kehrig et al. 2018) is larger than that of I Zw 18 (1.12e38
s−1,Kehrig et al. 2015). This makes of SBS 0335-052E a unique target to test spectral synthesis models. We recently obtained high-quality UV spectra of SBS 0335-052E, as part of our pilot program aimed at testing the combined stellar population +
photoioniza-tion models ofGutkin et al.(2016). A major goal of our program
is to understand the achievements and limitations of these models and various fitting techniques when applied to spatially unresolved observations of XMPs.
Outline of this paper. In section2, we summarize results from previous studies of SBS 0335-052E, and explain the importance
of this galaxy for extragalactic studies. In section 3, we describe
the UV and optical observations which are used in this work. In
section4, we provide evidence for massive stars being a plausible
main source of ionizing photons in the observed region of the galaxy.
In section5, we describe the models and analysis tool. We also
present results from comparing the models to the observations.
In section 6, we discuss our findings. Finally, in section 7, we
summarize and conclude.
2 SBS 0335-052E
Previous observations. Among the nearest and most metal-poor
starburst XMPs known, BCD galaxy SBS 0335-052E is one of the most well-studied along with I Zw 18, which held the record
of the most metal-poor galaxy known for a long time (Kunth &
Östlin 2000). SBS 0335-052E was discovered in the Second
Byu-rakan Survey (Izotov et al. 1990). Previous observations of SBS
0335-052E include, but are not limited to, the following wave-length ranges and telescopes/instruments: in the radio, Very Large
Array (VLA,Pustilnik et al. 2001;Johnson et al. 2009), Giant
Me-trewave Radio Telescope (Ekta et al. 2009), and Atacama Large
Millimeter Array (ALMA,Hunt et al. 2014;Cormier et al. 2017);
in the far-infrared, Herschel Pacs (Rémy-Ruyer et al. 2015); in the
mid-infrared, Spitzer MIPS and IRS (Wu et al. 2008); in the
near-infrared, Hubble Space Telescope (HST) NICMOS (Reines et al.
2008;Thompson et al. 2009); in the optical, Multiple Mirror
Tele-scope (Izotov et al. 1997), Keck II (Izotov et al. 1999), 3.6 m ESO
(Papaderos et al. 2006), Special Astrophysical Observatory (SAO,
Moiseev et al. 2010), Very Large Telescope (VLT) GIRAFFE ( Izo-tov et al. 2006), VLT FORS1+UVES (Izotov et al. 2009), VLT
Multi Unit Spectroscopic Explorer (MUSE) (Herenz et al. 2017);
in the ultraviolet, International Ultraviolet Explorer (Dufour et al.
1993), Far Ultraviolet Spectroscopic Explorer (Grimes et al. 2009),
HST FOS (Garnett et al. 1995), HST GHRS (Thuan et al. 1997),
HST Cosmic Origins Spectrograph (COSJames et al. 2014); in the
X-rays, Chandra (Thuan et al. 2004;Prestwich et al. 2013).
2
Luminosity distance from NED, based on the H 𝛼 velocity fromMoiseev et al.(2010))
Environment. SBS 0335-052E has a companion BCD, known
as SBS 0335-052W, which is separated in the east-west direction by
84", i.e., by 22 kpc at the distance adopted byPustilnik et al.(2001)
(∼ 54 Mpc). The galaxy resides not far from a rather large group,
with only ∼50 kpc in projection from an 𝐿∗spiral. The difference in
radial velocities is within the group velocity dispersion. This group
is at the border of a void (Peebles et al. 2001).
Ionized- and neutral-gas abundances and abundance ratios.
Oxygen abundance measurements in the ionized gas of SBS
0335-052E include those ofIzotov et al.(1999);Papaderos et al.(2006);
Izotov et al.(2006) andIzotov et al.(2009). The latest measurement found variations over spatial scales of ∼1-2 kpc in the range 7.11 to
7.32 dex. Table 2 ofIzotov et al.(2006) gives the relative abundances
of N, Ne, S, Cl, Ar and Fe relative to O, in the ionized gas. The difference between ionized- and neutral-gas metal abundances in
SBS 0335-052E is larger than for I Zw 18 (Lebouteiller et al. 2013;
see alsoJames et al. 2014). Finally, using the O iii] 𝜆1666 and C iii]
𝜆1909 line fluxes measured with HST’s Faint Object Spectrograph,3
Garnett et al.(1995) derive log(C/O) = −0.94 ± 0.17.
Dust and H i gas.Thuan et al.(1997) report that dust is clearly present and spatially mixed with the SSCs in SBS 0335-052E.
Ac-cording toRémy-Ruyer et al.(2015), SBS 0335-052E has the lowest
dust-to-stars mass ratio of the Dwarf Galaxy Survey ofMadden et al.
(2013) (log([𝑀dust/𝑀stars=-4.53]). It has also been found that SBS
0335-052E has a high H i to dust mass ratio for a BCD (Dale et al.
2001). Physical properties. Table 1 ofCormier et al.(2017)
summa-rizes the main physical properties of the galaxy. SBS 0335-052E is
a starburst galaxy with a total stellar mass of 5.6 × 10⁶𝑀 and a star
formation rate of 0.7 𝑀 yr−1. It also has the highest specific star
formation rate (log(𝑠𝑆𝐹 𝑅/yr)=-8.13) of the Dwarf Galaxy Survey ofMadden et al.(2013) according toRémy-Ruyer et al.(2015). At the distance of SBS 0335-052E, the detection of a red giant branch, and thus an underlying old population, is not possible.
Morphology.Thuan et al.(1997) identified six compact SSCs and a supershell of radius ∼380 pc, which delineates a large
super-nova cavity. The left panel of Figure2shows a false-colour RGB
image of SBS 0335-052E where the supershell can be seen to the NE of the overlaid circle representing the COS aperture. Using an
unsharp masking technique,Papaderos et al.(1998) discovered
sev-eral lower-luminosity (and possibly more evolved) SSCs outside of the main conglomerate of the dominant six SSCs. Hereafter, we
adopt the SSC IDs ofThuan et al.(1997) and references therein.
Importance for extra-galactic studies.Izotov et al.(1999)
ob-served a region of SBS 0335-052E which is centered on SSC 5 with the Keck II telescope. Using their emission line measurements, we find [O iii] 𝜆5007 / [O ii] 𝜆3727 = 15. Based on this ratio, SBS
0335-052E would be classified as a Green Pea (GP) galaxy (
Carda-mone et al. 2009).4 Green Pea galaxies are compact galaxies that are unresolved in SDSS images and were discovered in the citizen
science project Galaxy Zoo.5The green colour of GPs is because
[O iii] 𝜆𝜆4959, 5007 dominates the flux of the SDSS r-band, which is mapped to the green channel in the SDSS false-colour gri-band
images. As shown in later papers, e.g.Izotov et al.(2011), similar
types of nearby galaxies exist also at redshifts where they do not appear green. Green pea like galaxies are the current best nearby
analogs of high-z Lyman-alpha (Ly𝛼) emitters (LAEs), e.g.Yang
et al.(2016,2017);Jaskot & Oey(2014);Henry et al.(2015);
Izo-3
This instrument is no longer available on HST. 4
Note that in the latter paper, the authors just call them Pea galaxies. 5
tov et al.(2016). LAEs are an important population of star-forming galaxies at z > 2, increasing in fraction to constitute 60% of Lyman
break galaxies (LBGs) at redshifts z > 6 (Stark 2012), and they are
used to probe reionization, e.g.Malhotra & Rhoads(2004);Ouchi
et al.(2010);Hu et al.(2010);Kashikawa et al.(2011). LAEs resem-ble some of the faint LBGs that dominate the luminosity density
of the universe in the epoch of reionization (Herenz et al. 2019)
in size (Malhotra et al. 2012), dust, and stellar mass (Finkelstein
et al. 2010). They have high line equivalent widths, e.g. Malho-tra & Rhoads(2002);Zheng et al. (2014), indicating intense star
formation despite their comparatively low stellar masses.6 In this
context, understanding the origin of the high [O iii]/[O ii] ratio of SBS 0335-052E could shed light on some of the spectral proper-ties of GP galaxies. It is thus important to understand the dominant ionizing source in SBS 0335-052E.
Ly𝛼 properties. Interestingly,Thuan et al.(1997) andKunth et al.(2003) report an absence of strong H i Ly𝛼 emission from SBS 0335-052E, which is attributed to a combination of dust at-tenuation, redistribution of the Ly𝛼 photons by resonant scatterings over the whole area of the surrounding H i cloud, and the geometry of the cloud. Note that the column density of H i is very high, i.e.,
log[N(H i) cm−2]=20.15 (James et al. 2014). The UV spectrum of
HST program 11579 (PI Aloisi) confirms the absence of significant
Ly𝛼 emission from SBS 0335-052E, as reported in James et al.
(2014). The latter spectrum is reproduced in the top panel of
Fig-ure3.1. In addition, extended diffuse Ly𝛼 is undetected around the
galaxy (Östlin et al. 2009).Wofford et al.(2011) present Ly𝛼 line
observations of 20 star-forming galaxies with a range of morpholo-gies, oxygen abundances, and SFRs. All the galaxies in their sample
with Ly𝛼 in emission have outflows of H i gas.Rivera-Thorsen et al.
(2015) present far-UV spectroscopy of 14 strongly forming
star-forming galaxies at low redshift (0.028< 𝑧 <0.18). They find that all galaxies in their sample with Ly𝛼 escape show bulk outflow
velocities of ≥ 50 km s−1, although a number of their galaxies with
similar velocities show little or no Ly𝛼 escape.James et al.(2014)
find that in SBS 0335-052E the H i gas is outflowing at ∼ 30 km
s−1relative to the UV background in SBS 0335-052E. In summary,
SBS 0335-052E is a strongly star-forming galaxy with the oxygen line ratio of a GP galaxy, with outflowing H i gas, but with no Ly𝛼 emission.
3 OBSERVATIONS
In this section, we present HST COS and VLT MUSE spectra of SBS 0335-052E which we use to i) discuss plausible ionizing sources for the interstellar gas in the galaxy, ii) test spectral synthesis models, and iii) derive physical properties of the stars and gas.
3.1 COS spectroscopy
As part of program 13788 (PI Wofford), we obtained integrated observations of SBS 0335-052E’s SSCs 3, 4, 5 and 6, centered on SSC 5, using HST’s COS medium resolution gratings, G160M and G185M (𝜆/𝐹𝑊 𝐻 𝑀 ∼ 16, 000 − 20, 000), which cover the wavelength range from 1421 to 1950 Å (observed-frame), with some gaps due to unfilled space between the detector segments. The spectra were obtained with the circular Primary Science Aperture
6
Note that there exist bright LBGs that show strong Ly 𝛼as well as faint LBGs with no Ly 𝛼(Dunlop 2013).
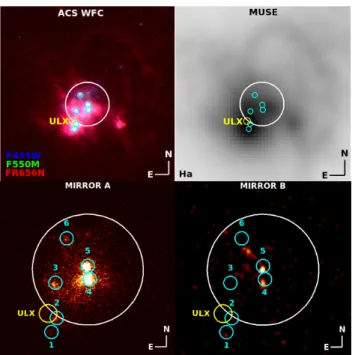
Figure 1. Top-left–. HST ACS WFC RGB image of SBS 0335-052E
com-posed from images of program 10575 (PI Öestlin). The colour scale is logarithmic. In order to enhance the northern H 𝛼 shell, the contrast and bias of the images were adjusted and the images were smoothed with a Gaussian kernel of three pixels in radius. Top-right–. MUSE H 𝛼 image obtained from the observed-frame wavelength range 6647 to 6655 Å. The colour scale is logarithmic. Bottom-left–. HST COS NUV Mirror A TA image (PID 11579, PI Aloisi). The colour scale is linear. Bottom-right–. COS NUV Mirror B TA image (PID 13788, PI Wofford). The colour scale is linear and the image is smoothed with a Gaussian kernel of three pixels in radius in order to enhance the signal from SSCs 4 and 5. In all panels: i) the largest circle (white) represents the COS PSA footprint and has a diameter of 2.5", i.e., 656 pc at the adopted distance to the galaxy; ii) the medium-sized circle (yellow) shows the location of the ULX which is reported inPrestwich et al. (2013) and has a diameter equal to Chandra’s positional uncertainty, i.e., 0.4"; and iii) the smallest circles (cyan) indicate the positions of SSCs 1 to 6 which are identified inThuan et al.(1997).
(PSA), which is 2.5" in diameter, and whose footprint on the galaxy
is shown in the left panel of Figure2. The latter figure also shows
the locations of the six SSCs identified byThuan et al. (1997),
and the ULX which is reported inPrestwich et al. (2013). Our
data extend the wavelength coverage of HST program 11579 (PI Aloisi), which uses COS G130M, also centered on SSC 5, to cover
the wavelength range ∼ 1130 − 1420 Å (observed-frame).James
et al.(2014) use UV absorption lines in the G130M spectrum to derive metal abundances in the neutral gas. In this work, we use the G130M spectrum to look for signatures of Very Massive Stars
(VMSs), which are stars with masses above 100 𝑀 (Vink 2012).
We also use the G130M spectrum to obtain a better fit to the stellar continuum and check that the flux levels of all datasets match, including the optical spectrum.
We used the following observing sequence. 1) Perform target-acquisition (TA) procedures in order to ensure that the target is well centered in the PSA. This avoids throughput losses, produces reliable wavelength zero points, and outputs an image of the target over an NUV band of wavelength range, 1700 − 3200 Å (observed-frame). In order to preserve the NUV detector, the TA image was obtained with MIRRORB, which offers an attenuation factor of ∼ 25 relative to MIRRORA. For reference, the plate scale of the NUV detector is 0.075 arcsec. 2) Obtain spectra in TIME-TAG
mode using the FP-POS=ALL setting and FLASH=YES so that the spectra can be corrected for flat-field anomalies and OSM drifts. 3) Obtain additional spectra during subsequent orbits in order to achieve the desired signal-to-noise ratio. Note that for the G130M observations, MIRRORA was used for the TA. The TA images of programs 11579 and 13788 are shown in the middle and right panels
of Figure2with the PSA footprint overlaid and the location of the
SSCs identified by the IDs ofThuan et al.(1997). In spite of the
lower SNR of our MIRRORB image, clusters 4 and 5 are clearly detected. This is expected as they are the brightest in the UV, which
can also be seen in figure 1 ofKunth et al.(2003), which shows
HST ACS F140LP and F122M UV images. According to table 2 of
Thuan et al.(1997), SSCs 1 and 2, which are located just outside of the COS aperture, are the brightest in the optical.
We retrieved the individual G160M and G185M spectral data sets from the Mikulski Archive for Space Telescopes and initially processed them on-the-fly with version 3.2.1 (2017-04-28) of the CalCOS pipeline. We also retrieved the G130M data set, which was
processed through Calcos version 3.0 (2014-10-30). Table3.1
pro-vides a summary of the observations which are presented in Figure2
and this work. CalCOS processes the data for detector noise, ther-mal drifts, geometric distortions, orbital Doppler shifts, count-rate nonlinearity, and pixel-to-pixel variations in sensitivity. A standard wavelength scale is applied using the on board wavelength calibra-tion. The G160M data fall on two detector segments, A and B. The two FUV segments are processed independently. The G185M data fall on three detector segments, A, B, and C. For each grating, mul-tiple exposures with the same grating and central wavelength are contained within a visit, these are combined into a single summed spectrum. The final products are one-dimensional, flux calibrated, heliocentric-velocity corrected, background subtracted, and com-bined spectra which are stored in x1dsum files. We worked directly with the x1dsum files. By fitting a model for the stellar continuum of a Simple Stellar Population (SSP) to the G130M + G160M + G185M data, we noted a mismatch by a factor of 1.27 between the continuum levels of the G160M and G185M observations at 1715 Å, in the wavelength region of overlap between these gratings. The Space Telescope Science institute informed us that a likely cause for this mismatch is that the COS calibration files are overestimating the loss in sensitivity in the NUV gratings, which is why the flux in the NUV G185M data is slightly lower than in the G160M data. The COS team is working on this, and hopefully will release new reference files soon. For this reason, we multiplied the G185M flux array by 1.27.
For a point-source well-centered on the PSA, the instrumental
𝐹𝑊 𝐻 𝑀values of the G160M and G185M gratings are 0.09 Å (∼18
km s−1at 1500 Å) and 0.11 Å (∼22 km s−1at 1500 Å), respectively,
as derived by multiplying the dispersions of the gratings (0.012
Å pix−1and 0.037 Å pix−1, respectively) by the sizes of the
spec-tral resolution elements of their associated detectors (6 pixels for FUV XDL and 3 pixels for NUV MAMA). Since CalCOS outputs oversampled data, we resample the data to the nominal dispersions of the gratings. Wavelength zero point shifts can occur due to imper-fect centering and the flux profiles of the galaxies in the PSA. For the data taken with G160M, it is possible to check for wavelength offsets by determining the centroids of Galactic UV absorption lines towards our targets; with the caveat that negative offsets of ≤ −50
km s−1are likely due to intermediate or high-velocity clouds (IVC
or HVC, respectively; e.g.,Wofford et al. 2011). To check for offsets,
we use the Si ii 𝜆1527 and Al ii 𝜆1671 Milky Way (MW) absorption
lines. We find velocity blueshifts of -20 and -25 km s−1,
respec-tively. We do not correct the observations for these negative offsets
which might be explained by Milky Way (MW) infalling clouds. We use the 𝐹𝑊 𝐻 𝑀 of the above two Galactic UV absorptions as the effective spectral resolution of the observations. We find 𝐹𝑊 𝐻 𝑀
values of 0.54 Å(∼106 km s−1) and ∼0.49 Å(∼89 km s−1) for Si ii
𝜆1527 and Al ii 𝜆1671, respectively, i.e., an average of 𝐹𝑊 𝐻 𝑀
value of 0.51 Å (∼97 km s−1 at 1600 Å). We use the IDL routine
gauss_smooth.pro to smooth the data in order to match the effective spectral resolution given by the MW lines.
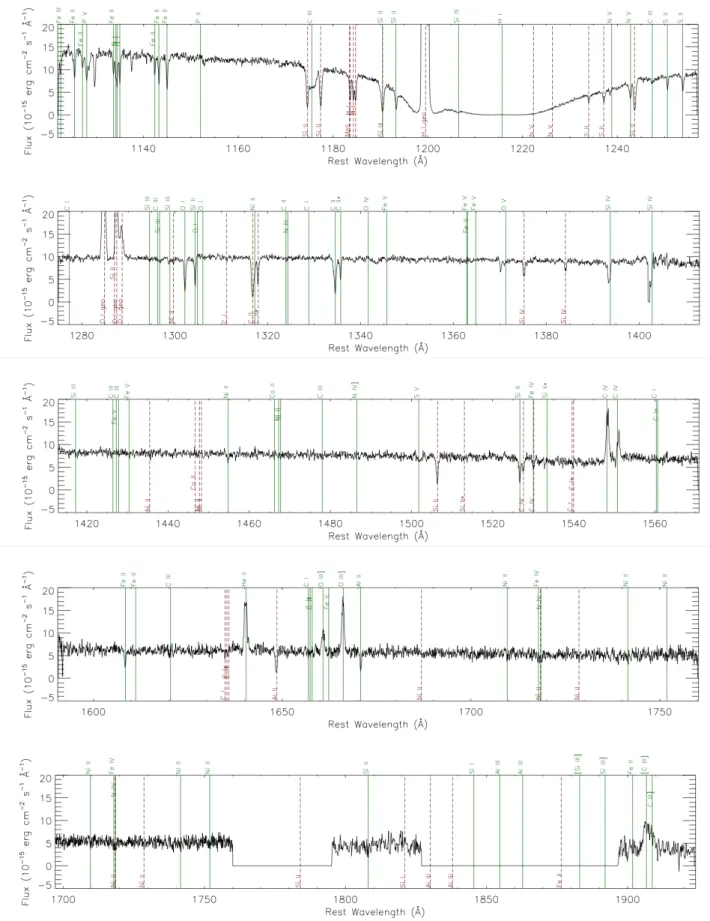
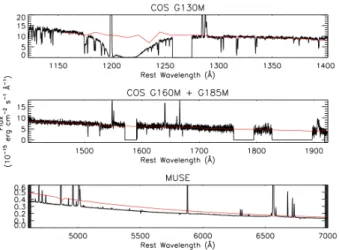
Figure3.1shows the SBS 0335-052E COS G130M + G160M
+ G185M spectra from programs 11579 and 13788. When looking at the G130M spectra, one can see the three contributions to the Ly𝛼 𝜆1216 profile: the MW Ly𝛼 absorption, the Earth’s geocoronal Ly𝛼 emission, and the Ly𝛼 absorption which is intrinsic to SBS
0335-052E and is reported inJames et al. (2014). The G130M
data also show blueshifted O v 𝜆1371 absorption, which has been attributed to the presence of VMSs in three metal-poor galaxies (Crowther et al. 2016;Wofford et al. 2014;Smith et al. 2016). The spectral morphology of O v 𝜆1371 is different than in the above galaxies owing to the much lower metallicity of SBS 0335-052E.
Since O v 𝜆1371 is observed in early main sequence (Bouret et al.
2013) and early O If stars (Walborn et al. 1985, 1995) as well
as VMS, the association of blueshifted O v 𝜆1371 with VMS in SBS 0335-052E is not definitive. By looking at the G160M and G185M data, one can see that the high-ionization UV emission lines C iv 𝜆𝜆1549, 1551, He ii 𝜆1640, O iii] 𝜆𝜆1661, 1666, and [C iii], C iii] 𝜆𝜆1907, 1909 are clearly detected. Previous lower spectral resolution observations of the C iv and O iii] doublets in SBS
0335-052E are shown in figure 1 of Dufour et al. (1993) and figure
1 ofGarnett et al.(1995), respectively. The first observation (PI Terlevich, PID NE077), was obtained with the SWP camera on board the International Ultraviolet Explorer using a 10"x20" oval aperture. It covers the wavelength range from ∼1150 to ∼2000 Å (observed frame). The second observation was obtained with
HST’s Faint Object Spectrograph using a 1" circular aperture (PI
Skillman, PID 3840). It covers the wavelength range from ∼1600 to ∼2000 Å (observed frame). With our G160M observation (0.51 Å at 1600 Å), we resolve for the first time the C iv and O iii] doublets. Finally, we detect S v 𝜆1502 absorption from the photospheres of
massive O and B stars (Walborn et al. 1985,1995;de Mello et al.
2000) at the 2𝜎 level.
3.2 MUSE spectroscopy
SBS 0335-052E was observed with VLT/MUSE (Bacon et al. 2010)
in service mode on November 16 and 17, 2015. Sky conditions were clear to photometric and the DIMM seeing FWHM varied between 0.9 and 1.2 arcsec. The total open shutter time on target was 5680 s, split into 8 × 710 s individual exposures. As recommended in the MUSE users manual, the spectrograph’s field of view was rotated
by 90◦ and small dither offsets were applied for each exposure.
For flux calibration the white dwarf GD 71 (Bohlin et al. 1995)
was observed on November 17. On the same date, a twilight flat field was taken. Each open-shutter exposure is associated to a set of calibration exposures (bias frames, lamp flats, illumination flat, and arc-lamp frames) taken closest in time.
Data reduction of the MUSE observations was performed
with the MUSE data reduction system (DRS Weilbacher et al.
2014), version 1.6.2. We first used the calibration tasks muse_bias,
muse_flat, muse_wavecal, muse_lsf, and muse_twilight to create master bias frames, trace tables and master flats, wavelength calibration tables, line spread function images, and a twilight flat datacube, respectively. With those calibration data products, we then
Figure 2. Archival G130M (PI Aloisi, PID 11579) and new G160M + G185M (PI Wofford, PID 13788) COS spectroscopy of SBS 0335-052E. From top to
bottom we show G130M/seg B, G130M/seg A, G160M/seg B, G160M/seg A, and G185M/seg A+B+C. The spectra are corrected for foreground reddening and redshift, and smoothed to the effective spectral resolution of the G160M data, i.e., 0.51 Å. Intrinsic spectral features are marked with solid-green lines and labeled at the top of each panel. Foreground features are marked with dashed-brown lines and labeled at the bottom of each panel. We use the line list ofJames et al.(2014) below 1160 Åand that ofLeitherer et al.(2011) above 1160 Å. Note the detection of blueshifted O v 𝜆1371 (plausibly from VMSs), photospheric S v 𝜆1502 from massive stars, and nebular high-ionization UV emission lines.
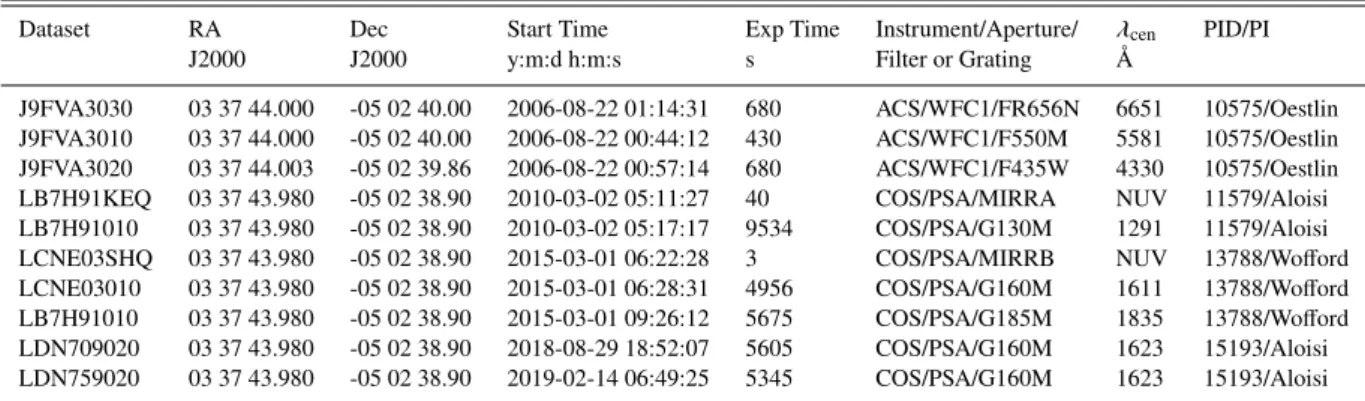
Table 1. Observation log of HST observations used in this work. Columns. (1) ID of dataset. (2) J2000 right ascension in: hours minutes seconds. (3) J2000
declination in format: degrees minutes seconds. (4) Start time of observations in format: yy-mm-dd hh:mm:ss.00. (5) Exposure time. (6) Configuration. Wavelength ranges in Å of mirrors and gratings: MIRRA & MIRRB, 1650 − 3200; G130M segments, B[1137 − 1274], A[1292 − 1432]; G160M segments, B[1421 − 1592], A[1612 − 1784]; G185M segments, A[1720 − 1753], B[1819 − 1852], C[1917 − 1950].(7) Central wavelength of filter or grating. (8) Program ID and name of PI.
Dataset RA Dec Start Time Exp Time Instrument/Aperture/ 𝜆
cen PID/PI
J2000 J2000 y:m:d h:m:s s Filter or Grating Å
J9FVA3030 03 37 44.000 -05 02 40.00 2006-08-22 01:14:31 680 ACS/WFC1/FR656N 6651 10575/Oestlin J9FVA3010 03 37 44.000 -05 02 40.00 2006-08-22 00:44:12 430 ACS/WFC1/F550M 5581 10575/Oestlin J9FVA3020 03 37 44.003 -05 02 39.86 2006-08-22 00:57:14 680 ACS/WFC1/F435W 4330 10575/Oestlin LB7H91KEQ 03 37 43.980 -05 02 38.90 2010-03-02 05:11:27 40 COS/PSA/MIRRA NUV 11579/Aloisi LB7H91010 03 37 43.980 -05 02 38.90 2010-03-02 05:17:17 9534 COS/PSA/G130M 1291 11579/Aloisi LCNE03SHQ 03 37 43.980 -05 02 38.90 2015-03-01 06:22:28 3 COS/PSA/MIRRB NUV 13788/Wofford LCNE03010 03 37 43.980 -05 02 38.90 2015-03-01 06:28:31 4956 COS/PSA/G160M 1611 13788/Wofford LB7H91010 03 37 43.980 -05 02 38.90 2015-03-01 09:26:12 5675 COS/PSA/G185M 1835 13788/Wofford LDN709020 03 37 43.980 -05 02 38.90 2018-08-29 18:52:07 5605 COS/PSA/G160M 1623 15193/Aloisi LDN759020 03 37 43.980 -05 02 38.90 2019-02-14 06:49:25 5345 COS/PSA/G160M 1623 15193/Aloisi
reduced all open-shutter exposures into so-called pixtables with the DRS task muse_scibasic. Since the instrument illumination has been shown to be temperature dependent, we ensured that we al-ways applied the illumination flats taken closest in time to the actual observation. The standard star pixtable was then fed into the task muse_standard to generate a response curve for absolute flux calibration. Thereafter, we fed the response curve and individual science exposure pixtables into the task muse_scipost, which ibrates the flux, subtracts the sky spectrum, and astrometrically cal-ibrates the pixtables. Lastly, using the DRS tasks muse_exp_align muse_exp_combine, the fully calibrated pixtables were combined and resampled onto a common 317 × 317 × 3800 grid (a so-called datacube), where the first two axis represent a spatial position on the sky (regularly sampled at 0.2 arcsec ×0.2 arcsec), and the third axis represents the spectral axis from 4600Å to 9160Å linearly sampled with 1.2 Åsteps.
The MUSE datacube of SBS 0335-052E was already exploited byHerenz et al.(2017) to discover large extended H𝛼 and [OIII] filaments in the halo of this galaxy. Owing to the unexpected large extend of nebular emission around this galaxy, the MUSE DRS sky-subtraction algorithm initially oversubtracted H𝛼 and [OIII]
emission. As described inHerenz et al.(2017), to correct for this,
the resulting output sky-spectra from the DRS were first modified by interpolation over the affected wavelengths and subsequently fed into a second iteration of muse_scipost, as input sky-spectra. The
uncorrected MUSE datacube was exploited byKehrig et al.(2018)
to show that the total He ii flux of the galaxy, including regions outside of our aperture, can only be produced by either single,
rotating metal-free stars or a binary population with Z∼10−5and a
"top-heavy" IMF.
For the present study, we use the corrected datacube to extract a spectrum at the position of HST/COS. Therefore, we summed all spectral pixels of the MUSE datacube within the COS PSA aperture. We also utilise a continuum subtracted datacube to pinpoint spatially
the faint Wolf-Rayet (WR) emission features (sec.4.4). Therefore
we subtract an in spectral direction median-filtered (filter width =
180 Å) continuum-only cube (see Sect. 4.1 inHerenz & Wisotzki
2017).
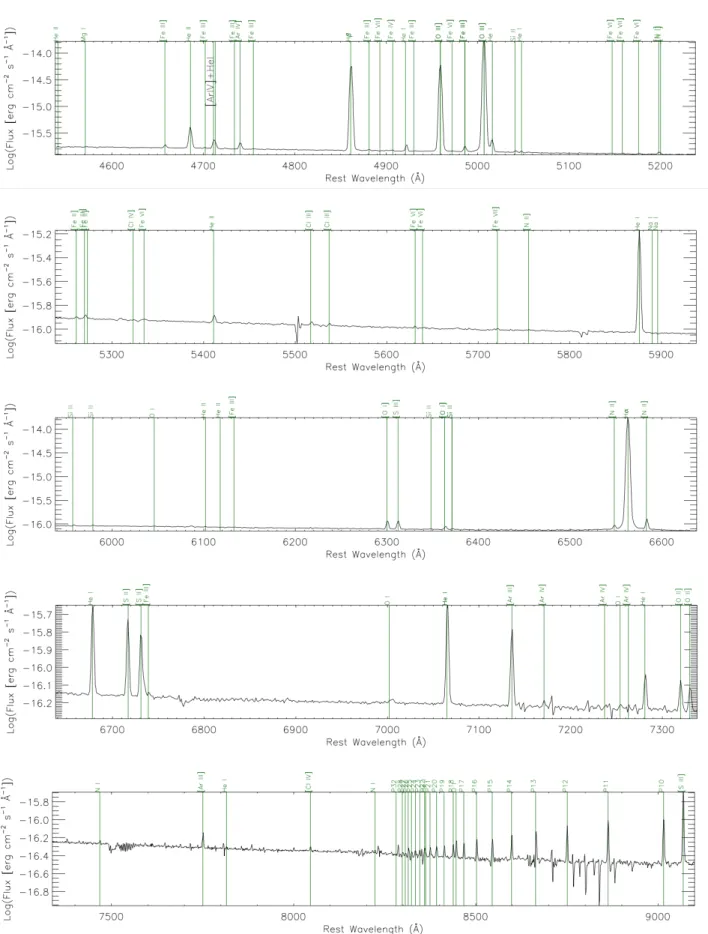
In Figure 3.2, we show the MUSE spectrum which
corre-sponds to the location and rough area of the COS aperture. The spectrum is H ii-region like. Optical high-ionization emission lines of [Ar iv] 𝜆4740, He ii 𝜆4686 and [Ar iii] 𝜆7135 are clearly detected.
Also detected are the weak [N ii] 𝜆𝜆 6548, 6584 doublet around H𝛼 and [N ii] 𝜆5755. The discussion of the WR features can be found
in sec.4.4.
In order to check if the flux levels of the co-spatial COS and MUSE spectra match, we fitted a low spectral resolution stellar + nebular continuum model (SSP, 𝑍 = 0.002, 3 Myr, non-rotating
stars), which was computed with Starburst99 (Leitherer et al. 2010)
to these data. The observations were previously corrected for fore-ground reddening, redshift and intrinsic stellar reddening using the slope of the UV stellar continuum and the SMC extinction curve.
The result is shown in Figure3.2. The model reproduces very well
the continuum in the rest-frame wavelength range from 1150 to 1909 Å and the red portion of the optical spectrum, but shows a mismatch with the observations in the blue part of the optical spectrum. We checked that the mismatch is not due to: i) differences in coordi-nates between the COS and MUSE spectral extractions (they are the same); ii) the MUSE observing conditions (which were clear); iii) vignetting of COS which reduces the NUV flux (if we add UV flux, the discrepancy worsens); iv) the radius of the MUSE spectral ex-traction aperture; v) the reddening correction (the same correction is applied to the UV and optical); or vi) binning. Since the COS aperture is fairly large compared to the 𝐹𝑊 𝐻 𝑀 of the MUSE PSF, we think that the MUSE wavelength-dependent PSF is not a big factor for the clusters near the centre of the aperture. Unfortunately, one of the four SSCs in the COS aperture is close to the edge of the PSA making the correction for the mismatch difficult. Due to this mismatch between the optical and UV continua, we use the UV and optical separately to test our models.
3.3 Spectral line measurements.
The spectra are corrected for foreground extinction using a colour excess of 𝐸 (𝐵 − 𝑉 ) = 0.047, which was obtained from the
infrared-based Galactic dust map ofSchlegel et al.(1998), by using the
reddening law (A𝜆/AV) of Mathis (1990). They are also corrected
for the redshift of the intrinsic Al ii 𝜆1671 line (𝑧 = 0.013475,
𝑣 ∼ 4038 km s−1). Note that we do not use the intrinsic redshift
of the Si ii 𝜆1526 absorption because it is contaminated with a MW C iv absorption. Our redshift measurement is in reasonable agreement with the average from several species in the neutral gas
which was measured byJames et al.(2014) using the G130M data
intrin-Figure 3. MUSE spectrum of SBS 0335-052E integrated over the COS aperture. The data are plotted with a sampling of 1.23 Å and corrected for foreground
reddening and redshift. Intrinsic spectral features are marked with solid-green lines and labeled at the top of each panel. We use the line list ofIzotov et al. (2006). Note that some of the absorption, especially in the red part of the spectrum, is caused by residuals of the sky-subtraction procedure from the pipeline. We have, as of yet, made no attempt to correct for this. The same holds for the absorption feature at 7500-7600 Å, which is a telluric absorption band.
Figure 4. Co-spatial COS and MUSE observations from 1120 to 7000 Å
cor-rected for foreground reddening, redshift, and intrinsic reddening (black curve). We overlay a Starburst99 (Leitherer et al. 2010) low spectral reso-lution stellar + nebular continuum model in red (see text for more details). There is a significant mismatch between the stellar + nebular continua of the COS and MUSE observations.
sic UV lines are done after the spectra have been re-binned and smoothed to match the effective spectral resolution, and corrected for foreground reddening and redshift. The measurements of the intrinsic optical lines are done after the spectra have been corrected for foreground reddening and redshift. The UV and optical line measurements are uncorrected for intrinsic attenuation due to dust.
Table3.3gives the rest-frame wavelengths of the main lines
which are analysed in this work along with the ionization potentials of the ions which are required to produce the lines. We obtained the centroid and 𝐹𝑊 𝐻 𝑀 of the intrinsic nebular emission and ISM absorption lines with a custom-made IDL routine which was developed by COS science team member K. France. The routine fits a first order polynomial to the continuum and a Gaussian to each line. The radial velocities corresponding to the centroids of the lines are relative to the intrinsic Al ii 𝜆1671 absorption line. The 𝐹𝑊 𝐻 𝑀
and radial velocities of the intrinsic lines are reported in Table3.3.
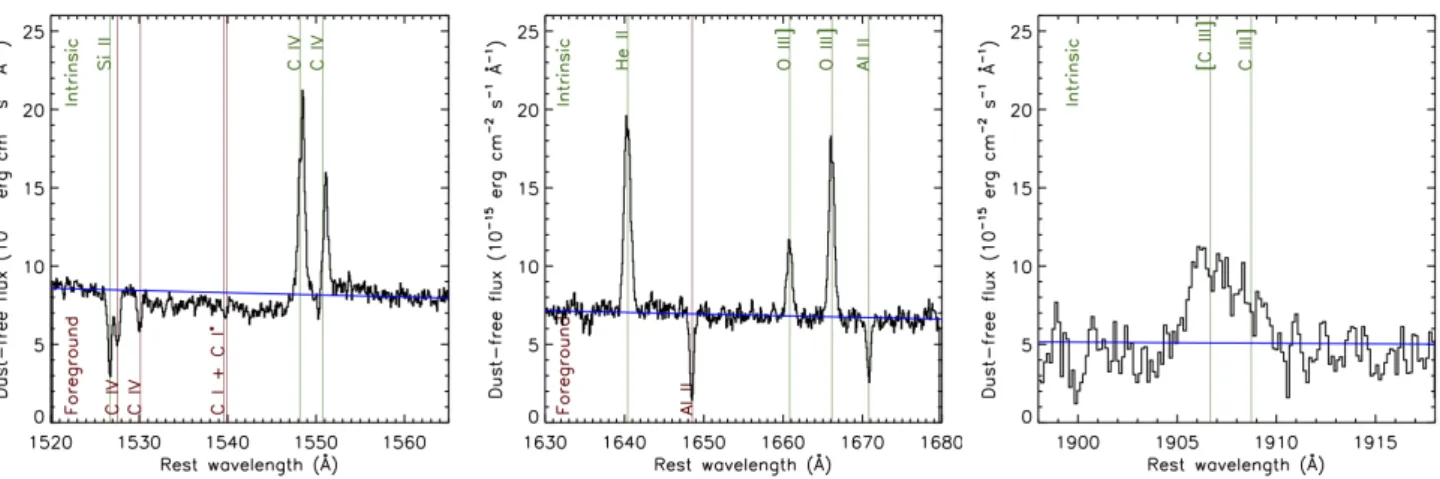
In order to enhance the signal-to-noise ratio (SNR) of weak components to C iv 𝜆𝜆1548, 1551 and He ii 𝜆1640, we obtained the average of the G160M data from programs 13788 (PI Wofford) and
15193 (PI Aloisi, see Table3.1for details), weighted by the exposure
times. This was primarily done for two purposes, to better see the P-Cygni like component to C iv 𝜆𝜆1548, 1551, and to determine if weak broad He ii 𝜆1640 emission is present. Note that broad stellar He ii emission is not necessarily expected at the metallicity of SBS
0335-052E (Gräfener & Vink 2015). The result is shown in the left
and middle panels of Figure3.3. The C iv 𝜆𝜆1548, 1551 doublet is
composed of a weak P-Cygni like profile and nebular-like emission which is redshifted relative to Al ii 𝜆1671. The redshifted C iv lines are reminiscent of the redshifted Ly𝛼 lines which are sometimes observed in Ly𝛼 emitting galaxies and are explained by radiative
transfer effectsVerhamme et al.(2012). He ii 𝜆1640 and O iii] 𝜆1666
are in pure nebular emission (𝐹𝑊 𝐻 𝑀 ∼ 158 km s−1) and at rest
relative to Al ii 𝜆1671. Note that when comparing the profiles of
He ii 𝜆1640 in Figure3.1and the middle panel of Figure3.3, one
can observe a slight increase in the amplitude of the He ii which is consistent with the observational errors. No increase in the nearby continuum of the averaged spectrum is observed.
The right panel of Figure3.3shows a close-up view of [C iii],
Table 2. Line list used in this work and their observed kinematical properties. Columns. (1) Line ID. (2) Rest-frame wavelength in vacuum (UV lines) or
air (optical lines). (3) Ion need to produce the line. (4) Ionization energy of the preceding ionization state except for the recombination He ii 𝜆1640 and 𝜆4686 lines, for which we give the ionization energy of the next ionization level, which is what matters. (5) Radial velocity of intrinsic lines (relative to Al ii 𝜆1671 for the UV and relative to H 𝛼 𝜆6563 in the optical. (6) Full width half maximum of intrinsic line.
Line ID 𝜆 rest Ion eV 𝑉r FWHM Å needed needed km s−1 km s−1 (1) (2) (3) (4) (5) (6) Si ii 𝜆1527 1526.71 Si+ 8.15 -2 92 C iv 𝜆1548 1548.19 C3+ 47.89 24 149 C iv 𝜆1551 1550.77 C3+ 47.89 56 128 He ii 𝜆1640 1640.42 He2+ 54.42 -15 158 O iii] 𝜆1661 1660.81 O2+ 35.12 7 145 O iii] 𝜆1666 1666.15 O2+ 35.12 -13 141 Al ii 𝜆1671 1670.79 Al+ 5.99 1 83 [C iii] 𝜆1907 1906.68 C2+ 24.38 - -C iii] 𝜆1909 1908.73 C2+ 24.38 - -He ii 𝜆4686 4685.71 He2+ 54.42 0 209 H𝛽 𝜆4861 4861.33 H+ 13.60 9 174 [O iii] 𝜆4959 4958.91 O2+ 35.12 8 175 [O iii] 𝜆5007 5006.84 O2+ 35.12 6 170 He i 𝜆5876 5875.59 He+ 24.6 13 144 [O i] 𝜆6300 6300.30 O0 0 10 120 [S iii] 𝜆6310 6312.10 S2+ 23.33 4 137 [N ii] 𝜆6548 6548.04 N+ 14.53 18 177 H 𝛼 𝜆6563 6562.80 H+ 13.60 10 137 [N ii] 𝜆6584 6583.46 N+ 14.53 14 123 [S ii] 𝜆6717 6716.44 S+ 10.36 11 122 [S ii] 𝜆6731 6731.18 S+ 10.36 1 128 [Ar iii] 𝜆7135 7135.80 Ar2+ 27.63 9 126 [S iii] 𝜆9068 9068.60 S2+ 23.33 22 115
C iii] 𝜆𝜆1907, 1909, for which only G185M data from program 13788 is available. The individual components of [C iii], C iii]
𝜆𝜆1907, 1909 are barely resolved. For densities lower than or equal
to 103.5cm−3, the maximum flux ratio, 𝐹 (1907)/𝐹 (1909), is
ex-pected to be ∼ 5/3 (Ferland 1981). We find that the observed value
of this ratio fluctuates around ∼ 5/3 depending on the sampling used and how we fit the continuum.
Since the G160M data from program 15193 became publicly available when we had completed most of the analysis of the present work, and since the G160M data from our program (13788) has ex-cellent SNR, the models tested in this work and the physical proper-ties which we derive use the data from our program alone. The SBS
0335-052E data from program 15193 are analysed inHernandez
et al.(2020) in the context of neutral-gas chemical abundances. Moving to the optical, the [O iii] and H𝛼 lines show narrow and broad components, but the flux of the broad component is negligible relative to the flux of the narrow component in both cases. The models which we test have a spectral sampling of 1 Å. For comparing models with observations: i) we re-sampled the COS spectra to match the sampling of the models; and we ii) re-computed the emission line fluxes, using the coarser sampling and Trapezoidal numerical integration for profiles which were non-Gaussian. The
corresponding fluxes are shown in Table3.3. For the comparison of
models with observations we define the C ive flux which includes the stellar and nebular emission, and the C iva flux, which includes the stellar absorption only. Note that the spectral resolution of the MUSE data is comparable to that of the models. Thus we do not
Figure 5. Close-up views of high-ionization UV emission lines. In the left and middle panels, we show the weighted average of the G160M data from programs
13788 (PI Wofford) and 15193 (PI Aloisi), while in the right panel we show the G185M data from program 13788. Intrinsic lines are identified at the top, while foreground lines are identified at the bottom. All spectra are smoothed to the effective spectral resolution (𝐹 𝑊 𝐻 𝑀 = 0.57 Å) and corrected for: foreground reddening using 𝐸 ( 𝐵 − 𝑉 ) = 0.047 mag and the Milky Way extinction law; redshift using 𝑧1671= 0.01349; and intrinsic reddening using 𝐸 (𝐵 − 𝑉 ) = 0.017 mag and the SMC extinction law. We overlay a power-law fit to the continuum, which is given by 𝐹 = 1.72 × 10⁹× 𝜆−2.6(blue curve). Left panel. Note that the intrinsic Si ii 𝜆1527 line is offset by only 4 km s−1while the intrinsic C iv 𝜆𝜆1548, 1551 nebular emission lines are redshifted by 44 and 68 km s−1, respectively. Also note the P-Cygni like profile of C iv. Middle panel. Note that the He ii 𝜆1640 and O III] 𝜆𝜆1661, 1666 nebular emission lines are at rest relative to the intrinsic Al ii 𝜆1671. Also note the tentative detection of excess emission on both sides of He ii. Right panel. Similar but for the region around [C iii], C iii] 𝜆𝜆1907, 1909. The components of the latter doublet are barely resolved.
recompute the optical fluxes previous to the comparison of these with the model fluxes.
4 DOMINANT SOURCE OF IONIZING PHOTONS
Izotov et al.(1997) observed SBS 0335-052E with the MMT using a 1"x181" slit. They found that the intensity of the He ii 𝜆4686 emission, integrated over the 1"x6" central region, is 3% that of H𝛽 and several orders of magnitude larger than the theoretical values predicted by models of photoionised H ii regions. They also found that in SBS 0335-052E the peak of the He ii 𝜆4686 emission is 200 pc to the NW relative to the peak of the emission of other emission lines (H𝛽, [O iii] 𝜆5007, 4363, and He i 𝜆5876). This led them to
suggest that the He+ionization is not caused by main-sequence O
stars.
Izotov et al.(2006) observed SBS 0335-052E in the spectral range 𝜆3620 − 9400 Å at 𝐹𝑊 𝐻 𝑀 = 0.5 − 1 Å, with the imaging spectrograph GIRAFFE on the UT2 of the VLT. Their observations cover a region of 11.4"×7.3". These authors produced images of the galaxy in the continuum and in emission lines of different stages of excitation, with a spatial scale of 0.52"/pixel; and arrived to the same
conclusion asIzotov et al.(1997). Indeed, they found that while the
maximum of emission in the majority of lines, including the strong lines H𝛽 𝜆4861, H𝛼 𝜆6563, [O iii] 𝜆𝜆4363, 5007, [O iii] 𝜆𝜆3726, 3729, coincides with the youngest south-eastern SSCs 1 and 2, the emission of He ii 𝜆4686 line is offset to the more evolved north-west SSCs 4 and 5. This finding and the fact that the velocity dispersion of the He ii 𝜆4686 line is systematically higher, by ∼ 50 − 100%, relative to the other lines led the latter authors to suggest that the hard ionising radiation which is responsible for the He ii 𝜆4686 emission is not related to the most massive youngest stars, but rather to fast radiative shocks. In this section, we investigate if HMXB, accreting intermediate-mass black holes (IMBHs), fast-radiative shocks, WR stars, or simple stellar populations which account for massive star
evolution in close binaries could be responsible for the He ii 𝜆4686 and He ii 𝜆1640 emission towards the older SSCs 4 and 5.
4.1 High-mass X-ray binaries.
Garnett et al.(1991) suggested that X-rays produced by massive X-ray binaries could be a source of ionization in H ii regions.
Ac-cording toIzotov et al.(1997), ∼ 4000 HMXBs would be required
to explain the high luminosity of He ii 𝜆4686 (5.74×1038erg s−1) in
SBS 0335-052E. They obtained this number of HMXBs by directly scaling from the observed luminosity of the nebula surrounding
LMC X-1, at He ii 𝜆4686, which is 1.5 × 1036erg s−1 (Pakull &
Angebault 1986). The equivalent number of O7 stars that these
authors inferred from the H𝛽 luminosity (2.06 × 1040erg s−1) is
∼ 5000. However, in a deep Chandra observation of the galaxy,
Thuan et al.(2004) detect a faint X-ray point source (29 counts,
𝐿𝑋= 3.5 × 1039erg s−1) lying ∼ 0.3” north of SSC 2. This source
is consistent with only two HMXB according to table 1 ofDouna
et al.(2015). Although the position of the X-ray maximum in the galaxy is no more accurate than 0.42", it is consistent with the X-ray source being physically associated with SSC 2. The timescale for HMXB formation of 3-10 Myr after the onset of the starburst is
consistent with the ages of SSCs 1 and 2 (3 Myr,Reines et al. 2008;
Adamo et al. 2010). By re-analysing the above Chandra
observa-tions,Prestwich et al.(2013) confirm that the X-ray point source
which is mentioned above corresponds to an ultra-luminous X-ray
source (ULX), i.e., a source having 𝐿X >1039erg/s. We use the
coordinates of table 5 inPrestwich et al.(2013) to find the location
of the ULX relative to our COS aperture. The location is indicated by the yellow circles at the southern edge of the COS footprint in Figure 1. If the ULX is responsible for the extended He ii emission in SBS 0335-052E, one needs to explain why the estimated location of the ULX is a few hundred parsecs away from the peak of the He ii emission and completely discard other sources of ionization.
Izotov et al.(1997) note that the elongated shapes of the faint X-ray contours in the Chandra image, to the north of SBS
Table 3. Observed fluxes and equivalent widths of high-ionization UV emission lines. Columns. (1) Line ID. (2) Wavelength limits of regions defining the left
continuum, line, and right continuum. (3) Flux corrected for foreground reddening as described in sub-section3.1. (4) Flux error. (5) Rest-frame equivalent width. (6) Equivalent-width error. (7) Method used for obtaining the flux (T=Trapezoidal numerical integration, G=Gaussian fitting). Method T is adopted for non-Gaussian line profiles. The errors were obtained using error propagation.
Line ID Wavelength ranges 𝐹 𝜎𝐹 𝐸 𝑊 𝜎𝐸 𝑊 Method
Å erg / s / cm2 erg / s / cm2 Å Å
(1) (2) (3) (4) (5) (6) (7)
C iva 1550 1516.4,1522.4,1540.4,1547.4,1561.4,1567.4 -6.14E-15 4.58E-16 -0.9 0.1 T C ive 1550 1516.4,1522.4,1547.4,1552.0,1561.4,1567.4 1.15E-14 4.63E-16 1.7 0.2 T He ii 𝜆1640 1627.0,1632.0,1632.0,1650.0,1650.0,1655.0 1.02E-14 5.21E-16 1.7 0.3 G O iii] 𝜆1661 1653.0,1659.0,1659.5,1662.1,1673.0,1677.0 3.90E-15 4.59E-16 0.7 0.1 G O iii] 𝜆1666 1653.0,1659.0,1664.8,1667.5,1673.0,1677.0 9.02E-15 4.93E-16 1.5 0.1 G [C iii], C iii] 𝜆𝜆1907, 1909 1897.0, 1903.0,1903.0,1912.0,1911.0,1920.0 1.83E-14 1.35E-15 5.0 0.8 T He ii 𝜆4686 4675.0, 4680.0, 4680.0, 4690.0, 4690.0, 4695.0 1.62E-15 4.12E-17 4.5 0.0 G [Ar iv] 𝜆4740 4720.0, 4725.0, 4737.5, 4743.5, 4745.0, 4750.0 3.89E-16 1.41E-17 1.0 0.0 G H𝛽 𝜆4861 4845.0, 4850.0, 4855.0, 4868.0, 4870.0, 4875.0 4.20E-14 8.72E-16 130.3 0.5 G [O iii] 𝜆4959 4946.0, 4951.0, 4952.0, 4966.0, 4967.0, 4972.0 4.64E-14 9.60E-16 148.1 0.6 G [O iii] 𝜆5007 4990.0, 4995.0, 5001.0, 5012.0, 5020.0, 5025.0 1.39E-13 2.86E-15 461.7 1.8 G He i 𝜆5876 𝜆5860.0, 5865.0, 5871.5, 5880.5, 5883.0, 5888.0 4.23E-15 9.23E-17 21.2 0.1 G [O i] 𝜆6300 6280.0, 6290.0, 6298.0, 6303.0, 6320.0, 6330.0 2.90E-16 9.15E-18 1.6 0.0 G [ S iii] 𝜆6310 6290.0, 6295.0, 6309.5, 6315.0, 6320.0, 6325.0 2.77E-16 8.78E-18 1.6 0.0 G [N ii] 𝜆6548 6520.0, 6525.0, 6545.0, 6550.0, 6600.0, 6605.0 1.17E-16 6.09E-18 0.8 0.0 G H 𝛼 𝜆6563 6520.0, 6525.0, 6552.0, 6570.0, 6600.0, 6605.0 1.23E-13 2.53E-15 777.2 3.0 G [N ii] 𝜆6584 6520.0, 6525.0, 6581.0, 6587.0, 6600.0, 6605.0 3.40E-16 9.99E-18 2.4 0.0 G [S ii] 𝜆6717 6708.0, 6713.0, 6713.5, 6720.5, 6721.0, 6725.0 8.27E-16 2.00E-17 5.3 0.0 G [S ii] 𝜆6731 6721.0, 6725.0, 6727.5, 6734.5, 6735.0, 6740.0 6.65E-16 1.66E-17 4.2 0.0 G [Ar iii] 𝜆7135 7120.0, 7125.0, 7132.0, 7141.0, 7150.0, 7155.0 8.22E-16 2.00E-17 6.5 0.0 G [S iii] 𝜆9068 9057.0, 9062.0, 9063.0, 9074.0, 9075.0, 9080.0 1.45E-15 3.37E-17 21.6 0.2 G
052E, suggest that there may also be X-ray emission associated with SSC 3 and the pair 4 + 5. There is also a very faint X-ray source to the northeast that appears to be associated with the supernova cavity seen in the optical image. Excluding the source near SSC 2, the total X-ray emission of the fainter features is ≤ 23 counts, making it virtually impossible to distinguish between point-like and truly extended.
More recently,Kehrig et al.(2018) re-analized the above
Chan-dra data. By covolving model-dependent observed X-ray
luminosi-ties with the energy-dependent cross section of He+, they estimate
the effective X-ray ionizing power. When Kehrig et al. extrapolate from the X-Ray to 4 Rydberg, they infer log Q(He ii) ∼ 36, while the observed optical He ii line flux requires log Q(He ii) ∼ 51. This is a discrepancy of 15 orders of magnitude. The discrepancy is not resolved, if one considers only the diffuse extended He ii.
4.2 Accreting IMBHs
Intermediate-mass black holes (102−106𝑀 ) are expected to reside
in low-mass, star-forming dwarf galaxies that have not significantly grown through mergers/accretion. The detection of unresolved X-ray emission, in some cases spatially coincident with jet/core radio emission, constitutes the most compelling signature of an accret-ing BH in the absence of dynamical mass measurements (typically limited to the Local Group in the case of dwarf galaxies) and has pro-vided evidence for their presence in a few tens of low-mass galaxies (Mezcua et al. 2016). There is no evidence from the combination of
radio (Johnson et al. 2009) and X-ray (Thuan et al. 2004;Prestwich
et al. 2013) data that there is an IMBH in SBS 0335-052E. But where does SBS 0335-052E fall on optical diagnostic diagrams for separating star-forming galaxies from AGN?
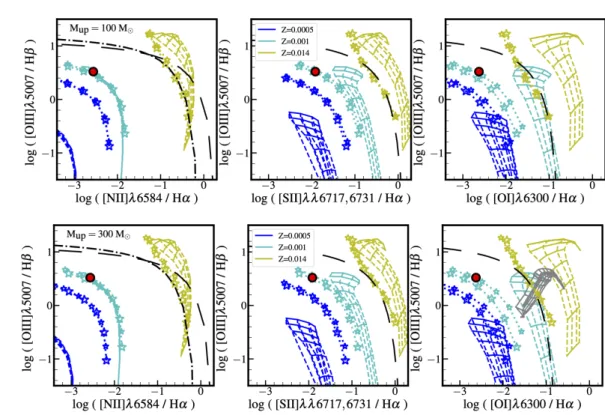
The position of SBS 0335-052E in the optical diagnostic
dia-grams ofBaldwin et al.(1981) andVeilleux & Osterbrock(1987)
is given by the red circle in Figure4.2. We overlay models of giant
H ii regions ionized by simple stellar populations (SSPs) computed byGutkin et al.(2016, stars), and narrow-line region AGN models
computed byFeltre et al.(2016, dashed-curves). The upper mass
limit of the IMF is 𝑀up = 100 𝑀 for the upper row and 300 𝑀
for the bottom row. There are no significant differences between the H ii-region models of the top and bottom panels. Most importantly, at extreme-low metallicity (dark-blue and cyan models), the AGN models (dashed lines) are located on the star-forming zone set by
Kewley et al.(2001). Furthermore, the AGN and star-forming mod-els overlap in the first diagnostic diagram (first column) at Z=0.001, and the last diagnostic diagram (last column) at Z=0.0005. Thus, at the metallicities of XMPs, these optical diagrams are not useful for separating AGN from star-forming regions. Note that the SSP + H ii region models of 𝑍 = 0.001 approach the SBS 0335-052E ob-servation in the three optical diagnostic diagrams.
Feltre et al.(2016), computed predictions of high-ionization UV emission lines from narrow line region models of AGN and pro-posed diagnostic diagrams for separating AGN from star-forming galaxies which are based on UV emission-line ratios. These dia-grams separate better star-forming galaxies from AGN at extreme low metallicities, as can be seen in the diagrams which are shown
in Figure4.2. In the latter figure, the left and right panels show
SSPs with 𝑀up= 100 𝑀 and 300 𝑀 , respectively. Although the
association of blueshifted O v 𝜆1371 with VMSs is not definitive, models with VMSs are more likely to reproduce the fluxes of UV high-ionization lines than models with an upper mass limit of 100 𝑀 (Gutkin et al. 2016), which is why we test them in this work.
Only the Z=0.0005 and 𝑀up = 300 𝑀 SSP + H ii region model
approaches the UV line ratios of SBS 0335-052E. However, the closest model has nebular + broad He ii 𝜆1640 emission. As
al-Figure 6. Location of SBS 0335-052E (red filled circle) in the optical diagrams ofBaldwin et al.(1981) andVeilleux & Osterbrock(1987) for separating narrow-line AGN from H ii region-like galaxies. The observational errors are smaller than the symbol size. In the left-panel diagrams, the main excitation mechanism is star formation if the galaxy lies below the dotted-dashed black curve (Kauffmann et al. 2003), an AGN if the galaxy lies above the long-dashed black curve (Kewley et al. 2001), and a mixture of star formation and Seyfert nucleus, or star formation and LINER, if the galaxy lies between these curves (Kewley et al. 2006). We overlay: (i) narrow-line AGN models ofFeltre et al.(2016) (dashed lines intersected by solid lines); and (ii) SSP H ii region models ofGutkin et al.(2016) (stars connected with dotted lines). Models (i) and (ii) correspond to ionization parameters from -1.5 to -4 (H ii regions) and -1.5 to 5 (AGN, increasing from bottom to top), three values of the interstellar metallicity (as colour-coded by the legends of the middle panels), a dust-to-metal mass ratio of 𝜉d= 0.3, and hydrogen gas densities of 𝑛H= 102(H ii regions) and 103cm−3(AGN). We show H ii region-like galaxies with: ages of 106and 106.5 yr (small and big stars, respectively); IMF upper mass limits of 100 and 300 M (top and bottom rows, respectively); and a C/O ratio of 0.72 (C/O) .
ready mentioned, broad He ii emission is not necessarily expected at the low metallicity of SBS 0335-052E, and in this galaxy it is not
observed (see Figure3.3).
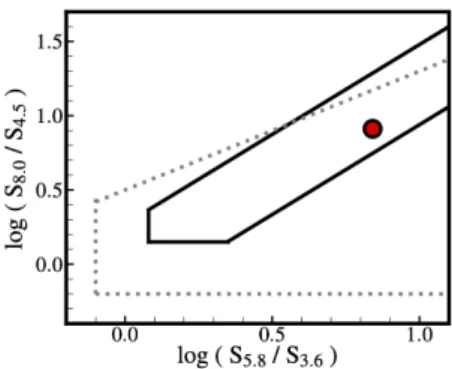
We now discuss some of the IR properties of SBS
0335-052E in the context of this subsection. In Figure 4.2 we show
that SBS 0335-052E falls within the wedges ofLacy et al.(2004)
andDonley et al.(2012) that select AGN in the Spitzer/IRAC
colour-colour diagram. The position of SBS 0335-052E in Figure4.2is
attributed to an IR excess due to warm dust. Figure 1 ofHouck et al.
(2004) shows the Spitzer IRS spectrum of SBS 0335-052E. The
latter authors say that if the mid-IR spectrum of SBS 0335-052E is representative of star-forming galaxies at higher redshifts, it may be difficult to distinguish between galaxies whose emission is dom-inated by star-formation and AGN, as the latter case is associated with a relatively featureless flat spectra in the mid-IR.
4.3 Fast radiative shocks from SNRs
Garnett et al.(1991) suggested that radiative shocks produce strong He ii emission under certain conditions. The strength of such emis-sion is sensitive mostly to the velocity of the shock, reaching a
maximum for 𝑉shock ∼ 120 km s−1, dropping rapidly at higher
velocities.
The FUSE spectrum of SBS 0335-052E which is presented in
Grimes et al.(2009) shows no O vi in emission at 1032-1038 Å, which at higher metallicities is generally interpreted as an indication
of the presence of shocked gas from SNRs (Rasmussen & Martin
1992;Allen et al. 2008). For reference, the size of the FUSE aperture is 25"x25". It is not clear if the absence of O vi in emission is due to a combination of the low metallicity of the galaxy and the strong nearby Ly𝛽 absorption.
Kehrig et al.(2018), analysed the MUSE spectra of SBS 0335-052E but did not correct for the fact that the MUSE DRS sky-subtraction algorithm initially oversubtracted H𝛼 and [O iii]
emis-sion (see our Section3.2). Thus, we expect their flux measurements
of the above lines to suffer from this oversubtraction. They find no high ratios of [S ii]/H𝛼 and/or [O i]/H𝛼 in SBS 0335-052E. At higher metallicities, high values of the latter ratios indicate the pres-ence of shock-excited gas.
Figure 6 ofAlarie & Morisset(2019), shows optical emission
line ratios for shock + precursor models of extremely low metal-licity in the right panel. Note that what is actually plotted in that figure is log([OIII]5007/H𝛽) and log([NII]6584/H𝛼) (private
com-munication). At SMC metallicity, the models ofAlarie & Morisset
(2019) are in excellent agreement with the similar models ofAllen
et al.(2008). However, SMC metallicity is the lowest metallicity
which is available for the models ofAllen et al.(2008) and this
is higher than the known metallicity of SBS 0335-052E. Thus, we
compare against the models ofAlarie & Morisset(2019). We find
that the optical ratios of SBS 0335-052E, log([OIII]5007/H𝛽)=0.52 and log([NII]6584/H𝛼)=-2.56, are incompatible with the values of
Figure 7. Location of SBS 0335-052E (red filled circle) in the UV diagnostic diagram, C iv (𝜆1549 + 𝜆1551) / He ii 𝜆1640 versus O iii] (𝜆1661 + 𝜆1666) / He ii
𝜆1640. The observational error bars are smaller than the symbol size. We use the same models and colour scheme as in Figure4.2. The upper mass limit of the stellar IMF is 100 M in the left panel and 300 M in the right panel.
Figure 8. Wedges of Lacy et al., 2004 and Donley et al., 2012 (dashed
gray and continuous black lines, respectively) that select AGN in the
Spitzer/IRAC colour-colour diagram. The non-dashed line represents a more
strict cut. SBS 0335-052E (red symbol) would be selected as an AGN based on this diagram. We use the data from the IRAC 3.8“ aperture which is provided by NASA/IPAC Extragalactic Database (NED).
the extremely low metallicity shock + precursor models ofAlarie
& Morisset(2019).
4.4 Wolf-Rayet stars.
Wolf-Rayet (WR) stars are the evolved descendants of stars with
initial masses of > 25 − 30 𝑀 . They are divided into two classes,
those with strong lines of He and N (WN class) and those with strong He, C, and O (WC and WO class). Depending on the relative intensities of their N or C lines, these classes are further divided into subtypes. WN spectral subtypes follow a scheme involving line ratios of N iii- v and He i- ii, ranging from WN2 to WN5 for early WN (WNE) stars, and WN7 to WN9 for late WN (WNL) stars. WC spectral subtypes depend on the line ratios of C iii and C iv lines along with the appearance of O iii- v, spanning WC4 to WC9 subtypes, for which WC4 − 6 stars are early (WCE) and WC7 − 9 are late (WCL). Rare, O-rich WO stars form an extension of the WCE sequence, exhibiting strong O vi 𝜆𝜆 3811 − 34 emission. A review of the spectral and physical properties of these stars is provided in
Crowther(2007).
Schaerer & Vacca(1998) modelled the nebular and WR He ii
𝜆4686 emission in young starbursts with metallicities between 0.2
and 1 times 𝑍 , and predicted a strong nebular He ii 𝜆4686 emission
due to a significant fraction of WC stars in the early WR phases of the burst. Based on the fact that observations of extreme-low metallicity
young starbursts lack broad WR-like emission features,Izotov et al.
(1997) excluded WR stars as the explanation for the intense He ii
𝜆4686 emission in SBS 0335-052E. However, more recent works
have reported tentative detections of WR stars in SSC 3, which is within the COS aperture.
Papaderos et al.(2006) observed the galaxy with a 1.2" wide slit at the 3.6 ESO telescope. They report the tentative detection of WC4 (early carbon-type WR) stars in SSC 3, which is within our COS aperture. The evidence is a broad emission feature which is coincident with the [Fe iii] 𝜆4658 nebular emission line but has a width much larger than those of other nebular emission lines in
the spectrum of SSC #3. (Papaderos et al. 2006) interpret this broad
feature as due to C iv 𝜆4658, which is a signature of WC4 stars. From this feature, corrected for [Fe iii] 𝜆4658 emission, they estimate a total number of ∼22 WC4 stars. Given the derived number of O7V stars (∼ 800), the ratio of WC4 to O7V stars they find is consistent with the stellar population synthesis models at solar metallicity.
Papaderos et al.(2006) point out thatCrowther(2007) showed that the line luminosities of extremely low-metallicity WC4 stars are 3-6 times lower than those predicted by the above models, which would increase the number of WC4 stars to 70-130. However, the latter authors say that in order to confirm the detection of WC4 stars and to better determine their number, better observations of the C iv
𝜆5808 emission line are required. Finally,Papaderos et al.(2006)
found: weak N iii 𝜆4640 and He ii 𝜆4686 emission in SSC 3, thus the determination of the number of WNL stars was not possible; and no WR features in regions 1, 2, 4, and 5.
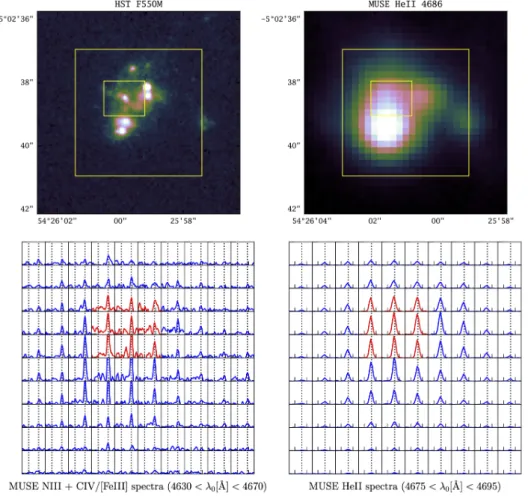
We used the MUSE spectra to further investigate the presence of WR stars. For this purpose, we extracted a smaller datacube
around SSC 3. The results are shown in Figure4.4. The data show
that WC4 stars could be present in the vicinity of SSC 3. However, we find no evidence of C iv 𝜆5808 emission in the vicinity of this
SSC. As previously mentioned,Kehrig et al.(2018) independently
analysed the MUSE data (uncorrected for the initial MUSE DRS sky-oversubtraction). They found a WR knot in SBS 0335-052E. However, their analysis of the data discards single WR stars as the dominant source of He ii ionization.
4.5 SSPs with massive stars in close-binary systems
There is observational evidence that massive stars are in binary systems with close to 70% interacting over the course of their