Introducing wwhypda: a world-wide collaborative hydrogeological
parameters database
Alessandro Comunian&Philippe Renard
Abstract Since the seminal publication of Henry Darcy’s work in the 1880s, a very large number of rock property values (such as hydraulic conductivity, permeability, compressibility, porosity, etc.) has been measured and published. These data are, however, dispersed and difficult to access. To overcome this problem and to facilitate site characterization (especially stochastic), a worldwide hydrogeological parameter database (wwhypda) is pro-posed. It is an open and collaborative catalog allowing users to store and retrieve measurements. The catalog is accessible through a web interface (http://wwhypda.org). Presently, it provides individual values and probability density functions of the properties as a function of lithology, scale of observation, location, and geological environment.
Keywords Heterogeneity . Hydraulic properties . Statistical modeling . Tracer tests
Introduction
Since the first experiments of Henry Darcy, published in 1856, and for more than a century, experiments have been designed and conducted at different scales and all around the world to characterize not only hydraulic conductivity or intrinsic permeability, but also porosity, specific storage or compressibility of earth materials. Large-scale equiva-lent properties have been obtained by calibrating regional aquifer models. All these experiments and their interpre-tations have been published in articles, books or technical
reports and in different fields such as hydrogeology, petroleum engineering or civil engineering.
In addition, many national geological surveys are centralizing geological and groundwater data within national databases or geographical information systems (GIS). These data sets are available upon request (Allen et al. 1997; Jones et al. 2000), or via Web interfaces—for example, the Canadian geospatial data infrastructure (CGDI 2007), the ADES groundwater national portal in France (ADES 2008), or the Ground Water Atlas of the United States by the United States Geological Survey (US Geological Survey 2000). Similarly, GIS databases are often developed to facilitate data management within specific consulting or research projects (Barazzuoli et al. 1999; Gogu et al. 2001). From a research perspective, there are also initiatives to manage site specific datasets in a standardized format in order to ensure their long term availability and to facilitate the collaboration among various research teams (de Dreuzy et al. 2006). In this last case, the aim is to improve the efficiency and the quality of the research, rather than to initiate a public service such as more general databases provided by geological surveys.
Parallel to the acquisition of datasets of parameter values, the analysis and modelling of their spatial distribution have evolved significantly thanks to the development of geostatistical theoretical frameworks (Matheron 1962; Dagan 1989; Gelhar 1993; Chiles and Delfiner 1999; Rubin 2003; de Marsily et al. 2005). Therefore, in addition to the physical parameter values themselves, corresponding statistical parameters which describe their distributions and their spatial continuities (covariance functions) have also been collected from a large number of test sites worldwide (see for example Rubin2003 for a review).
Despite these efforts, in most sites where a hydro-geological study is to be conducted, there is still a limited amount of data available to characterize the site. This is especially true and poses a problem when one considers the first stages of a new study. Anderson et al. (1999) estimated that, in most cases, less than 1% of the total volume of an aquifer is directly sampled. Even at the most extensively studied sites, the volume of the aquifer that is directly sampled remains small. In their detailed study of a braided alluvial system, Anderson et al. (1999) estimated Received: 21 December 2006 / Accepted: 15 October 2008
Published online: 22 November 2008 *Springer-Verlag 2008 A. Comunian ())
:
P. Renard Centre d’Hydrogéologie, Université de Neuchâtel, Neuchâtel, Switzerland e-mail: [email protected] Tel.: +41-32-7182607 Fax: +41-32-7182603 P. Renard e-mail: [email protected]this sampled volume to be around 20–40% of the total volume if they include the geophysical measurements.
In addition, in most practical situations it is necessary to cope with uncertainties because of the lack of data. This is why the use stochastic techniques as one component of a general framework to manage hydrogeological projects is widely recognized among researchers (Freeze et al. 1990), even if the application of stochastic techniques in daily practice is still limited. The reasons for such limitations are diverse and include many practical and theoretical aspects (Dagan 2002; Zhang and Zhang2004; Renard 2007). However, several authors have suggested that one step to facilitate the use of stochastic techniques would be to provide a catalog of statistical properties of the different parameters and of the structures of heteroge-neity that are typical of different geological environments (Dagan2002; de Marsily et al.2005).
Such a catalog would be useful both in a stochastic and deterministic framework. It could answer questions such as: What is the order of magnitude of intrinsic perme-abilities in a fine sandstone? What is the most probable value for the porosity of pillow lavas in an ophiolitic environment? Or what should be a safe value for the variance of the hydraulic conductivity in fractured sandstone to design a pump-and-treat system? It could provide parameter distributions to use as priors or plausibility terms for inverse problem solving (Tarantola 2005; Alcolea et al. 2006). It could also provide training images describing the typical spatial arrangement of different rock types in a given geological environment that could be used as input for multiple-point simulation algorithm (Strebelle 2002; Journel and Zhang2006).
The aim of this article is to describe afirst attempt at providing such a“world-wide hydrogeological parameters database” (wwhypda). It is based on open source technology to allow a wide distribution and free access via Internet. The idea is not to offer a substitute for local investigation but a well-documented complement of information when there is a lack of data. In addition, an important concept is that such a catalog needs to be supported by a broad community and should therefore be based on a collaborative web site in which users can provide data. This article presents the main features and the structure of wwhypda.
Main wwhypda features
wwhypda is designed to store values of the most important properties of earth materials, and to relate them either to a specific material or to a hydrogeological environment. These values can then be post-processed automatically to extract statistical moments or full probability density functions (Fig. 1a). To allow such type of queries, the database contains an extensible catalog of typical rock types and typical geological environments.
Because the aim of wwhypda is to provide essentially statistical distributions of rock properties that can be borrowed from one site to be used in another site, the
exact location of the measurement is not crucial. There-fore, wwhypda is not based on a GIS, even if optional information about the measurement site location can be stored. For the same reason, time dependent data such as time series of piezometric heads are not considered in the present work.
In terms of its usage, wwhypda is available via a Web interface. Anybody can consult the database, download it, or add data, under the terms of an open licence which ensures that wwhypda is and will be freely available. More precisely users are free to consult, copy, distribute, display, and make use of the database, provided that a proper reference is made to the wwhypda project (detailed license terms are provided online).
Finally, a key feature of wwhypda is that it provides an interface which allows users to contribute. The only requirement is a registration step, which allows user contributions to be recognized and tracked. The counter-part of this open policy is that even if a validation procedure is used to control the quality of the data, it is not possible to exclude erroneous measurements, which will become part of the database. This is why the database is provided without any warranty.
Content organization, methods and technologies
The entity-relationship schema (Chen 1976) was adopted to design the conceptual model of the database. Figure2is a simplified graphical representation of wwhypda’s model, built with a unified modeling language diagram (UML). It shows the entities which compose the database, their relationships and their main attributes.
The basic entity composing the database is an ensemble of values of measurements of hydrogeological parameters (Fig. 3). Only geometry-independent parame-ters are considered. Information about a single measure-ment is stored in the entity Measure whose main attributes are:
– value: the measured value of the parameter.
– error: if the value is obtained as mean value of many measurements, this parameter will represent the asso-ciated uncertainty, otherwise it should be used to store an estimate of the uncertainty related to the measure-ment technique and interpretation.
– quality: this information reports an evaluation of the data-quality given by the user. It can be set to low, medium or high.
Every measure is related to a description of the experimental procedure (such as a pumping test, a slug test, etc.) as well as the interpretation method that was used to analyse the data. This information is stored in lists that can be extended when required.
Measurements of different properties can be made on the same sample. The database structure requires the user to link each measurement with a sample. This allows, for example, the user to study the correlation between 482
parameters. The entity Sample has the following main attributes:
– scale_value: the majority of the parameters included in the database have statistical distributions that are scale dependent (Kiraly 1975; Gelhar et al. 1992; Neuman and Di Federico 2003). The scale of observation is described by four classes: micro (for lengths <1 m), macro (1 m < lengths <10 m), meso (10 m < lengths <100 m) and mega (for lengths >100 m).
– fracturation_degree: this is a characteristic which strongly affects the values of the measured properties. To minimize redundancy, part of the information related to the sample and to the measure is stored in the entity Measure_group. It contains the information that is shared by a group of measurements such as:
– review_level: this attribute depicts the level of reviews undergone by a group of measurements. Values among high (such as a paper published in a peer reviewed journal), low (such as an internal report or a MSc
thesis), medium (such as a PhD thesis or a reviewed technical report) and not reviewed are allowed. The entity Measure_group also contains a link to the entity Contact in order to identify the contributor.
Every sample is related to an earth material (rock type) or to a hydrogeological environment. To facilitate this task, the entities Rock_type and Environment contain typical sets of earth materials and environments. In practice, these two database components represent two catalogs organized and presented as tree structures; contributors are able to add their own Rock type or their own Environment as branches of the proposed tree classification. The definitions of the rock types are specified by a brief description and, when possible, are followed by a link to the free encyclopedia Wikipedia (http://www.wikipedia.org), which provides a more de-tailed description. Finally, geographic information is stored in the entity Site_info (site_name, region, longitude and latitude), in order to locate a measure group.
Open source technology is used to implement the conceptual schema in a relational database with Sun Fig. 1 Typical examples of wwhypda content and output: a histogram of the log-hydraulic conductivity (K) for one facies. b Variogram (γ) describing the correlation of the properties versus the distance (h). c Three-dimensional training image of the internal architecture of a fluvial plain obtained from a fluvsim simulation (Deutsch and Wang1996)
«Table»
Contact
«PK» id_Contact : INTEGER full_name : VARCHAR «Unique» e_mail : VARCHAR privacy : TINYINT
«Unique» login : VARCHAR passwd : VARCHAR type : VARCHAR «Table» Environment «PK» env_id : INTEGER env_name : VARCHAR env_description : VARCHAR env_wiki_link : VARCHAR «FK» env_id_parent : INTEGER env_Status : SMALLINT «Table» Experiment_type «PK» id_Exp_type : SMALLINT «Unique» exp_name : VARCHAR exp_description : VARCHAR exp_status : SMALLINT 1..* 1 «Table» Interpretation_method «PK» id_Int_meth : SMALLINT «Unique» int_meth_name : VARCHAR int_meth_desc : VARCHAR int_meth_status : SMALLINT «Table» Measure «PK» id_Measure : INTEGER msr_comment : VARCHAR value : FLOAT error : FLOAT «FK» id_smpl : INTEGER «FK» id_ex_ty : SMALLINT «FK» id_par_msr : SMALLINT «FK» id_int_mtd : SMALLINT quality : VARCHAR «Table» Measure_group «PK» id_Measure_group : INTEGER «Unique» mg_date : DATE mg_comment : VARCHAR «FK» id_src : INTEGER review_level : SMALLINT «FK» id_env : INTEGER «FK» id_cnt : INTEGER «FK» id_pnt : INTEGER mgr_spreasheetID : VARCHAR mgr_DuplicationWarning : SMALLINT mgr_CoherenceWarning : SMALLINT mgr_UpdateWarning : SMALLINT «Table» Parameter «PK» id_Parameter : SMALLINT «Unique» code : VARCHAR «Unique» param_name : VARCHAR units : VARCHAR
«Unique» html_code : VARCHAR html_units : VARCHAR MaxValue : FLOAT MinValue : FLOAT «Table» Rock_type «PK» rt_id : INTEGER «Unique» rt_name : VARCHAR rt_description : VARCHAR rt_wiki_link : VARCHAR «FK» rt_id_parent : INTEGER rt_USCS : VARCHAR rt_status : SMALLINT «Table» Sample «PK» id_Sample : INTEGER fracturation_degree : SMALLINT «FK» key_rt : INTEGER scale_value : SMALLINT «FK» key_Mgroup : INTEGER sample_name : VARCHAR sample_comment : VARCHAR «Table» Site_info «PK» site_id : INTEGER site_name : VARCHAR region : VARCHAR longitude : FLOAT latitude : FLOAT Country : CHAR «Table» Source «PK» id_Source : INTEGER authors : VARCHAR title : VARCHAR year_Source : SMALLINT doi : VARCHAR publisher : VARCHAR pages : VARCHAR sou_link : VARCHAR 1..* 1 1..* 1 1..* 1 1..* 1 1..* 1 1..* 1 1..* 1 1..* 1 1..* 1 1..* 1 1..* 1
Fig. 2 Simplified conceptual schema of wwhypda using an UML diagram (the 1 and the 1..* represent the cardinality of the relationships between tables). The actual schema contains more than 28 SQL tables
Microsystems’ MySQL (http://www.mysql.com), and to develop the web interface with the content management system Plone (http://plone.org ), based on the content management framework Zope (http://www.zope.org).
To conclude this section, the structure of wwhypda is designed to be flexible: internal catalogs of earth materi-als, environments and measurement methods are open to users’ contributions. Other database characteristics such as the parameters list, are also modifiable if required.
Data sources
wwhypda should progressively assimilate data from diverse sources. On one hand, some efforts have already been made by various authors to collect data for specific rock types or parameters, and those existing data sets can be integrated rather rapidly. For example, Vanderborght and Vereecken (2007) contributed by providing all dispersivity values they collected for their review article. Their database was directly imported into wwhypda. The second important data sources are the values published in scientific journals. This information is currently difficult to access because it is dispersed in many articles and many journals. Progressively, it should be added to wwhypda to allow easy access. Finally, technical reports constitute another very large source of information. For example, NAGRA (the Swiss agency in charge of nuclear waste management) has founded extensive research and pub-lished reports in which they provide permeability and porosity measurements (e.g. Keller et al. 1990). Many of such type of reports are public and can be integrated in the database. Another incredible amount of measurements has been collected by oil companies. However, these data are
usually confidential and are not accessible. At the moment, wwhypda contains more than 20,000 measure-ments of properties of about 25 earth materials. This is still very little and needs to be extended with contributions from the whole hydrogeology community.
Data quality
The evaluation of data quality is of extreme importance. In wwhypda, a first screening consists of rejecting data that are not acceptable from a physical point of view (porosity must be between 0 and 1, permeability must be positive, etc). Once these trivial checks are satisfied, the quality of the data is described with three criteria stored as three different attributes (quality, review_level and error) linked either to the group of measures or to the measure itself.
The person entering the data has to provide subjective and, if possible, quantitative information about the data quality. Three attributes are used: the review_level, the error, and the quality. The review_level is attached with the source of the measurement. It indicates whether the source has been reviewed thoroughly such as in an international journal or not (the four states described previously are available: not reviewed, low, medium and high). The error is an optional attribute (because often it is not estimated) corresponding to the error range or uncertainty related to the measurement itself (Taylor and Kuyatt1994). Finally, the quality attribute (which can take only the values high, medium or low) allows the user to provide a subjective judgment based on his/her knowledge of thefield conditions during the data acquisition, as well as the type of interpretations that were used for the estimation of the parameter values.
In addition, it is planned that regular scan of the database will be made by the administrator in order to manually check the plausibility of the values. A tag will be used to identify measurements which have been controlled and will allow users to select only those measurements. An interface to let users correct themselves or indicate dubious measurements has still to be devel-oped. At the moment, it is recommended that users send a message to the administrator when potentially incorrect information has been identified.
Consultation example
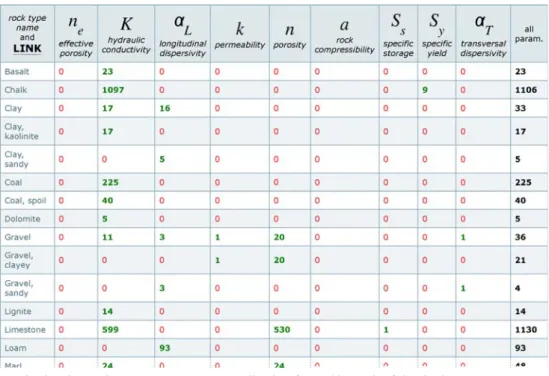
It is expected that most users will be more interested in consulting the database than contributing to it. Therefore the design of the web interface has been made to allow a very rapid and simple access to the data. Different search tools are available. They are freely available without any registration. The fastest is an interactive table that shows the number of measurements currently available for each
rock type and for each parameter (Fig. 3). On this table, one can see very rapidly if wwhypda contains the measurements that one is looking for. Suppose for example, that the user is conducting a project on an alluvial aquifer and would like to check the typical values of hydraulic conductivity of a gravely sand. For that purpose, he or she can check the table and willfind that for the rock type Sand, gravely there are 458 hydraulic conductivity measurements available. Clicking on the number brings one to a search interface in which the main attributes were automatically set. In that window, one can specify additional search criteria and type of results that are to be obtained. For example, the user can define that he or she needs to get basic statistics for those values. He or she can also include criteria such as the scale of the measurement, or the type of experimental method used to obtain the parameter value, or a certain quality level. The result of the search is then displayed in a page like the one showed in Fig. 4. The user in this case has asked to access the raw data, including (when available) a link to the original publication. He or she can, as well,
Fig. 4 Screen shot of the results page 486
download all the raw data corresponding to the result of the query as a csv file that can be used for further statistical treatment.
Contribution example
An important feature of wwhypda is that it allows for contribution to the database. The procedure for entering property values is accomplished essentially via a spread-sheet (Fig.5) and can be summarized as follows:
– The user downloads the contribution spreadsheet from the web site either in OpenOffice Calc or MS Excel format.
– The user fills the spreadsheet off line. The web site and the spreadsheet itself contain information about how to do this. The spreadsheet (Fig. 5) contains drop-down lists from the internal catalogues such as earth materials list or type of parameters. The spreadsheet contains generic information about a set of values (such as the site description or the source of the data), data related to the samples (rock type, degree of fracturation), and then property values with their
attributes. In this way, different parameters can be linked together and relations between parameters can be studied.
– Finally, the user has to upload the spreadsheet on the web site. This last action is available only for registered users. The spreadsheet is then checked by an automat-ed procautomat-edure; if all checks are successful, the informa-tion is inserted into wwhypda and available for consultation.
Discussion
Building a database that combines standards and flexibil-ity requires some restrictions and simplifications to be adopted. Thefirst difficulty is the choice of a classification system for the rock types and the hydrogeological environments. There are two problems. The first is that geologists, hydrogeologists, civil engineers, and environ-mental engineers are not using a unique and common classification. To make matters even worse, the classifica-tions often differ from one country to another: fine sand may not have the same granulometry in France and in
Great Britain. Which one should be adopted? The second problem is technological: How to represent the classi fica-tion in a simple and efficient way? On this topic, Davenport et al. (2002) and Struik et al. (2002) proposed interesting solutions in order to facilitate digital geological mapping. However, their solution was too sophisticated to be implemented within the framework of this project.
Among the classifications, the challenge is to remain simple and flexible. A classification such as the one proposed by the British Geological Survey (BGS ) is, for example, too detailed for wwhypda needs at the moment (BGS 2008). But even if the classification needs to be simple, it should allow coding an accurate geological description when it is available. Thus, it was decided to store the classification in a tree. The base elements correspond to the most common families of rocks (such as basalt, chalk, etc.). The sub-elements correspond to different levels of refinement in the classification (for example one branch of the tree is Clay, Organic clay, High plasticity organic clay). Each element or sub-element contains a brief definition. When available, a symbolic description made with the Unified Soil Classification System (ASTM 1985) is provided. Such a tree allows querying the database at different levels, depending on the amount of data available. For example, it may not be possible to find in the database a sufficient number of measurements for the specific storage for ferruginous meta-sandstone, but there may be enough data at a broader level to characterize the meta-sandstone or sandstone. Furthermore, when a rock-type is not available, the user can propose to add it in the tree structure.
This approach seems to be an affordable compromise at the present state of the project. However it also has limitations just like any other classification system. For example, rocks that are a mixture of different base classes have to be derived only from one parent. An equal mixture of sand and clay for example will have to be linked either to the general clay class or sand class, but not to both. Additional characterization criteria such as the depth of sampling, are not accounted for in the database for the moment.
At present, the main focus of the work is related to data acquisition and interface development for the hydrogeo-logical properties. However, the database is designed to store spatial statistics too such as variograms (Fig.1b) and typical two-dimensional and three-dimensional images of lithofacies distributions (Fig.1d), which could be used as training images for multiple-point statistics simulations (Strebelle 2002). These images are digitally coded representations of facies architectures for a given geolog-ical environment. The coding corresponds to rock types which are also available in the database. In this way, it is possible to obtain statistical information related to the geometry from the digital image and to retrieve statistical information related to the physical parameters themselves within the different architectural elements. The combina-tion of these two aspects of the database could allow, for example, simulating lithofacies distributions for a given site by combining the local borehole observations with the statistical parameters extracted from wwhypda. In a
second step, the grid cells corresponding to the different lithologies could be populated by parameters values. Further work is now required to develop the web interface and obtain training images showing the internal structure of a variety of typical hydrogeological environments that could be stored and distributed in wwhypda.
Finally, it is important to stress that the greatest challenge lies not in the technical aspects of the database, but in the community involvement to enrich the database. Within the project, the database is fed with an initial data set that will progressively increase; however, this is not sufficient. wwhypda can really become a useful worldwide reference if and only if it receives contributions from a very large community. The recent development of projects such as Wikipedia and other intensive user collaborations on the Internet indicates that community involvement is feasible.
Conclusion
wwhypda is certainly a utopia; however, 150 years after the publication of the seminal work of Henry Darcy, the authors think that the time has now come to follow the spirit of people like Diderot and D’Alembert. This is why the hydrogeological community is invited to participate in the creation of a world-wide catalog of hydrogeological properties and hydrogeological environment architectures freely accessible through the Internet. Quoting Diderot (1755)“This is a work that cannot be completed except by a society of men of letters and skilled workmen, each working separately on his own part, but all bound together solely by their zeal for the best interests of the human race and a feeling of mutual good will”.
Acknowledgements This work is funded by the Swiss National Science Foundation (Grant PP002-106557). The authors are grateful to many colleagues who helped in the design process and provided thoughtful advice: Y. Abe, A. Alcolea, S. Cattin, M. Garlick, C. Laux, R. Mackay, F. Machado Porto, G. de Marsily, A. Rivera, M.T. Schafmeister, C. Simmons, S. Tissot, C. Vangenot, and C. Voss.
References
ADES (2008) ADES groundwater national portal.http://www.ades.
eaufrance.fr. Cited October 2008
Alcolea A, Carrera J, Medina A (2006) Pilot points method incorporating prior information for solving the groundwater flow inverse problem. Adv Water Resour 29(1):678–1689 Allen DJ, Brewerton LJ, Coleby LM, Gibbs BR, Lewis MA, Mac
Donald AM, Wagstaff SJ, Williams AT (1997) The physical properties of major aquifers in England and Wales. Technical Report WD/97/34, British Geological Survey, Keyworth, UK Anderson MP, Aiken JS, Webb EK, Mickelson DM (1999)
Sedimentology and hydrogeology of two braided stream deposits. Sediment Geol 129(1999):187–199
ASTM (American Society for Testing and Materials) (1985) Classification of soils for engineering purposes: annual book of ASTM standards. 04(08):395–408
Barazzuoli P, Bouzelboudjen M, Cucini S, Kiraly L, Menicori P, Salleolini M (1999) Olocenic alluvial aquifer of the River 488
Cornia coastal plain (southern Tuscany, Italy): database design for groundwater management. Environ Geol 39(2):123–143 BGS (2008) The BGS rock classification scheme. http://www.bgs.
ac.uk/bgsrcs/home.html. Cited September 2008
CGDI (2008) The Canadian geospatial data infrastructure. http://
www.geoconnections.org. Cited September 2008
Chen PP (1976) The entity-relationship model: toward a unified view of data. ACM Trans Database Syst 1(1):9–36
Chilès JP, Delfiner P (1999) Geostatistics: modeling spatial uncertainty. Wiley, New York
Dagan G (1989) Flow and transport in porous formations. Springer, New-York
Dagan G (2002) An overview of stochastic modeling of ground-water flow and transport: from theory to applications. EOS Trans AGU 83(53):621
Davenport P, Boisvert E, Quat M, Okulitch A, Brodaric B, Colman-Sadd S, Nolan L, Struik B, MacIntyre D, Tzeng P, Scott D, Gilbert C, Abbott G, Bassan A, Journeay M, Francis J, Houlahan T (2002) A scalable, digital map database of bedrock geology for Canada: a progress report. US Geol Surv Open-File Rep 02-370 de Dreuzy JR, Bodin J, Le Grand H, Davy P, Boulanger D, Battais A, Bour B, Gouze P, Porel G (2006) General database for ground water site information. Ground Water 44(5):743–748 de Marsily G, Delay F, Gonçalvès J, Renard P, Teles V, Violette S
(2005) Dealing with spatial heterogeneity. Hydrogeol J 13 (1):161–183
Deutsch CV, Wang L (1996) Hierarchical object-based stochastic modeling offluvial reservoirs. Math Geol 28(7):857–880 Diderot D (1755) Encyclopèdie [Encyclopedia]. Extracted from
English edition: Diderot D (2001) Rameau’s nephew and other works. (translated by Barzun J, Bowen RH), Hackett, Indian-apolis, IN, USA, 283 pp
Freeze RA, Massmann J, Smith L, Sperling T, James B (1990) Hydrogeological decision analysis: 1. a framework. Ground Water 28(5):738–766
Gelhar LW (1993) Stochastic subsurface hydrology. Prentice-Hall, Engelwood Cliffs, NJ
Gelhar LW, Welty C, Rehfeldt KR (1992) A critical review of data on field-scale dispersion in aquifers. Water Resour Res 28 (7):1955–1974
Gogu RC, Carabin G, Hallet V, Peters V, Dassargues A (2001) GIS-based hydrogeological databases and groundwater modelling. Hydrogeol J 9:555–569
Jones HK, Morris BL, Cheney CS, Brewerton LJ, Merrin PD, Lewis MA, MacDonald AM, Coleby LM, Talbot JC, McKenzie AA, Bird MJ, Cunningham J, Robinson VK (2000) The physical properties of minor aquifers in England and Wales.
British Geological Survey Technical Report WD/00/4. Environ-ment Agency R&D Publ. 68, British Geological Survey, Keyworth, UK, 243 pp
Journel A, Zhang T (2006) The necessity of a multiple-point prior model. Math Geol 38(5):591–610
Keller B, Bläsi HR, Plat NH, Mozley PS, Matter A (1990) Sedimentaere Architektur der distalen Unteren Süsswassermo-lasse und ihre Beziehung zur Diagenese und den petrophysika-lischen. Eigenschaften am Beispiel der Bohrungen Langenthal. [Sedimentary architecture of distal Lower Freshwater Molasse in connection with its diagenesis and petrophysical properties, exemplified by the Lagenthal boreholes]. NAGRA Technical Report 90-41, NAGRA, Baden, Switzerland, 100 pp
Kiraly L (1975) Hydrogeology of karstic terrains, Rapport sur l’état actuel des connaissances dans le domaine des caractères physiques des roches karstiques. [Report on the current state of art of the physical properties of karstic rocks], chapter 5. IAH, Goring, UK
Matheron G (1962) Traité de géostatistique appliquée [Treatise of applied geostatistics]. Technip, Paris
Neuman SP, Di Federico V (2003) Multifaceted nature of hydro-geologic scaling and its interpretation. Rev Geophys 41(3), 1014. doi:10.1029/2003RG000130
Renard P (2007) Stochastic hydrogeology: what professionals really need. Ground Water 45(5):531–541
Rubin Y (2003) Applied stochastic hydrogeology. Oxford Univer-sity Press, New York
Strebelle S (2002) Conditional simulation of complex geological structures using multiple-point statistics. Math Geol 34(1):1–21 Struik LC, Quat MB, Davenport PH, Okulitch AV et al (2002) A preliminary scheme for multihierarchical rock classification for use with thematic computer-based query systems. Current Research 2002-D10. Geological Survey of Canada, Ottawa Tarantola A (2005) Inverse problem theory. Society for Industrial
and Applied Mathematics, Philadelphia, PA, 342 pp
Taylor BN, Kuyatt E (1994) Guidelines for evaluating and expressing the uncertainty of NIST measurement results. NIST Technical Note 1297. United States Department of Commerce Technology Administration, National Institute of Standards and Technology, Gaithersburg, MD, USA, 20 pp
US Geological Survey (USGS) (2000) Ground water atlas of the Unites States. United States Geological Survey, Reston, VA.
http://pubs.usgs.gov/ha/ha730/gwa.html. Cited October 2008
Vanderborght J, Vereecken H (2007) Review of dispersivities for transport modeling in soils. Vadose Zone J 6:29–52
Zhang YK, Zhang D (2004) Forum: the state of stochastic hydrology. Stoch Environ Res Risk Assess (2004)18:265