WORKING
PAPERS
SES
N. 506
VIII.2019
The Effects of Gender and
Parental Occupation in the
Apprenticeship Market: An
Experimental Evaluation
Ana Fernandes,
Martin Huber,
The Effects of Gender and Parental Occupation in the
Apprenticeship Market: An Experimental Evaluation
∗Ana Fernandes
†Martin Huber
‡Camila Plaza
§September 2, 2019
Abstract
The apprenticeship market is the earliest possible entry into the workforce in developed economies. Since early labor market shocks are likely magnified throughout professional life, avoiding mismatches between talent and occu-pations e.g. due to gender- or status-based discrimination appears crucial. This experimental study investigates the effects of applicant gender and its interaction with parental occupation on callback rates in the Swiss appren-ticeship market, i.e. invitations to an interview, assessment center, or trial apprenticeship. Our correspondence test consists of sending out fictitious job applications with randomized gender and parental occupation to apprentice-ship vacancies in four Swiss regions. We by and large find no robust evidence of differential treatment by employers, as gender and parental occupation do not affect callback rates in a statistically significant way in most cases. JEL Classification: C93, J16, J71
Keywords: Field Experiment, Correspondence Test, Discrimination, Gender, Parental Occupation.
∗We have benefited from comments by conference/seminar participants in Bern (International
BFH Conference on Discrimination in the Labor Market 2019), Melbourne (research seminar at Monash University), Geneva (Annual Congress of the Swiss Society of Economics and Statistics 2019), and Engelberg (Labor Seminar 2019). We are indebted to Andr´e Scholl for the technical implementation and management of the correspondence test and to Aron Baeriswyl for his support in the conceptual preparation and documentation of the project. We additionally thank Benjamin Bolzern and B´en´edicte Droz for their work and effort during the application process and are also grateful to Ruth Neuhaus and Andrea Sommer-Gauch for their help and administrative support. Financial support from the Swiss National Science Foundation for the SNF project 100018 176376 ‘Gender Occupational Segregation in the Swiss Apprenticeship Market: the Role of Employers in an Experimental Evaluation’ is gratefully acknowledged.
†Bern University of Applied Sciences, Br¨uckenstr. 73, CH-3005 Bern, [email protected] ‡University of Fribourg, Bd. de P´erolles 90, CH-1700 Fribourg, [email protected] §University of Basel, Peter Merian-Weg 6, CH-4002 Basel, [email protected]
1
Introduction
This paper presents a so-called corresponding test based on experimentally sending out fictitious applications to vacancies in the Swiss apprenticeship market, in order to assess the effects of applicant gender and its interaction with parental occupation on employers’ callback rates. By and large, we do not find statistical evidence for differential treatment by employers in terms of callbacks, i.e. invitations to an interview, assessment center, or a trial apprenticeship, with one noticeable exception. One major motivation for our study is the empirically observed gender occupa-tional segregation between males and females, see e.g. Cortes and Pan (2018) for a recent overview of evidence and preference-based explanations of gendered occupa-tional choice. Because this phenomenon is associated with less favorable labor mar-ket outcomes for women as wages in female-dominated professions tend to be lower than wages in male-dominated ones, see Blau and Kahn (1996), its causes are the object of intense scrutiny. The experimental literature (e.g. through correspondence testing) has attempted to uncover evidence of potential demand-side effects. Em-ployers would contribute to gender occupational segregation if they preferably hired women for female-dominated occupations and, vice-versa, men for male-dominated occupations. Although the empirical findings do not speak in unison, it is nonethe-less possible to discern an imperfect pattern suggesting that employers favor males in male-dominated professions and females in female-dominated ones, see the lit-erature reviews in Rich (2014) and Bertrand and Duflo (2017). Along the same line, a recent correspondence test including Switzerland by Becker, Fernandes, and Weichselbaumer (2019) documents a much higher average callback rate for women relative to men in (female-dominated) secretarial and accounting positions.
In preventing the best match between talent and occupations, demand-side ef-fects are likely inefficient in addition to being socially unjust. Furthermore, differ-ences in initial conditions in the labor market may matter more for lifetime inequality than do shocks afterwards, see Huggett, Ventura, and Yaron (2011). Therefore, an important question is whether or not such stereotypical decisions are already present at early stages of labor market participation. While the empirical evidence described above applies to adults, it is the aim of this study to advance research examining demand-side effects on gender occupational segregation in the apprenticeship mar-ket, the earliest point of entry into the labor market in developed economies. For this reason, we experimentally assess how applicant gender affects callback rates in
the Swiss apprenticeship market.
In Switzerland, job applications routinely contain detailed personal information, including a photo and demographic details such as age, marital status, among others. Apprenticeship applicants are typically 14 or 15 years of age. Because of their youth, they usually do not yet have that much to say about themselves in their CVs. However, they routinely indicate the profession of their parents. This quite unique feature of the Swiss apprenticeship market allows us to investigate whether parental background affects the labor market chances of offspring, and differently so across applicant gender. This is an important question as equality of opportunity would require such background information not to have an effect on the applicants’ labor market outcomes. How closely one’s earnings relate to those of one’s parents is subject of an extensive literature attempting to estimate the intergenerational elasticity, a measure of intergenerational income persistence. To the best of our knowledge, this is the first attempt to investigate demand-side effects related to the intergenerational persistence in the experimental literature.
To assess whether employers take applicant gender and parental occupation into consideration, we sent out approximately 3000 fictitious applications (containing CVs and educational certificates) via e-mail to open apprenticeship positions across four regions in Switzerland (Basel, Bern, Lausanne, and Zurich) between August and October 2018. In the applications, we randomized demographic characteristics like gender and parental occupation to investigate the impact on callback rates by employers, namely invitations to interviews, assessment centers, or trial apprentice-ships. The employers’ responses to our applicants were recorded up to February 2019. Using applications that signaled a comparable level of productivity and dif-fered only w.r.t. the applicant’s gender and/or parental occupation was key for investigating whether employers systematically differ in their treatment of groups with particular demographics.
By and large, we find no robust evidence for discrimination based on applicant gender or parental occupation. For all but one of the investigated combinations of gender and occupational choice, differences in call back rates are not statistically significant at any conventional level when accounting for multiple hypothesis test-ing. The one exception is stating father’s occupation to be a university professor, which boosts callbacks in a statistically and economically significant way for female applicants, but not for males. Our results therefore provide some support for a blind recruitment procedure. Personal attributes (such parental occupation) should not
be communicated to the employer in the first round of an application process, in order to prevent signaling effects and set the callback chances of all applicants on an equal footing.
Point estimates across subsamples suggest that the aforementioned professor ef-fect for female applications is, to a larger extent, driven i) by the German rather than the French speaking sample, ii) by less demanding apprenticeships from the point of view of required qualifications, iii) by more female- rather than male-dominated apprenticeships, and iv) by smaller rather than larger employers in terms of the number of employees. However, due to low statistical power and issues related to multiple hypotheses testing we abstain from putting strong interpretations on the effect heterogeneities found across subsamples. The findings across subgroups gen-erally back those of the main analysis. Specifically, when excluding the empirically rare case of having a professor as parent from our sample, we find no statistically significantly differential callback rates across gender.
The absence of statistically significant gender bias in employers’ callback rates goes against well-established regularities in the experimental literature, as discussed above, though those findings pertain to the labor market of adult persons. Recent evidence also for Switzerland in Becker, Fernandes, and Weichselbaumer (2019) is a case in point, where the callback rates for females vastly surpass those for males in secretarial and accounting jobs. Our findings raise important questions for future investigation: if gender discrimination, possibly led by stereotypical employer bias, is evident in the Swiss labor market for adults or prime age workers, why does it not emerge in the apprenticeship market? Furthermore, at what point in a person’s professional life does it emerge?
Our paper is structured as follows. Section 2 reviews the literature on labor market discrimination and correspondence testing. Section 3 provides institutional background information on the Swiss educational system and apprenticeship market. Section4 outlines the experimental design. Section5 provides descriptive statistics for our data. Section 6presents the empirical results. Section 7 concludes.
2
Literature Survey
Our paper is closely related to the experimental literature aiming at causally as-sessing the prevalence of discriminatory practices. In economics, asymmetric labor market treatment of individuals for reasons unrelated to their productivity amounts
to discrimination. The two main reasons for employers to discriminate offered in the literature originate from tastes (see Becker (1957)), e.g. when if employers or customers dislike working with a particular group in the population, or in uncer-tainty about the true productivity of the candidate employee (seeArrow(1973) and Phelps (1972)). The former is commonly known as taste-based discrimination and the latter as statistical discrimination.
The preference for one gender over the other as a function of occupation type could have elements of both taste-based and statistical discrimination. Employers may have a preference for candidates with the gender that matches the sex typically expected or encountered in a particular occupation, possibly reflecting stereotypical preference biases. They may also believe that such a gender-based matching is relevant for productivity, see Goldin (2015) and also Weichselbaumer (2003) for a detailed discussion on this matter. An interesting aspect of our experiment is that, due to the young age of apprenticeship applicants, statistical discrimination against females due to fertility concerns appears less likely than for older age groups.
Field experiments (i.e. so-called audit studies and correspondence testing) are ex-perimental methods of data collection which involve sending fictitious applications in response to real job advertisements. In correspondence testing, for example, appli-cations including CVs that are matched in all relevant qualifiappli-cations, like schooling and job experience, but which differ w.r.t. the demographic characteristics of inter-est (e.g. gender, ethnicity, age), are sent out in response to job advertisements. If all productivity-related characteristics are comparable, any statistically significant differences in the response rate of employers related to the demographics is indica-tive of discrimination. For example, the study byBertrand and Mullainathan(2004) addressed ethnic discrimination and the racial gap in callback rates in the US labor market by implementing a correspondence test in which the crucial element was the choice of White- and African American-sounding names. Experimental methods gained notoriety as they were able to overcome important empirical limitations of previous tools, such as omitted variables bias, see Guryan and Charles (2013) and Bertrand and Duflo(2017) for a discussion. The latest developments in this exten-sive literature and results have been systematized in recent surveys, seeRich(2014), Bertrand and Duflo(2017),Neumark (2018), and Baert(2018).
Regarding gender discrimination, results are not completely unanimous but it is nonetheless possible to discern an imperfect pattern. The evidence summarized in Riach and Rich (2002) and Rich (2014) suggests that women are discriminated
against in male-dominated jobs and vice versa, while such results are frequently not found for occupations lacking a clear gender pattern. An exception to this rule is a study by Zhou, Zhang, and Song (2013) on China, concluding that males are discriminated against in most of the occupations, even in those not considered to be typically female.
The interpretation of gender discrimination (in contrast e.g. to ethnic discrimi-nation) is further nuanced by fertility expectations. One strand of the literature at-tempts to isolate employers’ concerns with fertility related costs which could lead to statistical discrimination of women in fertile age. A strategy often followed in order to separate fertility concerns from other forms of gender discrimination is to contrast callback rates of candidates in fertile age with those of older ones. The empirical evidence is mixed. Duguet and Petit(2005) and Petit(2007) found no indication of discrimination against older women relative to older men. However, younger females received callbacks significantly less frequently than younger males when applying to highly qualified jobs, which the authors attributed to higher maternity costs in these occupations. Also the results in Bartoˇs (2015) point to a motherhood penalty, but only for highly qualified positions. Using gender and parental status as a way to reveal potential fertility costs,Bygren, Erlandsson, and G¨ahler (2017) did, however, not find discriminatory behavior for different occupations and regions in Sweden.
Becker, Fernandes, and Weichselbaumer (2019) considered a wider range of ap-plicant types in terms of family status (e.g. single and married with or without children) in order to isolate different facets of fertility costs (maternity leave versus child chores, for example). The results suggest that married but childless job appli-cants are at a disadvantage compared to mothers of older children when applying to part-time jobs, but to full-time positions. Since part-time jobs are traditionally perceived as a way to reconcile family and work in the countries analyzed there, the authors argue that fertility related cues from the applicants – such as being married but (still) childless – provide stronger signals about fertility costs than they otherwise would in the context of applications to full-time jobs. Becker, Fernandes, and Weichselbaumer (2019) therefore interpret their results as evidence of fertility discrimination. While fertility-related costs are absent in the context of the appren-ticeship market due to the young age of applicants, the work ofBecker, Fernandes, and Weichselbaumer(2019) is nonetheless a relevant reference point for our results because Switzerland was one of the countries covered in that study. For the female-dominated professions considered there, secretaries and accountants, females had
significantly higher callback rates than males.1
While most studies consider prime age workers, such that statistical discrimina-tion related to family obligadiscrimina-tions could partly explain gender differences in callback rates,K¨ubler, Schmid, and St¨uber(2018) similarly to our paper focused on the ap-prenticeship market, however, in Germany. They embedded a vignette study in a nationally representative survey of German firms hiring apprentices and found fe-males to be evaluated worse than fe-males, on average. In line with the broad patterns described above, the female disadvantage disappeared with the share of women in an occupation.2 The results of K¨ubler, Schmid, and St¨uber (2018) are at odds with ours as we mostly find no statistically significantly differential treatment of appli-cants based on gender. As pointed out by the authors, vignette studies do not allow for the observation of actual invitation decisions as it is the case in correspondence testing. This could partly explain the different findings.
Our paper also relates to a broad literature focusing on parental education and/or occupation and its effect on health, education, occupations and/or later in life de-cisions of the offspring. See for instanceBello and Morchio(2014), Ham, Junankar, and Wells(2009),Downey(1995),Giannelli and Rapallini (2018),Chevalier(2004). However, to the best of our knowledge, there is no study analyzing the impact of parental occupation on callback rates in the context of a correspondence test.
3
The Swiss Education System and Vocational
Education
In Switzerland, the constitution broadly defines the general foundations of the edu-cational system, like obligatory free access to primary schooling. However, the core responsibilities in providing education rest with the country’s 26 cantons (regional administrative units). For this reason, there is considerable variation in school sys-tems across cantons, although there are also attempts to harmonize key aspects of compulsory schooling through the so-called HarmoS concordate. According to the State Secretariat for Education, Research, and Innovation (2013), the vast majority
1Further correspondence tests in Switzerland have focused on ethnicity, seeFibbi, Lerch, and
Wan-ner(2006), Zschirnt (2019), Zschirnt and Fibbi(2019) for labor market studies. A recent study carried out by the Universities of Geneva, Neuchˆatel, and Lausanne on behalf of the Federal Housing Office investigated the impact of having a foreign name on the probability of being invited to a viewing of an apartment, see https://www.swissinfo.ch/eng/discrimination_ foreign-names-impact-chance-of-getting-an-apartment-viewing/45019430, accessed in August 2019.
2Although parental occupation of the applicants is used as control variable, the relevance of family
of students in compulsory education attend public schools, only 5% went to private schools in the academic year of 2012/2013.
According to the Swiss Coordination Centre for Research in Education (2018), compulsory schooling consists of 11 years of education in most cantons (in particular those participating in the HarmoS concordate), including two years of kindergarten attendance that starts at the age of four. After kindergarten, primary schooling typically consists of six years and lower secondary schooling of three. In the last year of primary school, students are assessed and subsequently placed into different tracks of lower secondary education that differ in terms of qualifications. After finishing lower secondary education and depending on the qualifications obtained, students enter either the vocational education and training (VET) track, typically consisting of a dual apprenticeship system of formal education and training in a company, or the academic track, by attending either a general or specialized high school that prepares students for tertiary education, see the State Secretariat for Education, Research, and Innovation(2018).3
Occupations in VET are further differentiated w.r.t. the qualifications obtained in lower secondary schooling. We label these different requirement levels as tiers. For example, students who wish to apply for a beauty apprenticeship (a 3 year program) are required to have a Realschulabschluss, a school degree with comparably lower qualifications. Apprenticeships with similar requirements (e.g., retail, gardening, etc.) constitute the first tier. An electric technician apprenticeship, on the other hand, typically requires at least a lower level degree with good grades in subjects such as math or physics. A Sekundarschulabschluss, i.e. a school degree with comparably higher qualifications, appears even more appropriate, in particular when combined with a standardized aptitude test. Apprenticeships of this kind make up the second tier (e.g. mechanic, dental assistant, etc.). Lastly, apprenticeships in areas such as informatics or polymechanics make up our third tier and typically require a higher level degree with decent grades in math and physics (in some cases a lower level degree is accepted so long as the 10th school year is completed and an aptitude test with decent results is provided).
In Switzerland, roughly two thirds of all students with completed compulsory education enter the VET track and have around 230 occupations to choose from,
3Students typically receive career counseling concerning their professional interests and options at
the age of 14. If they choose the VET pathway, then starting the apprenticeship application process is encouraged. At the age of 15 to 16, when students have accomplished compulsory education, they typically start their apprenticeships.
see the State Secretariat for Education, Research, and Innovation (2018). Appren-ticeships typically take between two to four years, as discussed in Kuhn, Schweri, and Wolter(2019). Most popular are dual apprenticeship programs, which combine classes at a vocational school with on-the-job training at a host company. Appren-tices are employed and paid a salary which increases with each completed year. However, also (full-time) school-based VET programs exist. They are less common overall, but relatively more popular in the French and Italian speaking regions of Switzerland.
Upon successful completion of the program, apprentices receive a federal VET diploma which not only serves as recognized occupational qualification but is also a precondition for further education and higher qualifications in the chosen occupa-tion. According to the State Secretariat for Education, Research, and Innovation (2018), the VET system is managed as a public-private partnership, with the federal and cantonal governments as well as the employers and professional organizations jointly defining the curricula, skill sets, and standards for occupations. Moreover, the employers cover the costs for on-the-job-training, salaries, and in-house courses. The cantons, on the other hand, fund the vocational schools and career guidance services.
4
Experimental Design
Our correspondence test in the Swiss apprenticeship market consisted of a prepara-tory phase, from October 2017 to July 2018, an experimental phase, from August 2018 until February 2019, and the debriefing of the employers in March 2019.
Preparatory Phase In the preparatory phase, we developed all materials re-quired for the production of fictitious applications to open apprenticeships. We first screened apprenticeship advertisements online to learn which documents were re-quired in the application process.4 Furthermore, we consulted teenagers applying for apprenticeship positions in order to learn how typical applications look like. In addition, we collected CVs and motivation letters (through personal contacts as well as online sources) to use them as templates for our fictitious applications. We also prepared electronic versions (i.e. in pdf format) of school certificates for the fictitious candidates. In order to compare candidates beyond their school credentials,
employ-4Such information is, for instance, provided on the websites
https://www.berufsberatung.chand
ers may require apprenticeship applicants to take an aptitude test. Whether or not testing is common generally depends on the occupation (with most companies hiring in a given occupation either requesting or not requesting the test results). We thus prepared electronic versions of aptitude test certificates for the fictitious candidates, too.
A further task was to classify apprenticeship types w.r.t. their relative empirical importance among females and males. We relied on information about the relative popularity of specific occupations across gender provided online by the Educational Office of the Canton of Bern (Kanton Bern, Erziehungsdirektion) and the Office for Equality of Males and Females of the Canton of Zurich (Kanton Z¨urich, Fachstelle f¨ur Gleichstellung von Frau und Mann).5 These classifications were further cross-checked with additional online resources on the apprenticeship market.6 Using these criteria, we categorized occupations into clearly male-dominated, female-dominated, and (more or less) gender neutral types.
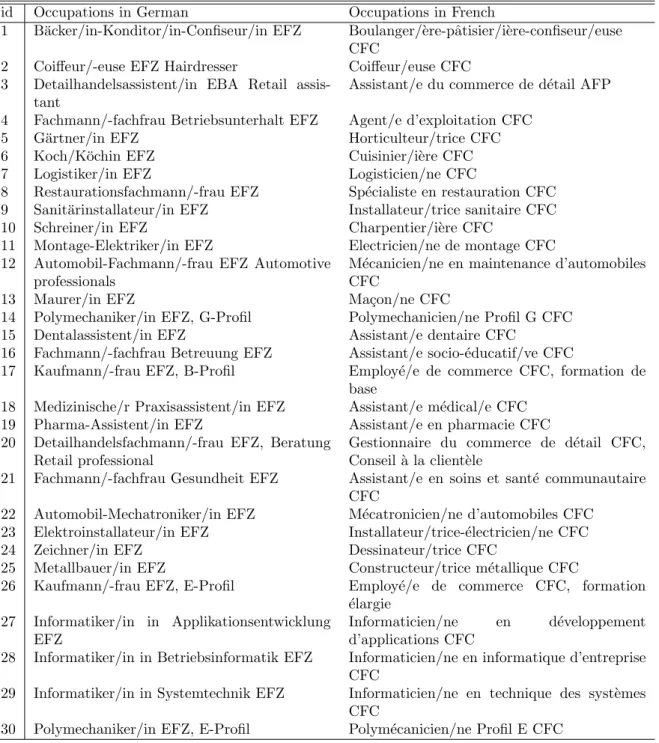
30 occupations were selected and included in the experiment, eight of which are rather gender neutral (e.g. baker, cook, sales assistant, designer), six female-dominated (e.g. hair dresser, dental assistant, medical practice assistant), and 16 male-dominated (e.g. gardener, carpenter, car mechanic, mason, electrician). In selecting these occupations, we took into consideration the need of having sufficiently many observations for all three gender types in the sample, guided by online search-based estimates of how many advertisements would be posted for each type. See AppendixA for a complete list of occupations considered.
As mentioned further above, a second classification concerned the level of qualifi-cations attained in terms of lower secondary schooling. We classified apprenticeship types into three levels of requirements (or tiers) and adapted school certificates and aptitude tests accordingly to make applications look appropriate concerning skills typically expected. For the first tier, which was lowest in terms of requirements, applications contained school certificates reflecting a lower level degree (Realschula-bschluss) and comparably low scores in the aptitude test, if the latter was required
5See https://www.erz.be.ch/erz/de/index/berufsbildung/grundbildung/kennzahlen_
berufsbildung/kennzahlen_berufsbildung2.html and https://ffg.zh.ch/internet/ justiz_inneres/ffg/de/bildung/berufswahl/_jcr_content/contentPar/morethemes/ morethemesitems/factsheet_die_belieb.spooler.download.1393238737874.pdf/FFG_2013_ factsheet_die_beliebtesten_berufe_von_maedchen_und_jungen.pdf, respectively, both accessed in the beginning of 2018.
6See for instance the following list of the 10 most popular apprenticeships
for females and males in 2015: https://blog.100000jobs.ch/de/2016/09/ die-top-10-der-beliebtesten-lehrstellen/, accessed in the beginning of 2018.
at all. For the second tier, certificates reflecting a higher level degree (Sekundarschu-labschluss) along with intermediate grades and aptitude test scores were used. For the most demanding third tier, certificates reflecting a higher level degree along with comparably good grades and test scores were included in the application documents. Aiming to find an acceptable balance between expected sample sizes and or-ganizational burden in preparing and managing applications, we decided to focus on three German speaking regions, namely the agglomerations of Basel, Bern, and Zurich, and one French speaking region, the agglomeration of Lausanne. We pre-pared fictitious motivation letters, CVs, school certificates, and aptitude tests as well as two female and male profiles for either language region with varying names, addresses, and photos. Concerning names, we took the most popular choices for first names for either gender in 2004 in the German and French speaking parts, respectively, while the last names corresponded to the most frequent occurrences in the phone book in either language region.
We also picked residential addresses in the four agglomerations for the fictitious candidates. Preparing school certificates that matched these addresses turned out to be more complicated than initially expected. This was so first, because certificates look different in each canton (and even over time) and second, because of adapting certificates to the qualifications appropriate for the three different tiers of apprentice-ships. While applicant addresses and school certificates match in terms of cantonal congruence for Bern and Zurich, this is not the case for Basel and Lausanne. For the latter two agglomerations, it was apparent from the application documents that the respective fictitious candidate had recently moved from a different region.
Experimental Phase We aimed at sending out two applications per open ap-prenticeship and to only consider one apap-prenticeship per employer to avoid strain-ing companies excessively with our experiment. In the CVs, the gender of our two applicants was independently randomized, with a 50% probability of being female or male. As a result, application pairs with either two females, two males, or with one female and one male were sent via e-mail to a specific employer. Our design thus required two profiles per gender and language region. We also independently randomized other features like the gender of the applicant’s sibling and the gender of the teacher given as a reference person. In contrast, mother’s occupation was randomized pairwise among the two applications per open position, implying that these applications had necessarily different vales for mother’s occupation. The latter
was either homemaker or primary school teacher, each with a chance of 50%. Father’s occupation was also randomized pairwise (and independently of mother’s occupation) and contained the following options: university professor (with 12.5% probability), an intermediate technical position (37.5%) matching the job type of the apprenticeship (e.g. mechanic), an intermediate commercial position (37.5%) matching the job type (e.g. sales manager), and an unskilled worker (12.5%). The idea was to consider high skilled, low skilled as well as intermediate profiles, with the latter being related to the position to be filled. The skill level of intermediate profiles therefore varied depending on the tier and industry of the position. For instance, for a technical apprenticeship in the first, second, or third tier, father’s in-termediate technical occupation would either be a mechanic, a polymechanic, or an engineer. This implies substantial heterogeneity of educational achievements within the intermediate profiles for the sake of aligning father’s occupation well with open apprenticeships. Some other CV features, such as motivational sentences and leisure activities, were also randomized pairwise in order to make sure that the same phrases and hobbies would not be used twice in applications sent to the same vacancy.
Employers advertise apprenticeship positions in specialized job portals, at least if they cannot be filled through professional or personal networks. In total, 3069 applications were sent out between August and mid October 2018 via e-mail to open positions posted on Switzerland’s most popular online portal for apprenticeships.
During the data collection process, several issues arose. In August, we acci-dentally sent out applications to some positions that were from the previous year and thus not relevant for our fictitious candidates. In a few cases, the employers’ e-mail addresses provided online contained typos or were not valid such that the applications could not be sent. 129 observations were dropped due to such issues. Furthermore, while most employers received two applications as intended, 397 em-ployers in Lausanne only received one application due to technical issues at the end of the application period (end of September until mid October). However, also in these cases, the application features were randomized as for the other parts of the data.
A more serious concern was that five employers in the German speaking regions detected that our applications were not related to existing students, based on follow-ing up on the candidates by consultfollow-ing the schools. Even though these cases were excluded from the analysis, it cannot be ruled out that the information was com-municated to other employers. If so, this would, in the worst case scenario, bias any
effects towards zero as companies would ignore our applications. Robustness checks presented further below, however, do not suggest that these issues affected callback rates on a large scale. Furthermore, in one case (again, in the German speaking part), we accidentally sent out four applications to the same employer so that the same applicant name occurred twice. Even though no reaction by the employer was received, we immediately withdrew our applications when noticing the issue and excluded this employer from the sample, too. All in all, we dropped 12 observations because of the issues mentioned. Our final evaluation data set thus consists of 2928 observations.
Most of the time, employers responded to our applications by e-mail, though phone calls were also frequent. We never answered the phone directly but regu-larly checked on the messages left by companies in the voicemail of our fictitious applicants’ phone numbers. In 10 out of the comparably few instances when actual letters were sent as replies to our applications, they could not be delivered and were returned to employers, who then wrote e-mails to ask for a correct address. In these cases, we replaced the problematic addresses with new ones (which were then sub-sequently used for the continuation of the study). We apologized to the companies via e-mail and asked to have the letters sent to the new address or for the possibility to get the message via e-mail instead. These employers are kept in our evaluation sample, albeit excluding them leaves our results virtually unchanged.
If one of our applications received an invitation, which was either for a job interview, an assessment center, or a trial apprenticeship, we declined the offer within several days. In this case, the dependent variable, employer response, was coded as one, corresponding to a ‘callback’. In the case of a negative response or no reaction on the part of the employer until to February 2019, the dependent variable was coded as zero.
Ethical Questions and Debriefing The methodology of correspondence testing raises ethical issues, as it necessarily involves the deception of recruiters assessing the electronic documents of our fictitious applicants. While ethical concerns are of first importance and have been addressed in the literature, see e.g. Riach and Rich(2004), it has also been recognized that carrying out research based on a correspondence testing methodology (or, more generally, on field experiments) requires breaking informed consent, see Blommaert, Coenders, and van Tubergen (2013). Indeed, informing participants a priori would invalidate the experiment.
Well-defined exceptions to informed consent have been established in law in a variety of countries (e.g. Sweden, seeBursell(2007), and the USA, seePager(2007)). In the discussion of ethical issues and correspondence testing, one argument often used in favor of the methodology is the relevance of the research question. Arguably, investigating the prevalence of discrimination is a pursuit worth following whose merits could outweigh the cost of not informing participants beforehand. Indeed, the use of deception has been defended on the grounds of the necessity to evaluate the effectiveness of anti-discriminatory legislation, seeBanton (1997). Many courts, including e.g. the US Supreme Court, have endorsed ‘tester’ methodologies. (For legal practices, it is common to ‘test’ one company multiple times whereas the practice of correspondence testing addresses many companies and tends to focus on particular employers only once.) Such practices have gained systematic support from US courts over time, see Pager (2007). In Sweden, initial rejections of the methodology from the Swedish Ethics Board were later overturned (thus aligning with many other OECD countries) after the use of testing results in legal proceedings against detected discriminatory practices, which demonstrated the usefulness and social relevance of the methodology, seeCarlsson and Rooth (2012) for an example. Even if an exception to the principle of informed consent is accepted, corre-spondence testing poses costs to employers, as recruiters spend time on evaluating fictitious candidates. However, if only a small number of applications is sent to each company and if invitations to interviews (or to a follow-up action) are swiftly declined, the time cost can be kept at a comparably small level, as argued inWood, Hales, Purdon, Sejersen, and Hayllar (2009). In this study, we adhered to these practices, e.g. by sending out not more than two applications per employer.
While informing participants about an ongoing experiment would invalidate its results, it is certainly possible to inform participants ex-post due to ethical consid-erations, albeit debriefing practices also have potential downsides as discussed in Midtbøen(2014), Liebkind, Larja, Brylka, et al. (2016), and Pager (2007). For in-stance, they may invalidate future experiments. Zschirnt(2019) provides a thorough overview of how the discussion and practices surrounding correspondence testing have evolved in the literature. In our experiment, we debriefed companies once the data collection period was completed. In early March 2019, we sent e-mails with at-tached letters that explained the setup, purpose, and key findings of the experiment to employers that had received applications from our fictitious candidates. The vast majority of employers did not react to the debriefing. Among the 11 responses we
received via e-mail, some expressed dissent and discontent with the fact they had been confronted with fictitious applications, while others had critical comments or questions concerning the methodology, which we in turn answered in a further e-mail. One reaction was positive and pointed out the importance of investigating discrimination.
5
Data and Descriptive Statistics
Our evaluation sample consists of 2928 observations and contains information about applications and (in anonymized form) employers. Application characteristics con-sist of apprenticeship tiers in terms of required qualifications, types in terms of gender orientation (female-dominated, gender neutral, male-dominated), applicant gender, parental occupation, the agglomeration in which the apprenticeship was lo-cated, and whether or not the fictitious applicant had moved from a different city (and thus had a certificate from a school located elsewhere). We also recorded the dates when an apprenticeship was posted (or, if unavailable, the date when it was found by the research team) and when an application was sent out.
Employer characteristics include categories for the (in many cases estimated) number of employees, the sector (i.e. public, trade and wholesale, manufacturing and goods, or services), the scale of the employer’s operations (local, national, or international), the gender of the contact person in the company, whether or not there was an explicit anti-discrimination policy on the company’s website, and the geographic distance (in kilometers) of the employer to the central station of the applicant’s residential city. In addition to the characteristics, the data contain a binary outcome variable measuring employers’ response to our applications and is one in case of an invitation to an interview, assessment center, or trial apprenticeship and zero otherwise. The anonymized data set without the variable ‘geographic distance’ is publicly available at https://doi.org/10.7910/DVN/PIUJW4.
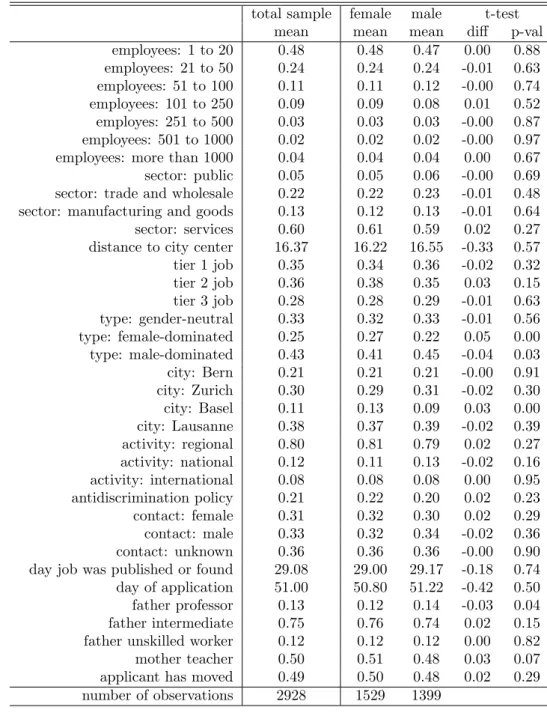
Table 1: Descriptive statistics by applicant gender
total sample female male t-test mean mean mean diff p-val employees: 1 to 20 0.48 0.48 0.47 0.00 0.88 employees: 21 to 50 0.24 0.24 0.24 -0.01 0.63 employees: 51 to 100 0.11 0.11 0.12 -0.00 0.74 employees: 101 to 250 0.09 0.09 0.08 0.01 0.52 employes: 251 to 500 0.03 0.03 0.03 -0.00 0.87 employees: 501 to 1000 0.02 0.02 0.02 -0.00 0.97 employees: more than 1000 0.04 0.04 0.04 0.00 0.67 sector: public 0.05 0.05 0.06 -0.00 0.69 sector: trade and wholesale 0.22 0.22 0.23 -0.01 0.48 sector: manufacturing and goods 0.13 0.12 0.13 -0.01 0.64 sector: services 0.60 0.61 0.59 0.02 0.27 distance to city center 16.37 16.22 16.55 -0.33 0.57 tier 1 job 0.35 0.34 0.36 -0.02 0.32 tier 2 job 0.36 0.38 0.35 0.03 0.15 tier 3 job 0.28 0.28 0.29 -0.01 0.63 type: gender-neutral 0.33 0.32 0.33 -0.01 0.56 type: female-dominated 0.25 0.27 0.22 0.05 0.00 type: male-dominated 0.43 0.41 0.45 -0.04 0.03 city: Bern 0.21 0.21 0.21 -0.00 0.91 city: Zurich 0.30 0.29 0.31 -0.02 0.30 city: Basel 0.11 0.13 0.09 0.03 0.00 city: Lausanne 0.38 0.37 0.39 -0.02 0.39 activity: regional 0.80 0.81 0.79 0.02 0.27 activity: national 0.12 0.11 0.13 -0.02 0.16 activity: international 0.08 0.08 0.08 0.00 0.95 antidiscrimination policy 0.21 0.22 0.20 0.02 0.23 contact: female 0.31 0.32 0.30 0.02 0.29 contact: male 0.33 0.32 0.34 -0.02 0.36 contact: unknown 0.36 0.36 0.36 -0.00 0.90 day job was published or found 29.08 29.00 29.17 -0.18 0.74 day of application 51.00 50.80 51.22 -0.42 0.50 father professor 0.13 0.12 0.14 -0.03 0.04 father intermediate 0.75 0.76 0.74 0.02 0.15 father unskilled worker 0.12 0.12 0.12 0.00 0.82 mother teacher 0.50 0.51 0.48 0.03 0.07 applicant has moved 0.49 0.50 0.48 0.02 0.29 number of observations 2928 1529 1399
Note: Means of characteristics in the total, female, and male samples, as well as mean differences (‘diff’) between females and males and p-values of two sample t-tests (‘p-val’)
Table1provides the means of all characteristics but gender in the total sample, as well as separately by gender, which is the key intervention variable of our experiment. It also contains mean differences across gender (‘diff’) and p-values (‘p-val’) of two sample t-tests. The characteristics’ means are generally well balanced across gender as only few mean differences are statistically significant at the 5% level. We also test mean balance of all characteristics jointly based on the machine learning approach of Ludwig, Mullainathan, and Spiess (2017), which is outlined in Appendix B and
provides no indication of imbalances, with a p-value of 98.4%.
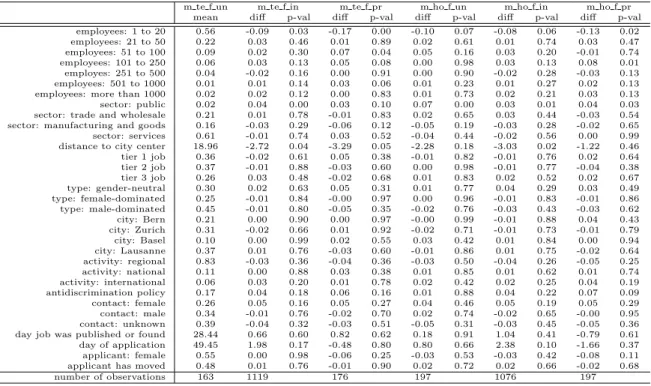
Table 2: Descriptive statistics by parental occupation
m te f un m te f in m te f pr m ho f un m ho f in m ho f pr mean diff p-val diff p-val diff p-val diff p-val diff p-val employees: 1 to 20 0.56 -0.09 0.03 -0.17 0.00 -0.10 0.07 -0.08 0.06 -0.13 0.02 employees: 21 to 50 0.22 0.03 0.46 0.01 0.89 0.02 0.61 0.01 0.74 0.03 0.47 employees: 51 to 100 0.09 0.02 0.30 0.07 0.04 0.05 0.16 0.03 0.20 -0.01 0.74 employees: 101 to 250 0.06 0.03 0.13 0.05 0.08 0.00 0.98 0.03 0.13 0.08 0.01 employes: 251 to 500 0.04 -0.02 0.16 0.00 0.91 0.00 0.90 -0.02 0.28 -0.03 0.13 employees: 501 to 1000 0.01 0.01 0.14 0.03 0.06 0.01 0.23 0.01 0.27 0.02 0.13 employees: more than 1000 0.02 0.02 0.12 0.00 0.83 0.01 0.73 0.02 0.21 0.03 0.13 sector: public 0.02 0.04 0.00 0.03 0.10 0.07 0.00 0.03 0.01 0.04 0.03 sector: trade and wholesale 0.21 0.01 0.78 -0.01 0.83 0.02 0.65 0.03 0.44 -0.03 0.54 sector: manufacturing and goods 0.16 -0.03 0.29 -0.06 0.12 -0.05 0.19 -0.03 0.28 -0.02 0.65 sector: services 0.61 -0.01 0.74 0.03 0.52 -0.04 0.44 -0.02 0.56 0.00 0.99 distance to city center 18.96 -2.72 0.04 -3.29 0.05 -2.28 0.18 -3.03 0.02 -1.22 0.46 tier 1 job 0.36 -0.02 0.61 0.05 0.38 -0.01 0.82 -0.01 0.76 0.02 0.64 tier 2 job 0.37 -0.01 0.88 -0.03 0.60 0.00 0.98 -0.01 0.77 -0.04 0.38 tier 3 job 0.26 0.03 0.48 -0.02 0.68 0.01 0.83 0.02 0.52 0.02 0.67 type: gender-neutral 0.30 0.02 0.63 0.05 0.31 0.01 0.77 0.04 0.29 0.03 0.49 type: female-dominated 0.25 -0.01 0.84 -0.00 0.97 0.00 0.96 -0.01 0.83 -0.01 0.86 type: male-dominated 0.45 -0.01 0.80 -0.05 0.35 -0.02 0.76 -0.03 0.43 -0.03 0.62 city: Bern 0.21 0.00 0.90 0.00 0.97 -0.00 0.99 -0.01 0.88 0.04 0.43 city: Zurich 0.31 -0.02 0.66 0.01 0.92 -0.02 0.71 -0.01 0.73 -0.01 0.79 city: Basel 0.10 0.00 0.99 0.02 0.55 0.03 0.42 0.01 0.84 0.00 0.94 city: Lausanne 0.37 0.01 0.76 -0.03 0.60 -0.01 0.86 0.01 0.75 -0.02 0.64 activity: regional 0.83 -0.03 0.36 -0.04 0.36 -0.03 0.50 -0.04 0.26 -0.05 0.25 activity: national 0.11 0.00 0.88 0.03 0.38 0.01 0.85 0.01 0.62 0.01 0.74 activity: international 0.06 0.03 0.20 0.01 0.78 0.02 0.42 0.02 0.25 0.04 0.19 antidiscrimination policy 0.17 0.04 0.18 0.06 0.16 0.01 0.88 0.04 0.22 0.07 0.09 contact: female 0.26 0.05 0.16 0.05 0.27 0.04 0.46 0.05 0.19 0.05 0.29 contact: male 0.34 -0.01 0.76 -0.02 0.70 0.02 0.74 -0.02 0.65 -0.00 0.95 contact: unknown 0.39 -0.04 0.32 -0.03 0.51 -0.05 0.31 -0.03 0.45 -0.05 0.36 day job was published or found 28.44 0.66 0.60 0.82 0.62 0.18 0.91 1.04 0.41 -0.79 0.61 day of application 49.45 1.98 0.17 -0.48 0.80 0.80 0.66 2.38 0.10 -1.66 0.37 applicant: female 0.55 0.00 0.98 -0.06 0.25 -0.03 0.53 -0.03 0.42 -0.08 0.11 applicant has moved 0.48 0.01 0.76 -0.01 0.90 0.02 0.72 0.02 0.66 -0.02 0.68 number of observations 163 1119 176 197 1076 197
Note: ‘m te f un’ provides the means of characteristics in the reference group (mother teacher, father unskilled worker), the other columns provide the mean differences (‘diff’) compared to the baseline group and the p-values (‘p-val’), respectively. ‘m te f in’: mother teacher, father inter-mediate; ‘m te f pr’: mother teacher, father professor; ‘m ho f un’: mother homemaker, father unskilled worker; ‘m ho f in’: mother homemaker, father intermediate; ‘m ho f pr’: mother home-maker, father professor.
Table 2 reports descriptives by parental occupation (rather than gender) as our second intervention variable of interest. In the first column, it displays the means of all characteristics but parental occupation for the group of applications with the mother being a teacher and the father being an unskilled worker (‘mean’). Fur-thermore, it shows mean differences (‘diff’) between this reference group and other combinations of parental occupation, namely: mother is a teacher and father has an intermediate occupation (technical or commercial), mother is teacher and father is a university professor, mother is a homemaker and father is a low skilled worker, mother is a homemaker and father has an intermediate occupation (technical or com-mercial), and mother is homemaker and father is a university professor. P-values for the respective two sample t-tests are also reported (‘p-val’). Again, the majority of mean differences is not statistically significant at the 5% level. We also apply the joint testing procedure ofLudwig, Mullainathan, and Spiess (2017) for the pairwise
testing of mother is a teacher vs. mother is a homemaker, father has an interme-diate occupation vs. father has a different occupation, and father is a professor vs. father is not a professor. The respective p-values are 5.2%, 91.6%, and 96.7%. By and large, characteristics thus appear satisfactorily balanced across our intervention variables of interest, namely applicant gender and parental occupation. For the sin-gle variable of mother’s occupation, however, balance is almost rejected at the 5% level of significance, but this p-value does not account for the fact that we run the Ludwig, Mullainathan, and Spiess(2017) test for multiple hypotheses. In any case, our empirical results presented in Section 6 are very similar when conditioning or not conditioning on application and employer characteristics to control for observed imbalances.
6
Results
We begin our analysis by running a fully saturated linear regression of the depen-dent variable ‘employer’s response’ on all interactions of gender as well as maternal and paternal occupation. The exhaustive list of these interaction possibilities, which are our right-hand side variables, is as follows: mother teacher and father unskilled worker, mother teacher and father intermediate, mother teacher and father profes-sor, mother homemaker and father unskilled worker, mother homemaker and father intermediate, mother homemaker and father professor – each interacted with appli-cant gender.
The results are presented in Table 3, where standard errors are computed by cluster bootstrapping the coefficients, with clustering on the employer level. The ref-erence category is ‘female applicants with mothers working as teachers and unskilled workers as fathers’. The average employer response (i.e. the share of invitations) for the reference category is reported (‘est’) and amounts to roughly 19%. For the other 11 categories defined by combinations of gender and parental occupation, we re-port the respective difference to the reference category (‘est’), along with bootstrap standard errors (‘boot se’) and conventional p-values (‘raw p-val’) based on a t-test. However, these p-values do not take into account multiple hypothesis testing, i.e. the fact that we simultaneously test 11 differences. This is problematic because the likelihood of spuriously rejecting one or even several null hypotheses generally in-creases in the number of hypotheses tested. We therefore adjust the p-values of each difference for multiple testing (‘adj p-val’) using the stepdown approach ofRomano
and Wolf (2005) and Romano and Wolf (2016). The latter exploits the coefficient estimates in the bootstrap samples in order to compute test statistics that are re-lated to the maximum statistical significance among all coefficients, which in turn permits adjusting the p-values of individual coefficients.
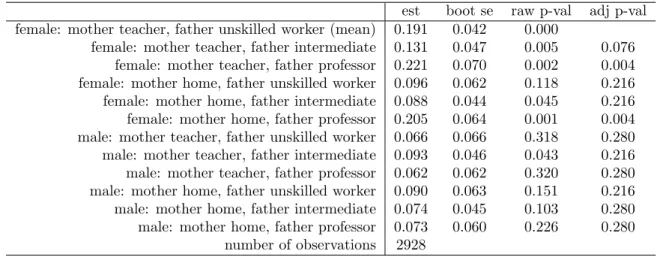
Table 3: Effects of gender and parental occupation
est boot se raw p-val adj p-val female: mother teacher, father unskilled worker (mean) 0.191 0.042 0.000
female: mother teacher, father intermediate 0.131 0.047 0.005 0.076 female: mother teacher, father professor 0.221 0.070 0.002 0.004 female: mother home, father unskilled worker 0.096 0.062 0.118 0.216 female: mother home, father intermediate 0.088 0.044 0.045 0.216 female: mother home, father professor 0.205 0.064 0.001 0.004 male: mother teacher, father unskilled worker 0.066 0.066 0.318 0.280 male: mother teacher, father intermediate 0.093 0.046 0.043 0.216 male: mother teacher, father professor 0.062 0.062 0.320 0.280 male: mother home, father unskilled worker 0.090 0.063 0.151 0.216 male: mother home, father intermediate 0.074 0.045 0.103 0.280 male: mother home, father professor 0.073 0.060 0.226 0.280
number of observations 2928
Note: estimates of (differences in) callback rates for the total sample, without control variables. ‘est’ provides the callback rate for the group ‘female: mother teacher, father unskilled worker’, as well as the differences in callback rates of all other groups relative to ‘female: mother teacher, father unskilled worker’. ‘boot se’ reports bootstrap standard errors clustered at the employer level. ‘raw p-val’ gives the p-values not accounting for multiple hypothesis testing. ‘adj p-val’ provides adjusted p-values accounting for multiple hypothesis testing
When accounting for multiple testing, most differences relative to the reference category are statistically insignificant at conventional levels. One exception is having a professor as father, which boosts callback rates for females by more than 20 per-centage points, independently of mother’s occupation. The effect of either category with female applicants and professors as fathers is statistically significant at the 1% level. Furthermore, having a mother who is a teacher and a father with an inter-mediate occupation also increases callback rates for females relative to the reference group and is significant at the 10% level when accounting for multiple testing. In contrast, callback rates of male applications are rather stable and not significantly different across parental occupation.
Table 4: Treatment effects of gender and parental occupation with controls
est boot se raw pval adj pval female: mother teacher, father unskilled worker (intercept) 0.323 0.087 0.000
female: mother teacher, father intermediate 0.131 0.045 0.004 0.142 female: mother teacher, father professor 0.211 0.064 0.001 0.007 female: mother home, father unskilled worker 0.090 0.058 0.122 0.406 female: mother home, father intermediate 0.084 0.043 0.050 0.455 female: mother home, father professor 0.189 0.061 0.002 0.013 male: mother teacher, father unskilled worker 0.082 0.065 0.209 0.471 male: mother teacher, father intermediate 0.079 0.045 0.080 0.473 male: mother teacher, father professor 0.052 0.059 0.382 0.763 male: mother home, father unskilled worker 0.092 0.061 0.131 0.404 male: mother home, father intermediate 0.069 0.044 0.115 0.571 male: mother home, father professor 0.050 0.058 0.388 0.763
number of observations 2928
Note: estimates of (differences in) callback rates for the total sample, with control variables. ‘est’ provides the callback rate for the group ‘female: mother teacher, father unskilled worker’, as well as the differences in callback rates of all other groups relative to ‘female: mother teacher, father unskilled worker’. ‘boot se’ reports bootstrap standard errors clustered at the employer level. ‘raw p-val’ gives the p-values not accounting for multiple hypothesis testing. ‘adj p-val’ provides adjusted p-values accounting for multiple hypothesis testing.
As a robustness check, we include the applicant and employer characteristics reported in Tables1and2as control variables in our linear regression to account for observed imbalances.7 This does not importantly change our findings, see Table 4. The effect of having a professor as father among female applications remains large (roughly 20 percentage points) and statistically significant at the 5% level. For any other combination of applicant gender and parental occupation, differences to the reference group are not statistically significant at the 10% level.
With the exception of the interaction between a female application and having a professor as father, we find no robust statistical evidence for a systematically differential treatment based on gender and parental occupation. We note that these other professions are empirically more relevant compared to the real-life rare case of a professor. Nonetheless, the estimates also suggest that parental occupation might have a signaling effect for female applications, which appears to be absent among males.
To present the key findings in a more parsimonious (and possibly more accessible) way, we split our sample into two subsamples based on paternal occupation. The first one excludes observations with university professor as parental occupation, while the
7See Table12in AppendixCfor the coefficients of the control variables. Note that the dummy for
second one exclusively contains such cases. In either subsample, we examine whether callback rates differ across applicant gender, both with and without linearly including control variables. Table 5 provides the results for the first subsample (devoid of observations with the father being a professor) in the top panel and for the second subsample in the bottom panel. Furthermore, the left panel provides the results without control variables, while the results on the right are based on conditioning on the application and employer characteristics listed in Tables1 and 2.
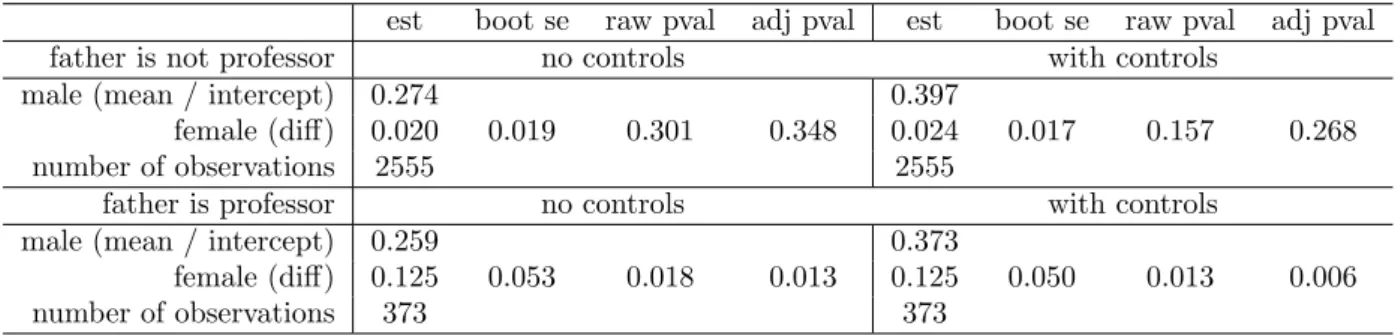
Table 5: Gender differences in callbacks
est boot se raw pval adj pval est boot se raw pval adj pval father is not professor no controls with controls
male (mean / intercept) 0.274 0.397
female (diff) 0.020 0.019 0.301 0.348 0.024 0.017 0.157 0.268
number of observations 2555 2555
father is professor no controls with controls
male (mean / intercept) 0.259 0.373
female (diff) 0.125 0.053 0.018 0.013 0.125 0.050 0.013 0.006
number of observations 373 373
Note: estimates of (differences in) callback rates across gender when father is reported or not reported to be a professor, without and with control variables. ‘est’ provides the callback rate or intercept for males and the difference in call back rates between females and males. ‘boot se’ reports bootstrap standard errors clustered at the employer level. ‘raw p-val’ gives the p-values not accounting for multiple hypothesis testing. ‘adj p-val’ provides adjusted p-values accounting for multiple hypothesis testing of differences by gender, professor, and the gender-professor-interaction.
Looking at the estimates (‘est’) reported in the first column of the top panel, the callback rate for male applicants amounts to 27%. The differential callback rate for females is 2 percentage points and not statistically different from zero based on cluster bootstrapping. This is the case both when considering conventional p-values (‘raw pval’) or adjusted p-p-values (‘adj pval’) that take into account multiple hypothesis testing, now accounting for three hypotheses to be tested (because of four possible gender-paternal occupation combinations). Including control variables (right panel) does not change these conclusions. Thus, our results are in line with employers not distinguishing, on average, between male and female applicants for the empirically most relevant case that paternal occupation is not a professor.8
8The absence of a significant gender effect on callback rates in the first subsample (excluding
profes-sors) appears to be robust to differences in the variance of unobserved determinants of productivity across genders, see the discussion inHeckman(1998) andHeckman and Siegelman(1993). When applying the methodology ofNeumark (2012) to decompose the total gender effect into its level and variance components, we find that the level effect, i.e. the component associated with (taste-based or statistical) discrimination, is very close to zero and statistically insignificant. The variance component is not statistically significant either.
The lower panel of Table5paints a rather different picture. Having a university professor as father results in a quantitatively important boost to female callback rates relative to males. This effect of more than 12 percentage points is robust to the inclusion of controls and highly statistically significant when accounting for multiple hypothesis testing. Even though being the daughter or son of a professor bears comparably little empirical relevance, this finding nevertheless points to distinct signaling effects for females and males at least in this specific case. Our results therefore provide some support for the enforcement of blind applications that do not reveal personal attributes like parental occupation in order prevent differential treatment due to signaling.
In Section 4, we discussed that to the best of our knowledge five employers de-tected that our applications were not related to existing students. Four detections were related to applications sent out between August 28th and September 7th, only one detection to applications in October. As a robustness check, we therefore run our main analysis for the month of September only, to investigate whether a poten-tial communication among employers about the detection of fictitious applications affected our main findings. Even though we cannot rule out that some employers ex-changed information on this issue and adapted their response behavior accordingly, our results do not suggest that this is a widespread phenomenon. As can be seen in Table 11in Appendix C, the results are qualitatively in line with those of the total sample. In the case of a thorough dissemination of information on our experiment, in particular the applicants’ names, one would expect the share of positive responses to be close to zero for any of our profiles. However, callback rates are generally far from zero and statistically significant. Furthermore, the female-professor-interaction effect is also quantitatively not too different from that in the main sample, albeit less precisely estimated.
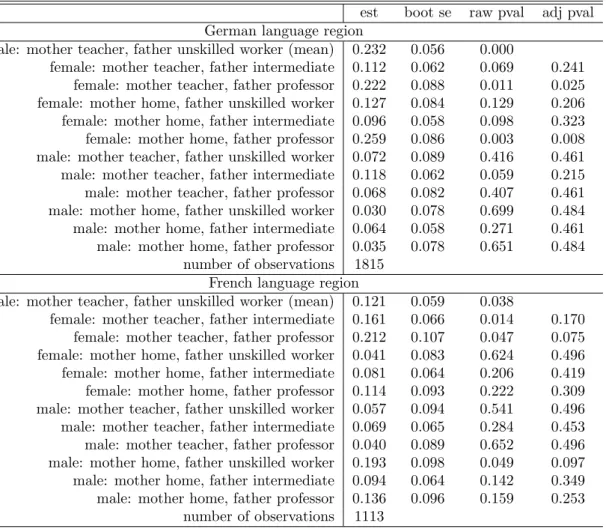
In a next step, we investigate the heterogeneity of our results across specific characteristics, starting with language regions. To this end, we run the main analysis as provided in Table 3 separately for the German (Basel, Bern, and Zurich) and French (Lausanne) speaking regions to explore relative effect sizes, see Table 7 in Appendix C. Having a university professor as father has a positive impact on the callback rate of female applicants in either language group, but this effect is on average larger in the German speaking sample. However, it cannot be rejected at conventional levels of significance that the respective estimates in the French and German speaking samples are actually the same, in particular when accounting for
further multiple hypothesis testing issues introduced by splitting by language region. Any other difference in callback rates relative to the reference group is insignificant in either language group.
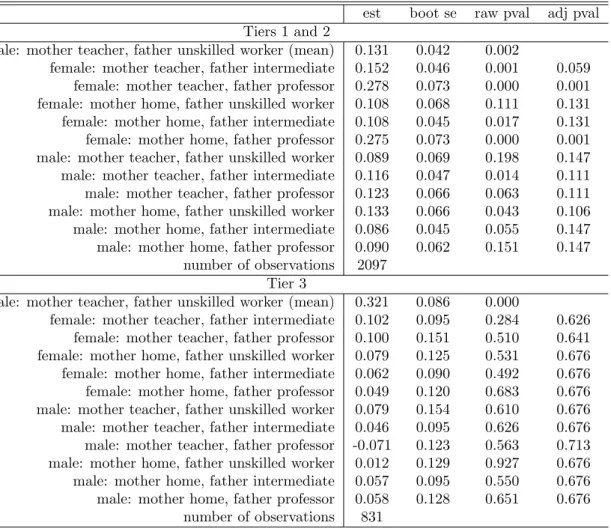
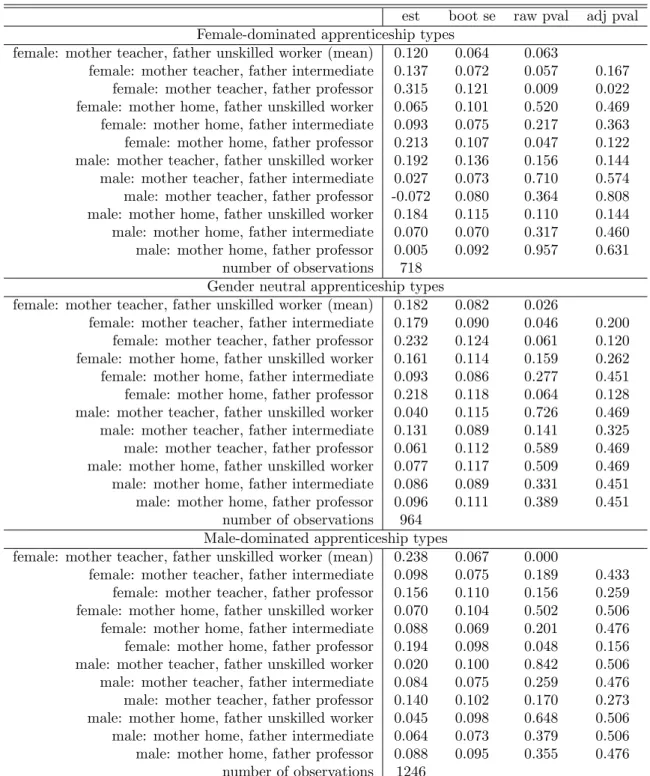
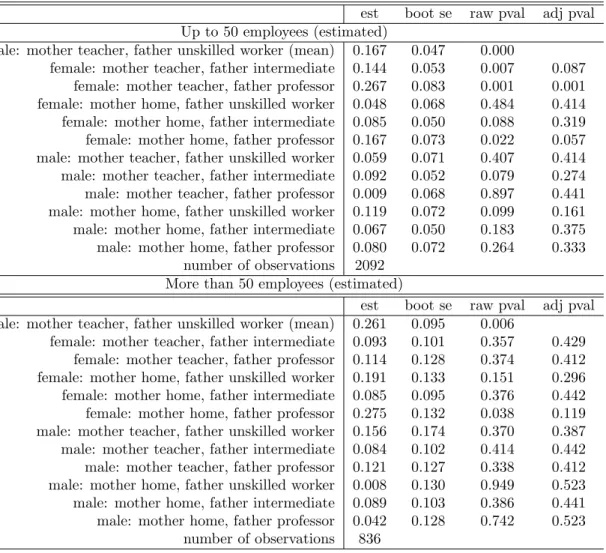
We consider three further heterogeneity checks based on conducting the main analysis separately by tiers (related to levels of qualifications), apprenticeship types in terms of gender orientation, or company size (number of employees), see Tables 8, 9, and 10 in Appendix C. It appears that the female-professor interaction effect found in the main sample is predominantly driven by the lower (first and second) tiers, female-dominated apprenticeships, and smaller firms with up to 50 employees. However, we abstain from making strong claims about differences across subgroups, due to issues of multiple hypothesis testing.
The patterns of effect heterogeneity are by and large confirmed when investi-gating callbacks across applicant gender in subsamples with and without professor as paternal occupation similar to Table 5, however, separately by language regions, tiers, types, or company size. As can be seen from Tables 13, 14, 15, and 16 in AppendixC, no statistically significantly different callback rates across females and males occur in the subsamples excluding professorship. In the subsample with pro-fessorship, the callback rate of females is more than 17 percentage points higher than that of males in the German speaking regions, while the difference is much closer to zero and statistically insignificant in the French speaking region. Furthermore, the female premium is 15 percentage points among tier one and two apprentice-ships, but virtually nonexistent in the third tier. Among female-dominated types, the respective effect amounts to 26 percentage points, but shrinks in magnitude and significance when going to gender neutral and male-dominated occupations. Finally, the gender difference is more pronounced among smaller companies with up to 50 employees.
7
Conclusion
We investigated the effect of gender interacted with parental occupation on callback rates for applications to apprenticeship positions by means of a correspondence test. Sending out approximately 3000 fictitious applications in four regions of Switzer-land, our intervention variables did not affect callbacks in a statistically significant way in most cases. We therefore found no robust evidence of employers applying differential treatment to applicants w.r.t. to gender or parental occupation in the
Swiss apprenticeship market. The one exception was when the applicant stated having a university professor as father, which boosted callbacks for females in a sta-tistically significant way, even when accounting for multiple hypothesis testing, but not for males. Albeit paternal professorship is an empirically rare case, this finding points to the possibility of signaling effects of parental occupation among female applications. This suggests that applications should ideally be blind and not reveal socio-economic information in order to maximize fairness.
References
Arrow, K. (1973): “The Theory of Discrimination,” in Discrimination in Labor Markets. Princeton University Press.
Baert, S. (2018): “Hiring Discrimination: An Overview of (Almost) all Correspon-dence Experiments Since 2005,” in Audit Studies: Behind the Scenes with Theory, Method, and Nuance, vol. 14, pp. 63–77. Springer, Cham.
Banton, M. (1997): “The ethics of practice-testing,” Journal of Ethnic and Migra-tion Studies, 23, 413–420.
Bartoˇs, V. (2015): “(Ne)diskriminace ˇzen pˇri ˇz´adosti o zamˇestn´an´ı v d˚usledku mateˇrstv´ı: Experiment,” IDEA Study, 1/2015.
Becker, G. S. (1957): The Economics of discrimination. University of Chicago Press.
Becker, S. O., A. Fernandes, and D. Weichselbaumer (2019): “Discrim-ination in Hiring Based on Potential and Realized Fertility: Evidence from a Large-Scale Field Experiment,” Labor Economics, 59, 139–152.
Bello, S. L., and I. Morchio (2014): “Parental Links and Labor Market Out-comes: Evidence from the UK,” working paper, Universidad Carlos III de Madrid.
Bertrand, M., and E. Duflo (2017): “Field experiments on discrimination,” in Handbook of economic field experiments, vol. 1, pp. 309–393. Elsevier.
Bertrand, M., and S. Mullainathan (2004): “Are Emily and Greg More Em-ployable than Lakisha and Jamal? A Field Experiment on Labor Market Discrim-ination,” The American Economic Review, 94, 991–1013.
Blau, F., and L. Kahn (1996): “International Differences in Male Wage Inequal-ity: Institutions versus Market Forces,” Journal of Political Economy, 104, 791– 837.
Blommaert, L., M. Coenders, and F. van Tubergen (2013): “Discrimina-tion of Arabic-Named Applicants in the Netherlands: An Internet-Based Field Experiment Examining Different Phases in Online Recruitment Procedures,” So-cial Forces, 92, 957–982.
Bursell, M. (2007): “What’s in a name? A field experiment test for the exis-tence of ethnic discrimination in the hiring process,” SULCIS reports and working papers.
Bygren, M., A. Erlandsson, and M. G¨ahler (2017): “Do Employers Prefer Fathers? Evidence from a Field Experiment Testing the Gender by Parenthood Interaction Effect on Callbacks to Job Applications,” European Sociological Re-view, 33, 337–348.
Carlsson, M., and D.-O. Rooth (2012): “Revealing taste-based discrimination in hiring: a correspondence testing experiment with geographic variation,” Applied Economics Letters, 19, 1861–1864.
Chernozhukov, V., C. Hansen, and M. Spindler (2015): “hdm: High-dimensional metrics,” A package for the statistical software R.
Chevalier, A. (2004): “Parental Education and Child’s Education: A Natural Experiment,” IZA Discussion Paper 1153.
Cortes, P.,andJ. Pan (2018): “Occupation and gender,” in The Oxford Handbook of Women and the Economy, pp. 425–452. Oxford University Press.
Downey, D. B. (1995): “When Bigger Is Not Better: Family Size, Parental Re-sources, and Children’s Educational Performance,” American Sociological Review, 60, 746–761.
Duguet, E., and P. Petit (2005): “Hiring discrimination in the French financial sector: an econometric analysis on field experiment data,” Annales d’Economie et de Statistique, 78, 79–102.
Fibbi, R., M. Lerch, and P. Wanner (2006): “Unemployment and discrimina-tion against youth of immigrant origin in Switzerland: when the name makes the difference,” Journal of International Migration and Integration/Revue de l’integration et de la migration internationale, 7, 351–366.
Giannelli, G. C., and C. Rapallini (2018): “Parental Occupation and Chil-dren’s School Outcomes in Math,” IZA Discussion Paper 11395.
Goldin, C. (2015): “A Pollution Theory of Discrimination: Male and Female Differences in Occupations and Earnings,” in Human Capital in History: The
American Record., pp. 313–348. University of Chicago Press, University of Chicago Press.
Guryan, J., and K. K. Charles (2013): “Taste-based or statistical discrimina-tion: the economics of discrimination returns to its roots,” The Economic Journal, 123, F417–F432.
Ham, R., P. N. Junankar, and R. Wells (2009): “Occupational choice: Per-sonality matters,” IZA Discussion Paper 4105.
Heckman, J. J. (1998): “Detecting Discrimination,” Journal of Economic Perspec-tives, 12, 101–116.
Heckman, J. J., and P. Siegelman (1993): “The Urban Institute Audit Studies: Their Methods and Findings,” in Clear and Convincing Evidence: Measurement of Discrimination in America, p. 187–258, Washington, D.C. The Urban Institute Press.
Huggett, M., G. Ventura, and A. Yaron (2011): “Sources of Lifetime In-equality,” American Economic Review, 101, 2923–54.
K¨ubler, D., J. Schmid, and R. St¨uber (2018): “Gender discrimination in hir-ing across occupations: a nationally-representative vignette study,” Labour Eco-nomics, 55, 215–229.
Kuhn, A., J. Schweri, and S. C. Wolter (2019): “Local Norms Describing the Role of the State and the Private Provision of Training,” IZA Discussion Paper 12159.
Liebkind, K., L. Larja, A. A. Brylka, et al. (2016): “Ethnic and gender discrimination in recruitment: Experimental evidence from Finland,” Journal of Social and Political Psychology, 4, 403–426.
Ludwig, J., S. Mullainathan, and J. Spiess (2017): “Machine learning tests for effects on multiple outcomes,” working paper, Harvard University.
Midtbøen, A. H. (2014): “The invisible second generation? Statistical discrimi-nation and immigrant stereotypes in employment processes in Norway,” Journal of Ethnic and Migration Studies, 40, 1657–1675.
Neumark, D. (2012): “Detecting Discrimination in Audit and Correspondence Studies,” Journal of Human Resources, 47, 1128–1157.
Neumark, D. (2018): “Experimental Research on Labor Market Discrimination,” Journal of Economic Literature, 56, 799–866.
Pager, D. (2007): “The use of field experiments for studies of employment dis-crimination: Contributions, critiques, and directions for the future,” The Annals of the American Academy of Political and Social Science, 609, 104–133.
Petit, P. (2007): “The effects of age and family constraints on gender hiring dis-crimination: A field experiment in the French financial sector,” Labour Economics, 14, 371–391.
Phelps, E. S. (1972): “The Statistical Theory of Racism and Sexism,” The Amer-ican Economic Review, 62, 659–661.
Riach, P. A., and J. Rich (2002): “Field Experiments of Discrimination in the Market Place,” The Economic Journal, 112, F480–F518.
Riach, P. A., and J. Rich (2004): “Deceptive field experiments of discrimination: are they ethical?,” Kyklos, 57, 457–470.
Rich, J. (2014): “What Do Field Experiments of Discrimination in Markets Tell Us? A Meta Analysis of Studies Conducted Since 2000,” IZA Discussion Paper 8584.
Romano, J. P., and M. Wolf (2005): “Exact and Approximate Stepdown Meth-ods for Multiple Hypothesis Testing,” Journal of the American Statistical Associ-ation, 100, 94–108.
Romano, J. P., and M. Wolf (2016): “Efficient computation of adjusted p-values for resampling-based stepdown multiple testing,” Statistics and Probability Letters, 113, 38–40.
State Secretariat for Education, Research, and Innovation (2013): “Relationship between public and private schools in Switzerland,” technical report.
State Secretariat for Education, Research, and Innovation (2018): “Vocational and Professional Education and Training in Switzerland: Facts and
Swiss Coordination Centre for Research in Education (2018): “Swiss Education Report 2018,” technical report.
Weichselbaumer, D. (2003): “Sexual orientation discrimination in hiring,” Labour Economics, 10, 629–642.
Wood, M., J. Hales, S. Purdon, T. Sejersen, and O. Hayllar (2009): “A test for racial discrimination in recruitment practice in British cities,” Department for Work and Pensions Research Report.
Zhou, X., J. Zhang, and X. Song (2013): “Gender Discrimination in Hiring: Evidence from 19,130 Resumes in China,” working paper, Xi’an Jiaotong Univer-sity.
Zschirnt, E. (2019): “Evidence of Hiring Discrimination Against the Second Gen-eration: Results from a Correspondence Test in the Swiss Labour Market,” Journal of International Migration and Integration, pp. 1–23.
Zschirnt, E., and R. Fibbi (2019): “Do Swiss Citizens of Immigrant Origin Face Hiring Discrimination in the Labour Market?,” working paper, University of Neuchˆatel.