HAL Id: hal-00020380
https://hal.archives-ouvertes.fr/hal-00020380
Submitted on 9 Mar 2006HAL is a multi-disciplinary open access archive for the deposit and dissemination of sci-entific research documents, whether they are pub-lished or not. The documents may come from teaching and research institutions in France or abroad, or from public or private research centers.
L’archive ouverte pluridisciplinaire HAL, est destinée au dépôt et à la diffusion de documents scientifiques de niveau recherche, publiés ou non, émanant des établissements d’enseignement et de recherche français ou étrangers, des laboratoires publics ou privés.
for Mars exploration: Imaging subsurface geology and
detecting shallow moisture
Philippe Paillou, Y. Lasne, Essam Heggy, J.-M. Malézieux, G. Ruffie
To cite this version:
Philippe Paillou, Y. Lasne, Essam Heggy, J.-M. Malézieux, G. Ruffie. A study of P-band SAR applicability and performance for Mars exploration: Imaging subsurface geology and detecting shal-low moisture. Journal of Geophysical Research. Planets, Wiley-Blackwell, 2006, 111, pp.E06S11. �10.1029/2005JE002528�. �hal-00020380�
A study of P-band SAR applicability and performance for Mars
exploration: Imaging subsurface geology and detecting shallow
moisture
Philippe PAILLOU
Observatoire Aquitain des Sciences de l’Univers, UMR 5804 2, rue de l’Observatoire, BP 89, 33270 Floirac, France
Tel: +33-557 776 126 Fax: +33-557 776 110 E -mail: [email protected]
Yannick LASNE
Observatoire Aquitain des Sciences de l’Univers, UMR 5804, Floirac, France
Essam HEGGY
Lunar and Planetary Institute, Houston, TX 77058, USA
Jean-Marie MALEZIEUX
Institut EGID, Université Bordeaux 3, Pessac, France
Gilles RUFFIE
Laboratoire PIOM, UMR 5501, ENSCPB, Pessac, France
Over the past decade, orbital images of the Martian surface revealed key e vidences about the history of the planet environment (craters, faults, paleo-lakes and rivers), partially hidden under a widespread layer of aeolian deposits. Furthermore, several recent observations and studies support the hypothesis that water could be found in the shallow sub-surface of Mars. Low frequency SAR – Synthetic Aperture Radar – has demonstrated its subsurface imaging capabilities on Earth, especially in arid regions. While SAR potentials for Mars exploration have already been widely discussed, we present here results of a theoretical and parametric study, based on the experience we gained from terrestrial surveys on Mars analog test sites, which evaluates the capabilities of a P-band (430 MHz) SAR for Mars exploration, for both shallow subsurface geology mapping and moisture detection. We suggest that a P-band polarimetric SAR can probe the first meters of the Martian subsurface to reveal the dust-covered geology and to monitor moisture changes over large scales.
1. Introduction
The NASA Mars exploration has defined the “follow the Water” strategy as one of its highest priorities in order to understand past geological and climatic history of the planet. Liquid water appears to have existed in the past history of Mars, leaving various tracks such as valley networks and outflow channels [Carr, 1996]. A large amount of water is likely to be present in the subsurface of Mars, in the form of ice or possibly locally liquid water, at depth ranging from a couple of meters to several kilometers [Clifford, 1993].
As far as liquid water is concerned, one of the most important recent discoveries are the numerous geologically young features, resembling terrestrial water-carved gullies, observed by the Mars Observer Camera (MOC) onboard the Mars Global Surveyor spacecraft at mid and high latitudes. As they are superposed on “geologically young” surfaces such as dunes and permafrost polygons, these small-scale gully features are believed to indicate recent, i.e. within the past few million years, superficial flows of liquid water [Malin et al., 2000; Mellon et al., 2001; Mellon et al., 2004]. Numerous models have been proposed to explain the origin of Martian gullies. Using a general circulation model to calculate ground temperature and pressure conditions above the triple point and below the boiling point, [Haberle et al., 2001] determined the current locations on Mars where pure liquid water or brine solutions could exist in the present climate. [Mellon et al., 2001] evaluated two mechanisms for the formation of gullies: solar heating with subsurface conduction or geothermal heating at shallows depths. [Malin et al, 2000] also suggested shallow aquifers as the cause of a massive outflow of water from the regolith which carved the gully features, while [Costard et al., 2002] considered the role of topography where the melting of shallow ground-ice is the source of water at high latitudes during periods of high obliquity. Using a simple model for local heat transport, [Hetch, 2002] suggested that transient melting of ice in the form of a seasonal trickle of small water flows may occur in depressions almost everywhere on Mars where thin ice is illuminated by normal incidence exposure. Recently, [Christensen, 2003] suggested that the gullies may be formed from melting ice within snow packs deposited during high obliquity periods and still remaining in almost permanently shaded slopes. Using the neutron spectrometer of the Gamma-Ray Spectrometer onboard Mars Odyssey, [Mitrofanov et al., 2002; Feldman et al., 2004] produced maps of ground-ice (in the form of water or hydrated minerals) in the upper few meters of the Martian surface at mid and high latitudes. These authors propose a two-layer model of the regolith, presented as a water-ice rich layer buried beneath a relatively dry hydrogen-poor layer. The analysis
of all these results provides a strong scientific rational to search for residual amounts of liquid water in the first few meters of the Martian subsurface.
Much of the Martian surface has been intensely shaped and reworked by aeolian processes, so that a widespread layer of dust now covers large portions of the planet. Polar layered deposits of Mars show thick accumulations of dust in the past. [Tanaka, 2000] considers that widespread and voluminous accumulation of dust occurred during the Noachian, generated by impacts, volcanism and surface processes, the Arabia deposits having formed as dust accumulation waned. During the Early Hesperian, thick dust sedimentation may have occurred essentially in the south pole and deep Hellas and Argyre basins, but north polar sedimentary records prior to the Amazonian are largely obscured. Deposits at Electris and Medusae Fossae may have been produced by local sources of fine-grained materials, for instance volcanic eruptions. Large regional fine dust deposits could be observed on Mars: they are located in northern equatorial regions (Tharsis, Arabia, Elysium). The thickness of these dust deposits were estimated to 0.1 – 2 m, in all case less than 5 m, and the age of the deposits are estimated at 1 Ma [Christensen, 1986a]. [Christensen, 1986a] proposed a cyclic aeolian process of deposition and removal of the dust. Local observations at the Mars Pathfinder landing site show very fine-grained (micron-size) dust deposition at rates of about 20 – 45 µm per year. This value is consistent with previous studies of dust deposition on Mars and dust devils seem to play a major role [Johnson et al., 2003]. Dust deposits also show dynamic behavior: the MOC has repeatedly imaged slope streaks in dust-covered regions on Mars. Variations in dust deposition could explain the observed changes in the formation rate of such mass movements [Aharonson et al., 2003]. At present, no method is available to estimate the aeolian dust thickness at a global scale. [Vincendon et al., 2003] proposed to study the disturbance of the small impact crater distribution to estimate a dust layer thickness: a map of dust thickness in Arabia Terra was produced, with a maximal thickness reaching 50 m. It is then very likely that a significant number of geological features, such as river networks [Mangold et al., 2004], witnesses of the past environment of Mars, are hidden under meters to tens of meters of “Martian dust”.
It is then clear that a better understanding of the history of Mars requires the exploration and characterization of its subsurface: paleogeography (e.g. drainage networks and paleo-lakes) and geological structures (e.g. impact craters and faults) may be still hidden under the dust cover, and liquid water could be present in the near subsurface. Earth remote sensing experiences on several Mars analogs have shown that one of the best instrument to address a shallow subsurface mapping task on a global scale is orbital radar. Low frequency sounding radars, such as MARSIS onboard Mars Express and SHARAD foreseen for Mars Reconnaissance Orbiter, are dedicated to deep (several hundreds of meters) sounding with a low spatial resolution, with a main scientific goal to
map deep subsurface water. Using aperture synthesis techniques, synthetic aperture radar (SAR) provides high resolution imaging capabilities of planetary surfaces from orbit that complement these ongoing radar experiments by providing a detailed data for the top few meters of the Martian subsurface (a blind zone for the aforementioned low frequency sounding radars). A successful SAR mission revealed the surface of Venus in the 90s [Saunders et al., 1992] and the technique is still widely used for Earth observation [Elachi, 1988]. We present here a study of the potential of a low frequency imaging SAR to map the shallow subsurface of Mars: we rely on results obtained for comparative test sites to extrapolate our models to the Martian case, taking into account the geology of Mars. This work intends to provide a proof of concept and utility for a potential P-band SAR mission that could be sent to Mars within the next decade [Paillou et al., 2001a; Campbell et al., 2004a].
2. The Terrestrial Case: Subsurface Geology and Moisture Detection
2.1. Subsurface Geology
Low frequency orbital SAR in L-band (1.25 GHz) allows us to investigate the subsurface down to several meters over arid areas, when covered by dry material such as sand [McCauley et al., 1982; Elachi et al., 1984; Schaber et al., 1986; Abdelsalam et al., 1996; Schaber et al., 1997]. Subsurface imaging using SAR presents then high potential for terrestrial applications in arid and semi-arid environments, such as hydrology, geological mapping, natural hazard monitoring, and archaeology. “Subsurface geology” down to a couple of meters is made of a complex combination of materials (generally sediments) and structures, and the ground truth needed for model development and inversion is hard to obtain. Few outdoor and laboratory experiments were conducted to actually measure the microwave penetration in desert soils [Farr et al., 1986; Schaber et al., 1986; Mätzler, 1998; Paillou et al., 2001b; Williams and Greeley, 2001; Heggy et al., 2001], and approaches based on a combination of GPR – Ground-Penetrating Radar – and SAR data proved to be successful: the GPR is operated to derive geometrical and dielectric characteristics of the subsurface structures which are then used as input for the interpretation of the SAR image [Grandjean et al., 2001; Paillou et al., 2003a].
One of the most interesting results regarding subsurface imaging with SAR was obtained more than 20 years ago by [McCauley et al., 1982] for a site located in southern Egypt, the Bir Safsaf region, using the Shuttle Imaging Radar (SIR). SIR-A radar revealed buried and previously
unknown paleodrainage channels. Several field expeditions were afterwards undertaken in this region in order to explore and understand the geology of subsurface structures and their relationship with the radar signal [Schaber et al., 1986; Paillou et al., 2003a]. However, the limited geographical coverage of Shuttle Imaging Radar missions did not allow regional scale mapping of hidden hydrological and tectonic structures of East Sahara, and scientific interpretations of available data remain partial and incomplete. Nevertheless, complete L-band radar coverage of East Sahara by the Japanese JERS-1 satellite (operated by JAXA from 1990-1998) exists but has yet to be fully exploited. Although JERS-1 radar mosaics have been realized over large equatorial regions for the study of tropical vegetation, mapping of the arid regions of Africa and Arabia has not been considered. We then realized the first global radar mosaic of East Sahara, covering Egypt, northern Sudan, eastern Libya and northern Chad, from JERS-1 images at a resolution of 50 meters (cf. Figure 1). The production and scientific analysis of a geocoded mosaic generated from more than 1600 radar scenes will reveal the near-surface geology hidden by the superficial sand layer [Paillou et al, 2003b].
Such a dataset has contributed to the discovery of a number of unknown subsurface structures (rivers, lakes, faults, impact craters) and will help answer several key questions about the climatic, geological, and hydrological recent history of East Sahara. Primary analysis of this radar mosaic already allowed the discovery of a double impact crater in south-east Libya [Paillou et al., 2003c] and a potential giant impact crater field in south-western Egypt [Paillou et al., 2004].
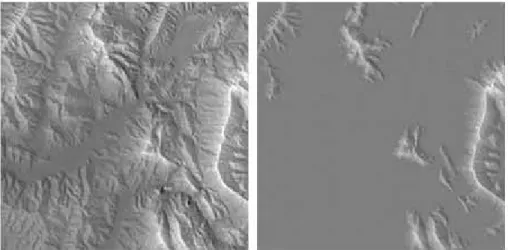
Figure 1: Landsat-ETM image (left) and JERS-1 L-band SAR image (right) of northern Sudan showing
ancient valley network hidden under sandy sediments. The scene covers 400 x 350 km, the SAR scene has a resolution of 50 m and penetration depth is about 2 m.
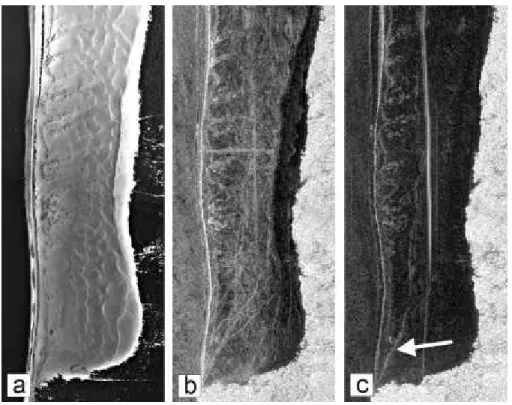
Besides it penetration capabilities in arid surfaces, SAR is also sensitive to soil moisture through the variation in dielectric constant of materials: soils containing water present a higher permittivity and are then more reflective for the radar. SAR data can then be used in order to monitor changes in soil moisture [Ulaby et al., 1986]. Several experimental and theoretical studies, based on both empirical and semi-empirical approaches, have investigated this potential [Dubois et al., 1995; Oh et al., 1992; Okamura et al., 2000]. We investigated the potentials of L-band SAR systems to map subsurface wet structures on an experimental test site, the Pyla dune in France. Paleosoils, acting as moisture traps, are buried inside the dune under a dry sand cover, and they could be detected down to 3.5 m using an airborne L-band polarimetric SAR [Grandjean et al., 2001] (cf. Figure 2).
Figure 2: Airborne optical (a) and SAR (b, c) images of the southern part of the Pyla sand dune in
France. HV polarization image (c) shows subsurface moisture related to paleosoils (arrow). SAR images have a resolution of 1 m and penetration depth is about 4 m.
Whereas classical moisture detection techniques rely on the amplitude of the radar signal, we recently proposed to consider the co-polar phase information to map subsurface moisture [Lasne et al., 2004]: by analyzing polarimetric SAR data, we established that a phase difference of 23o between horizontal (HH) and vertical (VV) channels was correlated to the buried wet structures, allowing the detection of the paleosoil down to 5.2 m. Field measurements using truck-mounted horn antennas and time-domain analyzer confirmed the phase signal. We modeled the phenomenon
using a two-layer Integral Equation Model (IEM) [Fung, 1994], taking into account both single and multiple scattering components of the backscattered radar wave [Lasne et al., 2005].
Considering the penetration capabilities of L-band SAR in dry sand, of the order of a couple of meters [Schaber et al., 1986; Grandjean et al., 2001; Paillou et al., 2003a], together with the fact that the Martian dust is likely to be less favorable to radar penetration due to its iron content [Paillou et al., 2001b], we have to go to longer radar wavelengths in order to explore the shallow subsurface of Mars. For a wavelength λ, the 1/e penetration depth δP in a medium of dielectric constant ε = ε ’-jε”
is given by [Ulaby et aL, 1982]:
( )
2 12 ' '' ' 1 1 2 4 − − + = ε ε ε π λ δP (1)A L-band (1.25 GHz) SAR should then penetrate 1.3 m in dry sand (ε = 2.85-0.05j, cf. [Paillou et al., 2003a]), whereas a P-band (435 MHz) SAR should penetrate 1.9 m in a typical “Martian dust” (ε = 5.87-0.14j, cf. section 3). Although no orbital platform was yet developed for Earth observation, experimental P -band SAR onboard aircrafts such as AIRSAR or RAMSES have demonstrated higher penetration capacities [Farr, 2001; Paillou et al., 2002]. Also, as the Martian soil is likely to contain high quantities of impact deposits and ejecta [Newsom, 1980], a long-wave radar such as P -band should be less sensitive to possible volume scattering occurring in the first meters of the subsurface.
A potential problem, when dealing with phase measurements and orbital SAR, is the effect of free electrons in the ionosphere: the Faraday rotation, depending on the TEC (Total Electron Content) of the ionosphere, the planet’s magnetic field B and the SAR frequency f, can cause polarization rotation of linearly polarized waves as given by [Davies, 1990]:
2 6 10 35 . 1 f TEC B = φ (in degrees) (2)
The rotation can reach several degrees for L-band SAR orbiting around Earth and about 30o at P-band at high latitudes during the daytime. However, Mars present no magnetic field (except at some locations on its surface) and its ionosphere is likely to contain very low TEC [Krymskii et al., 2004], so it should not affect an orbital SAR.
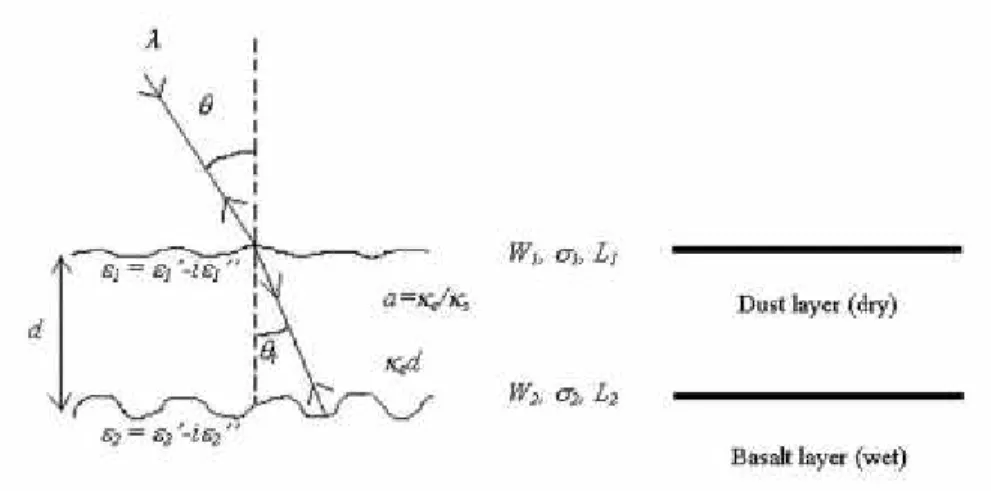
A first step for modeling the SAR performances in terms of penetration depth and signal backscattering is to build a reasonable geological and electromagnetic model for the shallow subsurface of Mars. Such work was already done by [Heggy et al., 2001; Heggy et al., 2003] in order to estimate penetration capabilities of low frequency sounding radar such as MARSIS and SHARAD. We shall consider here a two-layer model for the first meters of the Martian subsurface. Figure 3 shows a sketch of this model, with parameters which have to be estimated for further radar simulation: a superficial dry layer of “Martian dust”, of thickness d, covers a wet (or dry) layer of basaltic bedrock. The dust layer is characterized by its dielectric constant (real part ε1’ and
imaginary part ε1”), its surface roughness (height standard deviation σ1, correlation length L1,
autocorrelation function W1 [Dierking, 1999]), its albedo a (the ratio between the extinction
coefficient κe and the diffusion coefficient κs) and its optical depth κed. The surface roughness is a
crucial parameter related to the density and size of rocks covering the surface [Campbell, 2001]. The dielectric constant depends on the mineralogical composition and porosity of the layer (we do not here take into account possible magnetic properties of the Martian soil [Morris et al., 2000], but this will be considered in future work), its albedo and optical depth being related to heterogeneities (rock clasts) present in the subsurface. The basalt layer is also characterized by its roughness (height standard deviation σ2, correlation length L2, autocorrelation function W2) and dielectric constant
(real part ε2’ and imaginary part ε2”), the latter one varying in considerable ways depending on the
moisture content of the layer. It should be noted that when containing significant amount of water, the “roughness” of the basalt layer can be controlled by the water distribution rather than by the geological interface between dust and basalt. This two-layer model is illuminated by a radar wave of frequency λ arriving with an incidence angle θ. Such a simple two-layer model does not describe the actual complexity of the geology of the first meters of the Martian subsurface, nevertheless it is a first step to evaluate performances of polarimetric imaging radar in a Martian context. The validity of our results strongly depends on the choice of realistic values for all the above described parameters, taking into account what we know about the geology of Mars. From the radar point of view, the most important parameter is the local incidence angle θ which can be obtained from Digital Elevation Models (DEM) of Mars. Then comes the surface roughness which can be estimated from landscape images of the Martian surface taken by various landers and rovers. Finally comes the dielectric constant, albedo and optical depth of the geological layer: these parameter values are derived from laboratory measurements performed on terrestrial analogs.
Figure 3: Geometry of the two-layer geo-electrical model used to simulate the SAR response of the first
meters of the Martian subsurface. The upper layer is described by its dielectric constant, thickness (a few meters here), surface roughness and volume scattering parameters, the lower layer is described by its
dielectric constant and surface roughness.
In order to characterize the first layer of “Martian dust”, we have to consider that the surface of Mars is covered by a widespread layer resulting of the erosion of volcanic formation. In situ measurements made by Viking, Mars Pathfinder and MER missions, as well as orbital observations by Mars Global Surveyor (TES instrument) and Mars Express (Omega instrument), indicate the presence of iron-oxide rich elements such as Hematite, Maghemite, Goethite and Jarosite all over the Martian surface [Rieder et al., 1997, Christensen et al., 2000; Christensen et al., 2004; Klingelhöfer et al., 2004; Rieder et al., 2004; Bibring et al., 2005]. Recently, the neutron spectrometer onboard Mars Odyssey as well as the Omega instrument onboard Mars Express indicated that evaporites could also be present on the Martian surface (hydrated sulfate for instance) [Mitrofanov et al., 2002; Gendrin et al., 2005]. The Martian surface is also very likely to contain meteoritic material accumulated for millions of years. We then simulated a typical “Martian dust” by mixing basalt, iron oxides, salts and Chondrites. The basaltic substratum was simulated using a basalt from East Africa (Djibouti) which appears to be comparable to Martian basalts [Paillou et al., 2001b]. In order to dispose of realistic values for the dielectric constants of our two-layer geo-electrical model, we characterized various rocks and minerals at a central frequency of 430 MHz (P-band). We used both capacitive and open coaxial cells connected to HP4291A impedance analyzer to measure the real and imaginary parts of the dielectric constant of both dry powder and pellet samples. Some results obtained for the P-band are presented in Table 1. For a “Martian dust” mixture composed of 45% Djiboutian basalt, 10% Hematite, 10% Goethite, 10% Maghemite, 10% Chondrite, 5% Pyroxenolite, 5% Chlorite and 5% Gypsum, we used the second formula of
Lichtenecker [Lichtenecker et al., 1931] in order to compute the total dielectric constant εm of the
mixture from the dielectric constant εi of each individual constituent:
∏
= = n i i m i 1 φ ε ε (3)where φi is the volume fraction of the component i. We finally obtained a value of ε1 = 5.87-0.14j
for the covering dust layer. [Williams et al., 2004] measured comparable values using Carbondale Red Clay and Mars JSC-1 soil simulant. In a similar way, we computed the dielectric constant of basalt mixed with various amount of water content, from the dielectric constant of dry basalt (cf. Table 1) and the dielectric constant of pure water for the P-band (εw = 86.75-3.77j) [Ulaby et al.,
1986]. The case of basalt mixed with ice, which can also be relevant for the Martian case, will not be considered since water ice presents a low dielectric constant (typically εi = 2.9-0.002j for P-band
at -20oC [Ulaby et al., 1986]) that cannot significantly change the electrical properties of geological materials.
Sample Basalt Hematite Maghemite Goethite Pyroxenolite Chlorite Gypsum Chondrite Water
e’ 4.19 25.72 14.25 3.86 4.55 4.07 3.63 5.75 86.75
e” 0.178 1.447 1.47 0.071 0.092 0.023 0.015 0.202 3.77
dust % 45 10 10 10 5 5 5 10 -
Table 1: Dielectric constant measured at 430 MHz for various rocks and minerals relevant for Mars. All
samples were in powder form except basalt for which a pellet was used. Percentages assumed in the Martian dust mixture are indicated.
The albedo, optical depth and roughness parameters of the superficial layer are estimated from the analysis of Martian landscapes captured by Viking, Mars Pathfinder and MER missions. Such data were analyzed to study the rock-size distribution at the surface of Mars for various landing sites [Golombek et al., 1997, Golombek et al., 2003]. Also, the rock abundances over large regions of the Martian surface were studied using thermal signatures of the surface [Christensen, 1986b; Moore et al., 1989]. Studies indicate that 50% of the Martian surface has rocks covering 8% of the surface of which 2% are larger than 20 cm (e.g. Chryse Planitia, the Viking 1 landing site). Few terrains, such as Viking 2 landing site in Utopia Planitia, present a rock cover of more than 20% with 1% rocks larger than 50 cm. [Golombek et al., 1997] proposed a rock-size distribution law in the form of:
D k q k D ke
where Fk(D) is the cumulative fraction of the surface covered by rocks of size larger than D, k is the
total area of the rock cover weighted by the rock diameter D and q(k) is the exponential decrease factor characterizing the area, depending on k. Examples of rocky and smooth regions are presented in Figure 4, with corresponding values of k . In order to derive values for the albedo and optical depth, we can extrapolate the use of k, designed for surface description, to a parameter fD
representing the volume fraction of rocks of diameter D in the superficial layer. The density of rock can then be expressed by:
3 6 D f N D π = (5)
and the diffusion and extinction coefficients can be obtained using [Fung, 1994]:
m s m s m D s D f ε ε ε ε λ ε π κ 2 4 4 2 ' 3 4 + − = (6) + + − = 2 " " ' " 2 3 ) 1 ( 2 2 m s m m s m D m D a f f ε ε ε ε ε ε ε λ π κ (7)
where εm is the dielectric constant of the “Martian dust” and εs is the dielectric constant of the rock
clasts (we shall consider here basalt).
Figure 4: Left: Landscape of the Ares Vallis region taken by Mars Pathfinder, corresponding to a value
k=0.2. Right: Landscape of the Spirit rover landing site close to Gusev crater, corresponding to a value k=0.05. Source NASA.
In the following, we shall simply divide the Martian surface into two different cases: a radar “favorable” case and a radar “unfavorable” case. The favorable case roughly corresponds to the Northern hemisphere of Mars: a smooth superficial layer of Martian dust, containing very few rock clasts, covering a basalt bedrock. The superficial layer will then be characterized by a small value for the fD parameter and will present a limited volume scattering contribution in the backscattered
radar signal. We shall consider fD ranging between 0 and 0.02 for a mean clast diameter D = 4 cm.
unfavorable case, which better represents cratered terrains of the southern hemisphere, will be modeled by an heterogeneous superficial layer containing higher densities of rock clasts, corresponding to higher values for the fD parameter between 0.08 and 0.2 and a mean clast diameter
D = 10 cm. The surface roughness will also be higher in that case: we shall consider σ1 = 1.5 to 3.5
cm and L1 = 10 cm. In both cases, the subsurface layer of basalt will be characterized by roughness
parameters σ2 = 3.5 cm and L2 = 10 to 12 cm, its dielectric constant varying from ε2 = 4.19-0.178j
(dry basalt) to ε2 = 86.75 -3.77j (pure liquid water).
4. IEM Modeling of the SAR Backscattering Coefficient
Modeling of microwave scattering is still an active topic. First models for the study of planetary surfaces were driven by ground-based observations of the Moon and Venus [Hagfors et al., 1974]. The availability of orbital SAR for Earth observation quickly induced several studies to model the sensitivity of radar to surface roughness (defined in comparison to the radar wavelength) and dielectric constant. The description of several models can be found in [Ulaby et al., 1982; Fung, 1994]. Among most used analytical models, we find the Geometrical Optics (GO) model assuming a stationary phase for very rough surfaces, the Physical Optics (PO) model based on a scalar approximation of the electromagnetic fields for medium-rough surfaces and the Small Perturbation Model (SPM) which is valid only for smooth surfaces. [Fung et al., 1992] proposed a more complete analytical model, the Integral Equation Model (IEM), based on a simplified expression of tangential fields. It allows to take into account both single and multiple scattering components of the radar wave [Wu et al, 2001] and the IEM model is also valid for a wider range of roughness parameters than the other models, allowing to take into account various surface types. The domain of validity of the IEM model can be defined by the relationships:
m
kL k
kσ<1 σ < ε (8)
where σ and L describe the roughness of a surface of dielectric constant εm, illuminated by a wave
of wavenumber k = 2π /λ. For P-band at 430 MHz and a typical volcanic material of permittivity around 6, σ should be smaller than 10 cm and L should be smaller than 30 cm.
The radar backscattering coefficient can be expressed as the sum of a single scattering component and a multiple scattering component:
M qp S qp qp σ σ σ0 = + (9)
where q and p indicate the polarization state of the emitted and received wave respectively (H for horizontal and V for vertical). The single scattering coefficient is expressed by:
∑
∞ = − − = 1 ) ( 2 ) ( cos 2 ! ) 0 ), sin( 2 ( 4 ) ( 2 2 2 n n n qp k S qp n k W I e k θ θ σ θσ (10) with:[
( sin( ),0) ( sin( ),0)]
2 ) ) cos( ( ) ) cos( 2 ( 2cos2( ) 2 θ θ σ θ σ θ f e θσ k F k F k k I qp qp n k qp n n qp = + − + − (11) and: n L v u n Le n v u W 4 ) ( ) ( 2 2 ) , ( = π − + (12)being the Fourier transform of the nth power of the surface correlation function, that we shall consider Gaussian in the following. fqp and Fqp are respectively the coefficient of the Kirchoff fields
and complementary fields [Fung, 1994]. The multiple scattering coefficient is expressed by:
(
)
× =∑
∑
∞ = + ∞ = − ! ! ) ( cos 2 4 ) ( 1 2 2 2 1 ) ( cos 3 2 2 2 2 m m n n k M qp m n k e k σ θ π θ σ σ θ[
]
− + +∫∫
Re fqp*Fqp(u,v) W(n)(u kx,v)W(m)(u kx,v)dudv(
)
×∑
∑
∞ = + ∞ = − ! ! ) ( cos 16 1 2 2 2 1 ) ( cos 2 2 2 2 2 m m n n k m n k e k σ θ π θ σ[
Fqp(u,v)2+Fqp*(u,v)Fqp*(−u,−v)]
W(n)(u+kx,v)W(m)(u−kx,v)dudv∫∫
(13)where kx = k sinθ and (u,v) are the variables of the Green’s function. We also have to take into
account a volume scattering term which should be added to the single and multiple scattering terms in order to simulate the diffusion effects of clasts in the superficial layer:
(
d)
qp e s V qp T12T21 e cos(2 t) P e 1 ) cos( 2 1 ) ( θ κθ κ κ θ σ = − − (14)where Tij is the Fresnel transmission coefficient from medium i to medium j and Pqp has a value 1.5
for the co-polar case and 0 for the cross-polar case [Fung, 1994].
If we consider now the two-layer case as described in Figure 3, the total radar backscattered power will be expressed as the coherent contribution of the two layers:
) ( ) ( ) ( ) ( 0 2 0 1 0 1 0 θ σ θ σ θ σ θ σqp = Sqp + V qp + SS qp (15)
with σ0S1qp being the surface component of the dust layer of thickness d (cf. equation (9) with
equation (14) with parameters κe and κs), and σ0SS2qp being the subsurface component of the basalt
layer of parameters ε2, σ2 and L2, attenuated by the first layer. It is given by:
) ( ) cos( ) cos( ) ( 0 2 ) cos( 2 21 12 0 2 e t qp S d t qp SS T T e tσ θ θ θ θ σ = − κθ (16)
where σ0S2qp is obtained from equation (9) for the basalt layer parameters and θt is the angle
between the transmitted radar wave and the normal to the surface. Equation (15) allows to simulate the radar scattering of the two-layer case, taking into account both multiple and volume scattering terms, which are relevant for the Martian case [Baron et al., 1998, Harmon et al., 1999].
Expression (15) allows to compute the amplitude of the backscattered radar wave for various polarizations, HH and VV for instance. As regards the phase difference between HH and VV channels which can be used to detect subsurface moisture, it is given by [Lasne et al., 2004]:
) ) cos( ) sin( ( ) ) cos( ) sin( ( 0 2 0 1 0 1 0 2 0 2 0 1 0 1 0 2 P vv SS vv V vv S P vv SS P hh SS hh V hh S P hh SS VV HH Arctg Arctg ϕ σ σ σ ϕ σ ϕ σ σ σ ϕ σ + + − + + = Φ − (17)
where the expression of the phase ϕP only depends on the superficial layer thickness [Lasne et al.,
2005].
5. Simulation Results
5.1. Subsurface Geology
Previous work already evaluated the potentials of a low frequency SAR for mapping buried structures, using a simple two-layer model of the Martian surface and radar scattering being simulated with the Small Perturbation Model [Campbell et al., 2004b]. However, the proposed approach relies on a single scattering surface term and is mainly valid for smooth surfaces. It also does not take into account the possible screening effect of rock clasts in the superficial layer (no volume scattering component) and considers dielectric constants for the Martian materials which are lower than the ones we obtained from laboratory measurements. Result of the study nevertheless shows that a P-band orbiting SAR, with HH and VV polarization capabilities, should be able to map subsurface geology down to several meters.
In order to simulate the performances of a P-band (430 MHz) SAR for subsurface geology mapping on Mars, we considered a subsurface bedrock of basalt with paleo-topographic features, the deepest structures being located 10 meters under the surface. The bedrock was then covered with a 4 m thick layer of our “Martian dust” mixture. Figure 5 shows the subsurface basalt before
classical optical sensor such as MOC would see. Our SAR simulator combines a radiometric module, based on the two-layer IEM approach previously described, with a geometric module which allows, for a given incidence angle chosen here to 30o, to take into account SAR forshortening, layover and shadowing effects. We simulated radar images for a 430 MHz SAR operating in HH polarization for both the “favorable” northern hemisphere case and the “unfavorable” southern hemisphere case as described in section 3. As the response of natural volcanic surfaces is generally higher for VV polarization [Campbell et al., 1993], simulations in HH polarization provide a kind of “low limit” for the backscattered power. The northern hemisphere case is characterized by a superficial layer containing very few and little rock clasts, i.e. a = 0 and κed = 0.5 m, causing no volume scattering effect. On the opposite, the southern hemisphere case
presents a superficial layer with a considerable amount of rock clasts, i.e. a = 0.08 and κed = 2 m,
leading to a strong volume scattering effect which is added to the surface and subsurface scattering components. For each case, we simulated a SAR image for a dry basalt bedrock (ε2 = 4.19-0.178j)
and for a wet basaltic substratum (ε2 = 14.08-0.604j, corresponding to a water content of 40%).
Roughness parameters for the dust layer were chosen to be σ1 = 0.5 cm and L1 = 10 cm and we
took σ2 = 3.5 cm and L2 = 12 cm for the subsurface basalt layer. Results for the “favorable” and
“unfavorable” case are respectively presented in Figures 6 and 7. The radar backscattered coefficient is computed in decibels and transformed into gray values with a linear look-up-table to produce images. For all cases, the backscattered power for outcropping areas (dry basalt layer not cover by dust) is varying between -10 and -12 dB, depending on the local slope.
Figure 5: Left: DEM simulating the subsurface basaltic bedrock (height range is 10 m, source IGN).
Right: The same landscape when covered by 4 m of “Martian dust”. The scene covers 25 x 25 km and the pixel size is 50 m.
Figure 6 shows result for the favorable case of an homogeneous superficial layer containing no rock clasts, i.e. no volume scattering effect screens the subsurface signal. For the dry case, σ0HH
varies between -19 and -28 dB, meaning that deeper structures at 4 m correspond to a return higher than -30 dB (a reasonable limit for an orbital P-band SAR [Oberto, 2000]). In the case of a wet subsurface layer, σ0HH varies between -13 and -26 dB: subsurface structures show a stronger return
because of their higher dielectric constant, making them easier to detect.
Figure 6: Simulated P -band SAR images (HH polarization) for the northern hemisphere “favorable” case.
Left: SAR image for a dry subsurface. Right: SAR image for a wet subsurface.
Figure 7 presents simulation results for the unfavorable case: the superficial layer contains rock remains which produce a disturbing volume scattering component. For a dry subsurface layer, σ0HH
varies between -14 and -19 dB, a smaller dynamics than the one obtained for the favorable case: volume scattering is of the same order of magnitude as the subsurface component, reducing the discriminating capacities of the radar. In the case of a wet subsurface layer, σ0HH varies between -12
and -14 dB: the global backscattered power is increased by a more reflective subsurface layer, but the dynamics remains poor. Even if some buried structures can still be detected by the radar in the unfavorable case, volume scattering in the superficial layer strongly reduces the subsurface imaging capabilities of the instrument. In both favorable and unfavorable cases, a penetration depth of 4 m seems to be achievable using a P-band SAR.
Figure 7: Simulated P-band SAR images (HH polarization) for the southern hemisphere “unfavorable
case”. Left: SAR image for a dry subsurface. Right: SAR image for a wet subsurface. 5.2. Moisture Detection
Previous work performed on the Pyla sand dune in France have demonstrated the potential of the co-polar radar phase to detect subsurface moisture. We computed a ΦHH-VV phase value for both
“favorable” and unfavorable” Martian cases using equation (17), for three different incidence angles of the radar beam: 20o, 30o and 40o.
For the favorable case, we considered a surface dust layer of parameters: ε1 = 5.87-0.14j, σ1 =
1.5 cm, L1 = 10 cm, fD = 0.02 and D = 4 cm. The subsurface layer was characterized by ε2 ranging
from 4.19 -0.178j (dry basalt) to 86.75 -3.77j (pure liquid water), σ2 = 3.5 cm and L2 = 10 cm.
Results presented in Figure 8 show a phase increase with the incidence angle value. This is due to the increase of the multiple scattering term which contributes to the phase difference [Lasne et al., 2005]. For an incidence angle of 40o, we can observe a phase difference reaching 26o when the subsurface water content is higher than 40%. The subsurface effect is confirmed by the fact that the phase difference becomes zero when the surface and subsurface layers have the same dielectric constant (left part of Figure 8). A water content of more than 40% in the first meters of the Martian subsurface is unlikely, but Figure 8 (right) shows that the co-polar phase also presents strong changes (up to 21o) when the subsurface moisture content changes from zero (dry basalt) to only a few percents. A small seasonal change in the moisture content of the Martian subsurface could then be detected using the radar phase information.
Figure 8: Simulated co-polar phase ΦHH-VV for the “favorable” case as a function of the moisture content of
the subsurface layer for three incidence angles: 20o
, 30o
and 40o
. Left: 0 to 100% moisture content. Right: 0 to 5% moisture content.
We also computed the corresponding value of the subsurface backscattered power σ0SS2qp for
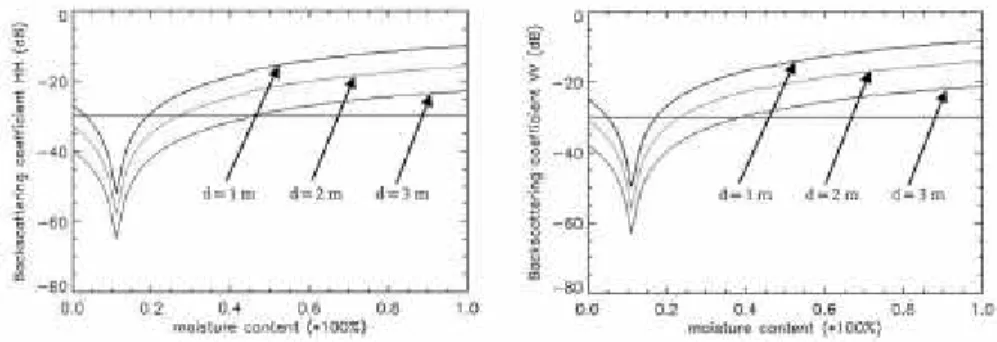
both HH and VV polarizations, in order to check that the backscattered radar signal is higher than the typical instrument detection limit, fixed to -30 dB. Figure 9 shows the HH and VV subsurface backscattered pow er, at 40o incidence angle, as a function of the subsurface water content for three different thicknesses of the superficial dust layer: we can see that the radar can probe down to 1 meter deep in the 0 – 8% moisture range and detect deeper moisture down to 3 meters from 25% water content for the VV polarization.
Figure 9: Computed value for σ0
SS2qp for the “favorable” case as a function of the moisture content of the
subsurface layer at a 40o
incidence angle, for three upper layer thicknesses: d = 1 m, d = 2 m and d = 3 m. Left: HH polarization. Right: VV polarization. The horizontal line corresponds to the -30 dB detection limit.
The unfavorable case was simulated with a rougher heterogeneous surface dust layer of parameters ε1 = 5.87-0.14j, σ1 = 3.5 cm, L1 = 10 cm, fD = 0.08 and D = 10 cm. Again, the
subsurface layer was characterized by ε2 ranging from 4.19-0.178j (dry basalt) to 86.75-3.77j (pure
liquid water), σ2 = 3.5 cm and L2 = 10 cm. As previously, results presented in Figure 10 show a
phase increase with the value of the incidence angle. For an incidence angle of 40o, the phase difference is however lower than for the favorable case: it reaches 20o when the subsurface water
contribute to the co-polar phase difference and in fact screens the phase signal of the subsurface layer. However, Figure 10 (right) shows that the co-polar phase still presents strong changes (up to 17o) when the subsurface moisture content changes from zero to only a few percents. A small seasonal change in water content in the Martian subsurface should then be also detectable even in the unfavorable case.
Figure 10: Simulated co-polar phase ΦHH-VV for the “unfavorable” case as a function of the moisture
content of the subsurface layer for three incidence angles: 20o
, 30o
and 40o
. Left: 0 to 100% moisture content. Right: 0 to 5% moisture content.
We again computed the corresponding value of the subsurface backscattered power σ0SS2qp for
both HH and VV polarizations in order to check the radar backscattered level. Figure 11 shows the HH and VV subsurface backscattered power, at 40o incidence angle, as a function of the subsurface water content for three different thicknesses of the superficial dust layer: the radar can see down to 1 meter deep in the 0 – 6% moisture range and detects deeper moisture down to 3 meters from 40% water content for the VV polarization. Penetration performances are lower than previously, again because of the screening effect of the scattering in the superficial layer. In both favorable and unfavorable cases, our simulation results show that a P -band polarimetric SAR should be able to monitor moisture changes down to 2 m.
Figure 11: Computed value for σ0
SS2qp for the “unfavorable” case as a function of the moisture content of
the subsurface layer at a 40o
m. Left: HH polarization. Right: VV polarization. The horizontal line corresponds to the -30 dB detection limit.
6. Conclusion
Using a two-layer geo-electrical model of the first meters of the Martian subsurface, we could evaluate the potential performances of a P -band SAR for both subsurface geology mapping and moisture detection. The geo-electrical model was built using laboratory characterization of analog samples representing our actual knowledge of the mineralogy and petrography of the Martian surface. We combined these laboratory measurements to results of the latest Mars exploration missions to help defining the parameters of our model. We considered the Integral Equation Model, with both single and multiple scattering terms, to compute surface, subsurface and volume contributions to the backscattered radar wave. Our results, for both a “favorable” (homogeneous superficial dust layer) and “unfavorable” (clastic dust layer producing volume scattering) case, indicate that a P-band SAR should be able to image subsurface geology down to 4 meters. Using a polarimetric phase signature which allows to detect subsurface moisture, as it was shown from airborne L-band data on the Pyla dune in France, we could simulate a detection limit of 2 meters for a water content change of a few percent in the Martian subsurface. A polarimetric P-band SAR could then be able to monitor small changes in the subsurface moisture on Mars. Such simulations should of course be refined using more complete and realistic models of the Martian subsurface (magnetic properties, multi-layering, better constrained surface roughness parameters, various size distribution of scatterers, effect of salt water), but they already illustrate the potential scientific returns we could expect from a SAR mission to Mars.
Acknowledgments
The authors would like to thank Ch. Elachi, S. Hensley and an anonymous reviewer for their valuable remarks.
Abdelsalam M. G. and R. J. Stern, “Mapping precambrian structures in the Sahara Desert with SIR-C/X-SAR radar: The neoproterozoic Keraf suture, NE Sudan,” J. Geophys. Res., vol. 101, no. E10, pp. 23063-23076, 1996.
Aharonson O., N. Schorghofer, M. F. Gerstell, “Slope streak formation and dust deposition rates on Mars,” ,”
J. Geophys. Res., vol. 108, no. E12, 5138, 2003.
Baron J. E., R. A. Simpson, G. L. Tyler, “Estim ation of Mars radar backscatter from measured surface rock populations,” J. Geophys. Res., vol. 103, no. E10, pp. 22695-22712, 1998.
Bibring J.-P. et al., “Mars surface diversity as revealed by the OMEGA/Mars Express observations,”
Science, vol. 307, pp. 1576-1581, 2005.
Campbell B. A., R. E. Arvidson, M. K. Sheppard, “Radar polarization properties of volcanic and playa surfaces: Applications to terrestrial remote sensing and Venus data interpretation,” J. Geophys. Res., vol. 98, no. E9, pp. 17099-17113, 1993.
Campbell B. A., “Radar backscatter from Mars: Properties of rocks-strewn surfaces,” Icarus, vol. 150, pp. 38-47, 2001.
Campbell B. A., A. Freeman, L. Veilleux, B. Huneycutt, M. Jones, R. Shotwell, “A P-band radar mission to Mars,” IEEE Aerospace Conf., IEEE Big Sky, USA, 2004a.
Campbell B. A., T. A. Maxwell, A. Freeman, “Mars orbital synthetic aperture radar: Obtaining geologic information from radar polarimetry,” J. Geophys. Res., vol. 109, no. E07008, 2004b.
Carr M. H., Water on Mars, Oxford University Press, New York, 1996.
Christensen P. R., “Regional dust deposits on Mars: Physical properties, age and history,” J. Geophys. Res., vol. 91 , no. B3, pp. 3533-3545, 1986.
Christensen P. R., “The spatial distribution of rocks on Mars,” Icarus, vol. 68, pp. 217-238, 1986.
Christensen P. R., J. L. Banfield, R. N. Clark, K. S. Edgett, V. E. Hamilton, “Detection of crystalline hematite mineralization on Mars by the Thermal Emission Spectrometer,” J. Geophys. Res., vol. 105 , no. E4, pp. 9623-9642, 2000.
Christensen P. R., “Formation of recent Martian gullies through melting of extensive water-rich snow deposits,” Nature, vol. 422, pp. 45-48, 2003.
Christensen P. R. et al., “Initial results from the Mini-TES experiment in Gusev crater from the Spirit Rover,” Science, vol. 305, pp. 837-842, 2004.
Clifford S. M., “A model for the hydrologic and climatic behavior of water on Mars,” J. Geophys. Res., vol. 98 , no. E6, pp. 10973-11016, 1993.
Costard F., F. Forget, N. Mangold, J. P. Peulvast, “Formation of recent Martian debris flows by melting of near-surface ground ice at high obliquity,” Science, vol. 295, pp. 110-113, 2002.
Davies K., Ionospheric Radio, IEE/Peter Peregrinnus Ltd., London, U.K., 1990.
Dierking W., “Quantitative roughness characterisation of geological surfaces and implications for radar signature analysis,” IEEE Trans. Geosci. Remote Sensing, vol. 37, no. 5, pp. 2397-2412, 1999.
Dubois P., J. van Zyl, T. Engman, “Measuring soil moisture with imaging radar,” IEEE Trans. Geosci.
Remote Sensing, vol. 33, no. 4, pp. 915-926, 1995.
Elachi C., L. E. Roth, and G. G. Schaber, “Spaceborne radar subsurface imaging in hyperarid regions,” IEEE
Trans. Geosci. Remote Sensing, vol. GE-22, pp. 383-388, 1984.
Elachi C., Spaceborne Radar Remote Sensing: Applications and Techniques, IEEE Press, 1988.
Farr T. G., C. Elachi, P. Hartl, K. Chowdhury, “Microwave penetration and attenuation in desert soil: A field experiment with the Shuttle Imaging Radar,” IEEE Trans. Geosci. Remote Sensing, vol. GE-24, no. 4, pp. 590-594, 1986.
Farr T., “Imaging radar in the Mojave desert – Death Valley region,” Workshop on the Martian highlands
and Mojave desert analogs, Las Vegas, USA, 2001.
Feldman W. C., T. H. Prettyman, S. Maurice, J. J. Plaut, D. L. Bish, “Global distribution of near surface hydrogen on Mars,” J. Geophys. Res., vol. 109, no. E09006, 2004.
Fung A. K., Z. Li, K. S. Chen, “Backscattering from a randomly rough dielectric surface,” IEEE Trans.
Geosci. Remote Sensing, vol. 30, no. 2, pp. 356-369, 1992.
Fung A. K., Microwave Scattering and Emission Models and their Applications, Norwood MA, Artech House, 1994.
Gendrin A. et al., “Sulfates in Martian layered terrains: The Omega / Mars Express view,” Science, vol. 307, pp. 1587-1591, 2005.
Golombek M. P., Rapp D., “Size-frequency distributions of rocks on Mars Pathfinder landing site,” J.
Geophys. Res. , vol. 102, no. E2, pp. 3967-3988, 1997.
Golombek M. P. et al., “Rock size-frequency distributions of rocks and implications for Mars Exploration Rover landing safety and operations,” J. Geophys. Res., vol. 108, no. E12, pp. 1-23, 2003.
Grandjean G., Ph. Paillou, P. Dubois, T. August-Bernex, N. Baghdadi, and J. Achache, “Subsurface structures detection by combining L-band polarimetric SAR and GPR data: Example of the Pyla Dune (France),” IEEE Trans. Geosci. Remote Sensing, vol. 39, no. 6, pp. 1245-1258, 2001.
Haberle R. M., C. P. McKay, J. Schaeffer, N. A. Cabrol, E. A. Grin, A. P. Zent, R. Quinn, “On the possibility of liquid water on present-day Mars,” J. Geophys. Res., vol. 106, no. E10, pp. 23317-23326, 2001.
Hagfors T., D. B. Campbell, “Radar backscattering from Venus at a wavelength of 70 cm,” Astron. J. , vol. 79, pp. 493-501, 1974.
Harmon J. K., R. .E. Arvidson, E. A. Guinness, B. A. Campbell, M. A. Slade, “Mars mapping with delay-Doppler radar,” J. Geophys. Res., vol. 104, no. E6, pp. 14065-14089, 1999.
Hecht M. H., “Metastability of liquid water on Mars,” Icarus, vol. 156, pp. 373-386, 2002.
Heggy E., Ph. Paillou, G. Ruffié, J.-M. Malézieux, F. Costard, and G. Grandjean, “On water detection in the Martian subsurface using sounding radar,” Icarus, vol. 154, no. 2, pp. 244-257, 2001.
Heggy E., Ph. Paillou, F. Costard, N. Mangold, G. Ruffié, F. Demantoux, G. Grandjean, J.-M. Malézieux, “Local geo-electrical models of the Martian subs urface for shallow ground water detection using sounding radar,” J. Geophys. Res., vol. 108, no. E4, 2003.
Johnson J. R., W. M. Grundy, M. T. Lemmon, “Dust deposition at the Mars Pathfinder landing site: Observations and modeling of visible / near -infrared spectra,” Icarus, vol. 163, pp. 330-346, 2003.
Klingelhöfer G. et al., “Jarosite and hematite at Meridiani Planum from Opportunity’s Mössbauer spectrometer,” Science, vol. 306, pp. 1740-1745, 2004.
Krymskii A.M., N.F. Ness, D.H. Crider, T.K. Breuss, M.H. Acuna, D.P. Hinson, “Solar wind interaction with the ionosphere/atmosphere and crustal magnetic fields at Mars: Mars Global Surveyor Magnetometer/Electron Reflectometer, radio science, and accelerometer data,” J. Geophys. Res., vol. 109, issue A11, 2004.
Lasne Y., Ph. Paillou, Th. August-Bernex, G. Ruffié, G. Grandjean, “A phase signature for detecting subsurface wet structures using polarimetric L-band SAR data,” IEEE Trans. Geosci. Remote Sensing, vol. 42, no. 8, pp. 1683-1694, 2004.
Lasne Y., Ph. Paillou, G. Ruffié, M. Crapeau, “Effect of multiple scattering on the phase signature of wet subsurface structures: Applications to polarimatric L and C-band SAR,” IEEE Trans. Geosci. Remote
Sensing, 2005, vol. 43, no. 8, 2005.
Lichtenecker K, K. Rother, “Die Herleitung des Logarithmischen Mischungsgesetzes aus allgemeinen Prinzipien der Stationären Strömung,” Phys. Zeitschr. , vol. 32, pp. 255-260, 1931.
Malin M. C., K. S. Edgett, “Evidence for recent ground water seepage and surface runoff on Mars,” Science, vol. 288, pp. 2330-2335, 2000.
Mangold N., C. Quantin, V. Ansan, Ch. Delacourt, P. Allemand, “Evidence for Precipitation on Mars from Dendritic Valleys in the Valles Marineris Area,” Science, vol. 305, pp. 78-81, 2004.
Mätzler C., “Microwave permittivity of dry sand,” IEEE Trans. Geosci. Remote Sensing, vol. 36, no. 1, pp. 317-319, 1998.
McCauley J. F., G. G. Schaber, C. S. Breed, M. J. Grolier, C. V. Haynes, B. Issawi, C. Elachi, R. Blom., “Subsurface valleys and geoarchaeology of the eastern Sahara revealed by Shuttle Radar,” Science, vol. 218, pp. 1004-1020, 1982.
Mellon M. T., R. J. Phillips, “Recent gullies on Mars and the source of liquid water,” J. Geophys. Res., vol. 106, no. E6, pp. 23165-23180, 2001.
Mellon M. T., W. C. Feldman, T. H. Prettyman, “The presence and stability of ground ice in the southern hemisphere of Mars,” Icarus, no. 169, pp. 324-340, 2004.
Mitrofanov I., D. Anfimov, A. Kozyrev, M. Litvak, A. Sanin, “Maps of subsurface Hydrogen from the High Energy Neutron Detector, Mars Odyssey,” Science, vol. 297, pp. 78-81, 2002.
Moore J. H., B. M. Jakosky, “Viking landing sites: Remote sensing observations and physical properties of Martian surface materials,” Icarus, vol. 81, pp. 164-184, 1989.
Morris R. V., et al., “Mineralogy, composition, and alteration of Mars Pathfinder rocks and soils: Evidence from multispectral, elemental, and magnetic data on terrestrial analogue, SNC meteorite, and Pathfinder samples,” J. Geophys. Res., vol. 105, no. E1, pp. 1757-1818, 2000.
Newsom H. E., “Hydrothermal alteration of impact melt sheets with implications for Mars,” Icarus, vol. 44, pp. 207-216, 1980.
Oh Y., K. Sarabandi, “An empirical model and an inversion technique for radar scattering from bare soil surfaces,” IEEE Trans. Geosci. Remote Sensing, vol. 30, no. 5, pp. 370-381, 1992.
Okamura S., Y. Zhang, “New method for moisture content measurement using phase shifts at two frequencies,” J. Microwave Power Electromagn., vol. 35, no. 3, pp. 175-178, 2000.
Paillou Ph., P.A. Rosen, S. Hensley, T.W. Thompson, J.J. Plaut, Ch. Elachi, D. Massonnet, J. Achache, “MEEM: An orbital Synthetic Aperture Radar for Mars exploration,” Conf. on the Geophysical
Detection of Subsurface Water on Mars, Houston, USA, 2001a.
Paillou Ph., G. Grandjean, J.-M. Malézieux, G. Ruffié, E. Heggy, D. Piponnier, P. Dubois, and J. Achache, “Performances of Ground Penetrating Radars in arid volcanic regions: Consequences for Mars subsurface exploration,” Geophys. Res. Letters, vol. 28, no. 5, pp. 911-914, 2001b.
Paillou Ph., Ph. Dreuillet, “The PYLA’01 experiment: FFFlying the new RAMSES P-band facility,” AIRSAR
Earth Science and Application Workshop, Pasadena, USA, 2002.
Paillou Ph., G. Grandjean, N. Baghdadi, E. Heggy, Th. August-Bernex, J. Achache, “Sub-surface imaging in central-southern Egypt using low frequency radar: Bir Safsaf revisited,” IEEE Trans. Geosci. Remote
Sensing, vol. 41, no. 7, pp. 1672-1684, 2003a.
Paillou Ph., A. Rosenqvist, T. Farr, “A JERS -1 radar mosaic for subsurface geology mapping in East Sahara,” Proc. IGARSS’03, Toulouse, France, July 2003b.
Paillou Ph., A. Rosenqvist, J.-M. Malézieux, B. Reynard, T. Farr, E. Heggy, “Discovery of a double impact crater in Libya: The astrobleme of Arkenu,” C.R. Acad. Sci. Paris, Geoscience, vol. 335, pp. 1059-1069, 2003c.
Paillou Ph., A. El Barkooky, A. Barakat, J.-M. Malézieux, B. Reynard, J. Dejax, E. Heggy, “Discovery of the largest crater field on Earth in the Gilf Kebir region, Egypt,” C.R. Acad. Sci. Paris, Geoscience, vol. 336, pp. 1491-1500, 2004.
Rieder R. et al., “The chemical composition of Martian soil and rocks returned by the mobile Alpha Proton X-ray spectrometer: Preliminary results from the X-ray mode,” Science, vol. 278, pp. 1771-1774, 1997. Rieder R., G. Gellert, R. C. Anderson, J. Brückner, B. C. Clark, “Chemistry of rocks and soils at Meridiani
Planum from the Alpha Particule X-ray Spectrometer,” Science, vol. 306, pp. 1746-1749, 2004.
Saunders R. S. et al., “Magellan mission summary,” J. Geophys. Res., vol. 97, no. E8, pp. 13067-13090, 1992.
Schaber G. G., J. F. McCauley, C. S. Breed, and G. R. Olhoeft, “Shuttle Imaging Radar: Physical controls on signal penetration and subsurface scattering in the Eastern Sahara,” IEEE Trans. Geosci. Remote
Schaber G. G., J. F. McCauley, and C. S. Breed, “The use of multifrequency and polarimetric SIR-C/X -SAR data in geologic studies of Bir Safsaf, Egypt,” Remote Sens. Environ., vol. 59, pp. 337-363, 1997.
Tanaka K. L., “Dust and ice deposition in the Martian geological record,” Icarus, vol. 144, pp. 254-266, 2000.
Oberto B., “Team-X Mars SAR,” JPL Internal Report, 2000.
Ulaby F. T., R. K. Moore, A. K. Fung, Microwave Remote Sensing: Active and Passive, vol. 2, Norwood MA, Artech House, 1982.
Ulaby F. T., R. K. Moore, A. K. Fung, Microwave Remote Sensing: Active and Passive, vol. 3, Norwood MA, Artech House, 1986.
Vincendon C., N. Mangold, Ph. Masson, V. Ansan, “Estimation of dust thickness in Arabia Terra region on Mars,” EGS - AGU - EUG Joint Assembly, Nice, France, 2003.
Williams K. K., R. Greeley, “Radar attenuation by sand: Laboratory measurements of radar transmission,”
IEEE Trans. Geosci. Remote Sensing, vol. 39, no. 11, pp. 2521-2526, 2001.
Williams K. K., R. Greeley, “Measurements of dielectric loss factors due to a Martian dust analog,” J.
Geophys. Res., vol. 109, no. E10006, 2004.
Wu T. D., K. S. Chen, “A transition model for the reflection coefficient in surface scattering,” IEEE Trans.
![Figure 1). The production and scientific analysis of a geocoded mosaic generated from more than 1600 radar scenes will reveal the near-surface geology hidden by the superficial sand layer [Paillou et al, 2003b]](https://thumb-eu.123doks.com/thumbv2/123doknet/14800441.605947/6.918.165.755.682.959/figure-production-scientific-analysis-geocoded-generated-superficial-paillou.webp)
![Table 1) and the dielectric constant of pure water for the P-band ( ε w = 86.75-3.77j) [Ulaby et al., 1986]](https://thumb-eu.123doks.com/thumbv2/123doknet/14800441.605947/11.918.112.800.515.634/table-dielectric-constant-pure-water-p-band-ulaby.webp)