HAL Id: hal-01882208
https://hal.archives-ouvertes.fr/hal-01882208
Submitted on 20 Oct 2020
HAL is a multi-disciplinary open access archive for the deposit and dissemination of sci-entific research documents, whether they are pub-lished or not. The documents may come from teaching and research institutions in France or abroad, or from public or private research centers.
L’archive ouverte pluridisciplinaire HAL, est destinée au dépôt et à la diffusion de documents scientifiques de niveau recherche, publiés ou non, émanant des établissements d’enseignement et de recherche français ou étrangers, des laboratoires publics ou privés.
Distributed under a Creative Commons Attribution - NonCommercial| 4.0 International License
CYTOKINE RESPONSE ASSOCIATED WITH
HEPATITIS C VIRUS CLEARANCE IN HIV
COINFECTED PATIENTS INITIATING PEG
INTERFERON-a BASED THERAPY.
Truong Tam Nguyen, Reihani Niloofar, Pierre-Alain Rubbo, Nils Kuster,
Karine Bolloré, Jacques Ducos, Georges-Philippe Pageaux, Jacques Reynes,
Philippe van de Perre, Edouard Tuaillon
To cite this version:
Truong Tam Nguyen, Reihani Niloofar, Pierre-Alain Rubbo, Nils Kuster, Karine Bolloré, et al.. CY-TOKINE RESPONSE ASSOCIATED WITH HEPATITIS C VIRUS CLEARANCE IN HIV COIN-FECTED PATIENTS INITIATING PEG INTERFERON-a BASED THERAPY.. Mediterranean Journal of Hematology and Infectious Diseases, Università Cattolica del Sacro Cuore, 2016, 8 (1), pp.e2016003. �10.4084/MJHID.2016.003�. �hal-01882208�
Mediterranean Journal of Hematology and Infectious Diseases
Original Article
Cytokine Response Associated with Hepatitis C Virus Clearance in HIV Coinfected
Patients Initiating Peg Interferon-
Based Therapy
Truong Tam Nguyen1,2, Reihani Niloofar 1, Pierre-Alain Rubbo1, Kuster Nils1, Karine Bollore1, Jacques Ducos5, Georges-Philippe Pageaux1,3, Jacques Reynes1,4, Philippe Van de Perre1,5 and Edouard Tuaillon1,5
1 Université Montpellier 1, INSERM U 1058, , 34394 Montpellier, France. 2
Pham Ngoc Thach University of Medicine, Thanh Thai, Ho Chi Minh City, Vietnam. 3 CHU Montpellier, Département d'Hépato-Gastro-Entérologie, 34295 Montpellier, France. 4 CHU Montpellier, Département des Maladies Infectieuses et Tropicales, 34295, France. 6 CHU Montpellier, Département de Bactériologie - Virologie, 34295 Montpellier, France.
Abstract. Background: Treatment of hepatitis C virus (HCV) infection based on peginterferon-
(pegIFN
) and ribavirin induces important changes in cytokine release and T cell activation.
Objective: Immune response to pegIFN
-ribavirin therapy was explored in patients coinfected
by HCV and HIV.
Methods: Concentrations of 25 cytokines and CD8
+T cell activation were monitored in
HCV/HIV coinfected patients classified as sustained virological responders (SVR, n=19) and
non-responders (NR, n=11).
Results: High pretreatment concentrations of IP-10 (CXCL-10) and MCP-1 (CCL-2) were
associated with a poor anti-HCV response. PegIFN
-ribavirin therapy increased CD8
+T cell
activation and induced significant changes in levels of eleven cytokines related to both Th1 and
Th2 responses in SVR (IL-1
, IL-1RA, IL-4, IL-5, IL-6, IL-7, IL-12p40/70, IL-13, IP-10, eotaxin,
MCP-1) but of only six cytokines in NR (IL-1
, IL-2, IL-5, IL-12p40/70, IL-13, eotaxin). The
highest rise in MIP-1
and MCP-1 levels was observed four weeks after anti-HCV treatment
initiation in SVR compared to NR (p=0.002 and p=0.03, respectively), whereas a decrease in IL-8
concentration was associated with treatment failure (p= 0.052).
Conclusions: Higher and broader cytokine responses to pegIFN
-ribavirin therapy were
observed in SVR patients compared to NR. Changes in IL-8, MIP-1
and MCP-1 serum
concentrations may be associated with efficacy of pegIFN
- and ribavirin-based therapies in
patients coinfected by HCV and HIV.
Citation: Tam Nguyen T., Niloofar R., Rubbo P.A., Nils K., Bollore K., Ducos J., Pageaux G.P., Reynes J., Van de Perre P., Tuaillon E.
Cytokine response associated with Hepatitis C virus clearance in HIV coinfected patients initiating peg interferon- based therapy. Mediterr J Hematol Infect Dis 2016, 8(1): e2016003, DOI: http://dx.doi.org/10.4084/MJHID.2016.003
Published: January 1, 2016 Received: May 19, 2015 Accepted: November 9, 2015 This is an Open Access article distributed under the terms of the Creative Commons Attribution License (http://creativecommons.org/licenses/by/2.0), which permits unrestricted use, distribution, and reproduction in any medium, provided the original work is properly cited.
Correspondence to: Edouard Tuaillon, MD, PhD. Département de Bactériologie - Virologie/INSERM U1058, CHRU de Montpellier, France. Tel: +33 (0) 467 338 469 (340), Fax: +33 (0) 467 338 334. E-mail: e-tuaillon@chu-montpellier.fr
Introduction. Infection by hepatitis C virus (HCV) and HIV shared common routes of transmission and thus confections with the two viruses are frequent. HCV infection is seen in 15–30% of HIV-infected patients in Western Europe, with almost 20 000 HIV-infected individuals chronically HIV-infected with HCV in France.1,2 Since the introduction of antiretroviral
therapy (ART), HCV-related liver diseases have become leading causes of morbidity and mortality in HIV-infected individuals.3,4
Faster progression to cirrhosis has been observed in patients coinfected with HCV and HIV by comparison with subjects infected with HCV alone.5 HIV/HCV coinfection is also associated with higher HCV viral
Mediterr J Hematol Infect Dis www.mjhid.org 2016; 8: Open Journal System Pag. 2 / 8 levels in serum.6 Finally, ART-related adverse events
are more frequent in HCV/HIV coinfected individuals, with increased difficulties in optimally treating HIV infection.7,8
Until recently, a combination of pegIFN and ribavirin has been the standard-of-care for treatment of chronic HCV patients. In coinfected individuals -ribavirin therapy is less efficacious than in single HCV infection.9,10 Approximately 30% of patients receiving a combination of ribavirin with pegIFN have a sustained virological response when infected with HCV genotype 1 and 4.9 This rate increases to 60% when genotype 2 and 3 are involved.10 Most of the current anti-HCV therapeutic options remained based on pegIFN and/or ribavirin in addition to protease inhibitors or NS5A or NS5B inhibitors.11
PegIFN constitutes an active immunotherapy triggering innate immune response and T cell activation. The cytokine response to pegIFN-based regimens plays probably an important role in treatment outcome. IFN stimulates Th1 cells and limits secretion of Th2 related cytokines such as 4 or IL-10.12 IFN signals through Janus kinase signal transducer, an activator of transcription pathway, and induction of IFN-stimulated genes.13 Ribavirin synergies this effect by reducing IL-10 production, enhancing autocrine IFN- and IL-8 secretion.14-16 Several immune factors are predictive of virological
response on pegIFN-ribavirin-based therapy:
pretreatment concentration of IFN-inducible protein 10 (IP-10, also called CXCL-10), polymorphisms near the interleukin-28B gene coding for the IFN-3, and
CD4+ T cell count in HIV/HCV coinfected
individuals.18,19 Progressive impairment of immune functions and T cell exhaustion induced by prolonged exposure to virus antigens are fundamental features of HIV infection. Inhibitory networks, such as the programmed cell death protein-1 (PD-1) and IL-10 play a key role in this process.20,21 PD-1 is upregulated on CD8+ and CD4+ T cells and mediates a dysfunction partially reversible on ART.22-24 PD-1 signalling impacts the expression of both Th1 and Th2 cytokines but limits particularly the capacity of Th1 and IFN secretion by CD4+ and CD8+ T cells.21
Although HCV clearance depends on immune response induced by pegIFN-ribavirin therapy, the dynamics of cytokine response and T cell activation in individuals coinfected with HIV and HCV remain poorly characterized.25 In this study, we monitor serum concentration of 25 cytokines alongside with the level of CD8+ T cell activation in HIV/HCV coinfected patients initiating anti-HCV therapy.
Methods.
Patient samples: Patients coinfected by HIV/HCV
followed at Montpellier University Hospital and
initiating anti-HCV therapy were included
consecutively between January 2007 and January 2010 after providing written informed consent. The study was approved by the local institution ethical committee (DC-2011-1405). Chronic hepatitis was proved by the presence of serum HCV antibodies and detectable viral RNA. HCV genotype, HCV and HIV-1 viral loads, CD4+ T cell count, and liver enzyme levels were all determined using standard procedures. All patients received pegIFN2a 180 microg/week plus ribavirin 800 to 1,200 mg daily; patients infected with HCV genotype 2 and 3 received 800 mg daily and genotype 1 and 4 received a weight based dose: 1,000 mg/day for persons less than 75 kg and 1200 mg/day over 75 kg.
Subjects were ranged into two distinct groups based on HCV response to therapy:
i) Sustained virological responders (SVR) when serum HCV RNA was undetectable 24 weeks after completing therapy, and
ii) non responders (NR) when HCV RNA decrease was < 2 log copies/mL at week 12 or when HCV RNA was detectable at the end of treatment.
iii) Patient relapsing in the 24 weeks period after therapeutic cessation were excluded from the study.
Routine laboratory testing: Serum HCV RNA was
quantified using COBAS AmpliPrep/COBAS TaqMan HCV assay (Roche Diagnostic Systems). HCV genotypes were determined using INNO-LiPA HCV II test (Innogenetics). Alanine aminotransferase (ALT) dosages were executed using standard methods.
Quantitation of serum cytokine concentrations:
Cytokines were quantified in serum samples obtained before initiation of treatment, and four weeks after the start of PegIFN-based therapy. A multiplexed microbead assay was used according to manufacturer's instructions (cytokine twenty-five-plex kit, Life Technologies Ltd, Paisley, UK) and an FIDIS™ apparatus (BMD). Twenty five cytokines were quantified in duplicate: IL-1β, IL-1RA, IL-2, IL-2R, IL-4, IL-5, IL-6, IL-7, IL-8, IL-10, IL-12p40/70, IL-13, IL-15, IL-17, eotaxin, GM-CSF, IFN-α, IFN-γ, IP-10, MCP-1, MIG, MIP-1α, MIP-1β, RANTES, and TNF-α. Data were analyzed using the MLX-Booster program (BMD). Mean concentrations (pg/ml) of cytokines were all superior to the detection limits, defined as the mean background value plus 2 SD.
Analysis of CD8+/CD38bright T cells: Activation of
CD8+ T cells was assessed by flow cytometry analysis on EDTA-treated fresh whole blood using FC 500 apparatus (Beckman Coulter, Miami, Florida). T cell activation was explored at day 0, week 4 and week 12 after initiation of pegIFN-ribavirin therapy. The
expression of CD38bright on CD8+ T cells was analyzed as previously described using a two-colour staining with anti-CD8 and anti-CD38 conjugated to fluorescein isothiocyanate (FITC) and phycoerythrin (PE), respectively (Beckman Coulter).26 The positive threshold for CD38bright analysis was established using the CellQuant CD38/CD8 kit for quantitation of CD38 cell surface expression (BioCytex, Marseille, France) and was defined as 8,500 CD38 binding sites/cells. The CD8+/CD38bright values were expressed as the percentage of CD38bright cells from the CD8+ T cell populations.
Statistical Analysis: The Mann–Whitney U test and
Kruskal–Wallis test were used to analyze continuous variables where appropriate. The Friedman test was used to evaluate changes in serum cytokine levels over time. A mixed model was used to analyze the association between T cell activation during anti-HCV therapy and therapeutic response. Statistical analyses were done using SPSS software version 18.0J.
Results.
Clinical characteristics at baseline: Thirty HCV/HIV
coinfected patients receiving pegIFN-ribavirin therapy were included in the study. Nineteen (63%) were classified as SVR and eleven (37%) as NR. Patient characteristics are shown in Table 1.
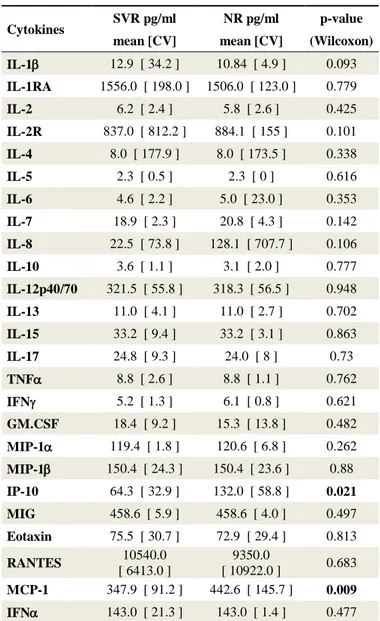
Pretreatment levels of soluble and cellular inflammatory markers: IP-10 levels were higher in the
NR group than in the SVR group, P = 0.021 (Table 2). Individuals from the NR group also had higher pretreatment concentrations of MCP-1, P = 0.0009. A trend for a higher serum concentration of IL-8 was also observed in patients of the NR group compared to the SVR group, P = 0.106.
Cytokines change after therapeutic initiation of HCV treatment: Initiation of anti-HCV treatment elicited
IFN rise in both SVR and NR patients (Figure 1 and Supplemental Table 1). This enhancement of IFN in
serum was similar in the two groups. Besides IFN, the anti-HCV therapy induced a significant increase in the serum levels of eleven cytokines in SVR patients, including cytokines related to Th1-dominant immune responses (IL-12p40/70, IP-10), Th2-type cytokines (IL-4, IL-5, and IL-13), and pro-inflammatory Table 2. Pre-treatment Cytokine concentrations in serum from SVR
and NR patients
Cytokines SVR pg/ml NR pg/ml p-value mean [CV] mean [CV] (Wilcoxon)
IL-1 12.9 [ 34.2 ] 10.84 [ 4.9 ] 0.093 IL-1RA 1556.0 [ 198.0 ] 1506.0 [ 123.0 ] 0.779 IL-2 6.2 [ 2.4 ] 5.8 [ 2.6 ] 0.425 IL-2R 837.0 [ 812.2 ] 884.1 [ 155 ] 0.101 IL-4 8.0 [ 177.9 ] 8.0 [ 173.5 ] 0.338 IL-5 2.3 [ 0.5 ] 2.3 [ 0 ] 0.616 IL-6 4.6 [ 2.2 ] 5.0 [ 23.0 ] 0.353 IL-7 18.9 [ 2.3 ] 20.8 [ 4.3 ] 0.142 IL-8 22.5 [ 73.8 ] 128.1 [ 707.7 ] 0.106 IL-10 3.6 [ 1.1 ] 3.1 [ 2.0 ] 0.777 IL-12p40/70 321.5 [ 55.8 ] 318.3 [ 56.5 ] 0.948 IL-13 11.0 [ 4.1 ] 11.0 [ 2.7 ] 0.702 IL-15 33.2 [ 9.4 ] 33.2 [ 3.1 ] 0.863 IL-17 24.8 [ 9.3 ] 24.0 [ 8 ] 0.73 TNF 8.8 [ 2.6 ] 8.8 [ 1.1 ] 0.762 IFN 5.2 [ 1.3 ] 6.1 [ 0.8 ] 0.621 GM.CSF 18.4 [ 9.2 ] 15.3 [ 13.8 ] 0.482 MIP-1 119.4 [ 1.8 ] 120.6 [ 6.8 ] 0.262 MIP-1 150.4 [ 24.3 ] 150.4 [ 23.6 ] 0.88 IP-10 64.3 [ 32.9 ] 132.0 [ 58.8 ] 0.021 MIG 458.6 [ 5.9 ] 458.6 [ 4.0 ] 0.497 Eotaxin 75.5 [ 30.7 ] 72.9 [ 29.4 ] 0.813 RANTES 10540.0 [ 6413.0 ] 9350.0 [ 10922.0 ] 0.683 MCP-1 347.9 [ 91.2 ] 442.6 [ 145.7 ] 0.009 IFN 143.0 [ 21.3 ] 143.0 [ 1.4 ] 0.477
Table 1. Patient characteristics
All (n=30) SVR (n=19) NR (n=11)* Age 45 44 47 CD4+ T cells (/µl) 350 (50-1076) 378(128-1076) 328 (50-715) Nadir CD4 T cells (/µl) 122.5 (32-598) 124 (33-598) 119.5 (32-324) ALAT (IU/L) 48.5 (13-172) 40.5 (13-172) 56.5 (24-133) VL HCV S0 (Log10 IU/ml) 5.96 (5.43-6.68) 5.49 (4.12-5.81) 6.68 (5.98-6.84) VL HIV S0 (IU/l) 0 (0-290) 0 (0-290) 0 (0-118) HCV Genotypes 1 / 2 / 3 / 4 21 / 2 / 7 / 1 10 / 1 / 8 / 0 10 / 0 / 0 / 1 Liver fibrosis (F≥2) 22 13 9
*Seven subjects had a reduction of less than 2 log10 in HCV RNA after 12 weeks of therapy (null responders), and four subjects had a
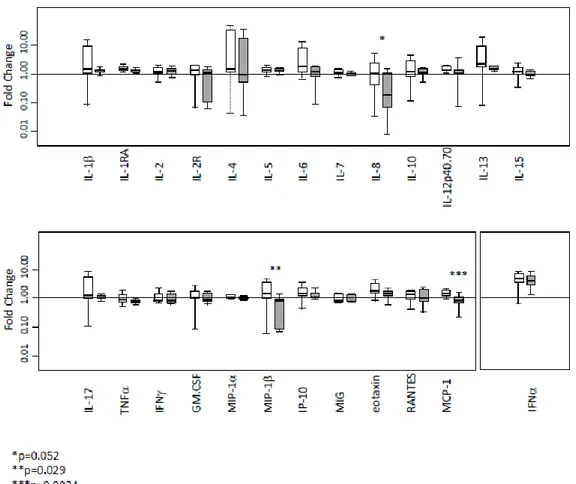
Mediterr J Hematol Infect Dis www.mjhid.org 2016; 8: Open Journal System Pag. 4 / 8 Figure 1. Impact of anti-HCV therapy on cytokine concentrations in serum of NR and SVR. Fold-changes in cytokine levels following
pegIFN-ribavirin therapy initiation in SVR (white bars) and NR (gray bars). Results are expressed as fold changes in cytokine concentrations between week 0 (pretreatment) and week 4 (four weeks of pegIFN-ribavirin therapy). *p=0.052, **p=0.029, ***p=0.0024.
cytokines (IL-1, IL-1RA, IL-6, IL-7). By comparison, levels of only six cytokines rose in the NR group (Supplemental Table 1). Finally, when results were analyzed without consideration of the HCV therapeutic response (combining SVR and NR patients), we also
Figure 2. Changes in T cell activation over a 3-month period of
pegIFN-ribavirin therapy. Fold-changes in CD38bright expression
on CD8 T cells following pegIFN-ribavirin therapy initiation in SVR (white bars) and NR (gray bars). A significant increase of CD38bright expression between two consecutive time periods is indicated: *p<0.001.
observed an increase of IL-2, IL-10, and RANTES concentrations four weeks after initiation of anti-HCV treatment (Additional file 1).
Comparison of the cytokine level changes induced by pegIFN-ribavirin between SVR and NR group:
Changes in cytokines were compared among SVR and NR using the ratio between baseline and four weeks of treatment (Figure 1). A sharp increase of MCP-1 and MIP-1 concentration was observed after initiation of anti-HCV therapy in the SVR group whereas the value decreased or remained stable in the NR group (p=0.0024 and p=0.029, respectively). Furthermore, the IL-8 concentration remains stable after a one-month period of pegIFN-ribavirin therapy in most of the patients responding to anti-HCV treatment, whereas this concentration declined in NR patients (p=0.052).
Changes in T cell activation over the three-months period of therapy initiation: The impact of pegIFN
-ribavirin on T cell activation was explored at day 0, week 4 and week 12 (Figure 2). CD8+ T cell activation before the treatment tends to be higher in NR patients compared to the SVR patients, (p=0.066, Figure 2). Anti-HCV therapy induced a major increase in
CD38bright expression on CD8 T+ cells in the two groups of patients (p<0.001). No significant differences were observed between the two groups in the slope of CD38 cell surface expression of CD8+ T cells suggesting that the over time changes of this activation marker not be associated with a better immune response to therapy.
Discussion. Although the virological response to
pegIFNribavirin-based therapy is intimately
associated with the host immunity, the monitoring of HCV treatment is based on the serum HCV-RNA level decay regardless of the immune response. In this study, CD8+ T cell activation and levels of 25 cytokines were analyzed in HIV/HCV coinfected
patients with favourable versus unfavourable
therapeutic outcome.
PegIFNribavirin administration induced a
dramatic change in serum cytokine concentrations and CD8+ T-cell activation level. We observed that the HCV clearance under pegIFN/ribavirin therapy was associated with broader and higher cytokine responses in SVR than in NR.
Multianalyte assays make possible to analyze a wide an array of cytokines using a small sample volume rapidly. In the present study, the level of 25 cytokines and CD8+ T-cell activation were analyzed at baseline and week four after the initiation of pegIFN/ribavirin therapy. Comparison between different multiplex bead assays has shown variable agreement among kits evidencing that absolute cytokine concentrations differ across commercial assays.27,28 As a consequence, multisite comparisons between cytokine concentrations obtained with different methods are difficult to interpret because of the lack of standardization. However, these methods are useful for longitudinal studies, and a similar rank order of cytokine concentrations between samples is preserved between the different commercial kits. Hence, we considered comparisons based on fold change under pegIFN-ribavirin therapy as a valuable method for identifying a predictor of therapeutic success or failure. Even if interferon-free regimen progressively substitute pegIFN-containing regimen for treatment of hepatitis C it remains of particular importance to describe immune response after initiation of pegIFNIndeed, IFNremains the only drug approved for treatment of chronic hepatitis D and the only treatment used for a limited period for hepatitis B.
Baseline serum concentration of IP-10 and MCP-1 (monocyte chemotactic protein 1) were higher in NR than in SVR. A significant increase was observed after treatment initiation in 15 out of 25 soluble biomarkers tested. The strongest increased was observed for IFN as an expectable consequence of the anti-HCV therapy,
with more than 4-fold rise between week 0 and week 4. Increase in cytokine concentrations after pegIFN-ribavirin administration was observed for pro-inflammatory- and Th1-related cytokines such as IL-12 or IP-10, but also for Th2-related cytokines such as IL-4 or IL-13. Activation of T cells accompanied this phenomenon as shown by the increased cell surface expression of CD38 on CD8+ T cells.
Based on therapeutic outcome distinct cytokine patterns were identified. Differences in cytokine concentrations were observed at baseline and following anti-HCV initiation. In agreement with previous studies in individuals coinfected we observed the pretreatment serum level of IP-10 was higher in the NR group than in the SVR group.19 Circulating IP-10 concentration is well correlated with intrahepatic IP-10 messenger RNA expression during chronic HCV infection.29 The high baseline hepatic IFN-stimulated genes expression is associated with a lower chance to be SVR to IFN-based therapy when HIV-uninfected.30-33 Interestingly, the pre-treatment MCP-1 concentration was also found at a higher concentration in the NR group. This pro-inflammatory chemokine is involved in the migration and infiltration of monocytes and CD4+ memory T lymphocytes. Intra-hepatic and serum MCP-1 levels are associated with liver inflammation and fibrosis during chronic HCV infection.34,35 MCP-1 plays a significant role in the recruitment of monocytes by interacting with their cell-surface adhesion-molecules that are over expressed during chronic HCV infection.36 Association between MCP-1 baseline level, and response to pegIFN-ribavirin therapy has been recently reported in HIV-uninfected patients.37 Both chronic HCV and HIV infections induce expression and release of MCP-1 in humans.38,39 HIV proteins like gp12040 and transactivator protein Tat41,42 have shown strong immunomodulatory capacity through MCP-1 stimulation. MCP-1 has also been shown to promote Th2 responses by polarizing Th0 cells towards a Th2 phenotype43 and is thought to be one of the key factors involved in HIV pathogenesis.44 Hence, MCP-1 pretreatment level may be associated with the promotion of the Th1 dominant response and HCV
clearance under pegIFN-ribavirin therapy in
HIV/HCV coinfected patients.
Cytokine response to pegIFN/ribavirin therapy differed qualitatively between SVR and NR. The cytokine response appeared more restricted in NR than in SVR since only six versus 11 cytokines rise significantly following the commencement of anti-HCV therapy. As a possible consequence of high IP-10 and MCP-1 baseline level, the boost of circulating IP-10 and MCP-1 levels was not observed in the NR after four weeks of pegIFN-ribavirin treatment. Circulating IP-10 is considered as a marker of the pre-therapeutic activation level of IFN-stimulated genes. The defect in IP-10 response observed four weeks after starting
Mediterr J Hematol Infect Dis www.mjhid.org 2016; 8: Open Journal System Pag. 6 / 8 pegIFN-ribavirin treatment can be viewed as a marker
of the overexpression of IFN-stimulated genes leading to a poor capacity response to exogenous IFN injections.
Four weeks after initiation of pegIFN-ribavirin, a higher MIP-1β (macrophage inflammatory protein-1β) and MCP-1 secretions were observed in SVR when compared to NR. Of interest, a trend for a paradoxical decrease of MIP-1β was also observed at the same time in the NR group. The concentration of MIP-1β was halved in the NR group at week four compared to baseline whereas MCP-1β level tends to increase in the SVR group. This observation is consistent with a previous study showing that HCV clearance is more frequent in patients experiencing strong MIP-1 and MIP-1β response to pegIFN-based therapy.45,46
MIP-1β (also named CCL4) is a chemokine linked to the Th1 response. MIP-1β is involved in T cell recruitment mediated by CCR5 and CCR1 in the liver of HCV infected patients.38 The amplitude of MCP-1 variation in response to pegIFN/RBV is probably dependent on baseline MCP-1 level as for IP-10. IL-8 dynamic response to pegIFN-ribavirin therapy also appears different in the two groups. IL-8 serum levels tend to be elevated at baseline in NR and to diminish following
pegIFN-ribavirin initiation. High IL-8 mRNA is involved in liver inflammation47-49 and inhibition of the IFN antiviral response in vitro.50
Pretreatment level of IL-8 has also been found associated with poor virological response to pegIFN-ribavirin therapy.51 Evolution of IL-8 concentration may reflect the combined effect of pegIFN plus ribavirin since ribavirin induces its secretion through the activation of activator protein 1.14
In this study, relapse patients were not included in the group of patients that did not recover from HCV under pegIFN-ribavirin. Subjects who experience relapse had patterns of virological response different from NR with a rapid decline in HCV RNA during the first week of treatment.52,53 Hence, relapse patients should be explored a part from NR and SNR groups.
Our study had limitations related to its retrospective nature and the small number of subjects included. HCV genotypes and fibrosis stage were not taken into account in the analysis and IL-28 polymorphism, which is also known to predict the hepatic responsiveness to IFN-based therapy, was not assessed. The study was not designed to establish clinical performances of immunological markers useful for HCV therapeutic prediction and/or monitoring but showed that different ongoing trends of cytokine
response to pegIFNribavirin can be observed in SVR and NR patients infected with HIV.
Conclusions. HIV/HCV coinfected patients, showing a high IP-10 and MCP-1 baseline level alongside with a reduced capacity to produce or to maintain broader secretion of cytokines, including MIP-1, IL-4, IL-6 or IL-8, may have a poor response to regimens based on Peg-IFN and ribavirin. Anti-HCV treatment based on
drugs having immunomodulating activities may benefits from immunomonitoring using multiplex techniques.
Acknowledgements. This work has been supported by grants from Agence Nationale de Recherche sur le SIDA et les hépatites virales (ANRS), UMR Inserm U1058, and the Ministère Français de la Coopération for Ph.D. grants of Tam Truong Nguyen.
References:
1. Loko MA, Salmon D, Carrieri P, et al. The French national prospective cohort of patients co-infected with HIV and HCV (ANRS CO13 HEPAVIH): early findings, 2006-2010. BMC Infect Dis 2010; 10:303. http://dx.doi.org/10.1186/1471-2334-10-303 PMid:20969743 PMCid:PMC2988047
2. Larsen C, Chaix ML, Le Strat Y, et al. Gaining greater insight into HCV emergence in HIV-infected men who have sex with men: the HEPAIG Study. PLoS One 2011; 6:e29322. Davies A, Singh KP, Shubber Z, et al. Treatment outcomes of treatment-naïve Hepatitis C patients co-infected with HIV: a systematic review and meta-analysis of observational cohorts. PLoS One 2013; 8:e55373. Heim MH. Interferons and hepatitis C virus. Swiss Med Wkly 2012; 142: w13586.
3. Luz PM, Bruyand M, Ribeiro S, et al. AIDS and non-AIDS severe morbidity associated with hospitalizations among HIV-infected patients in two regions with universal access to care and antiretroviral therapy, France and Brazil, 2000-2008: hospital-based cohort studies. BMC Infect Dis 2014; 21:278.
http://dx.doi.org/10.1186/1471-2334-14-278 PMid:24885790 PMCid:PMC4032588
4. Ingle SM, May MT, Gill MJ, et al. Antiretroviral Therapy Cohort Collaboration. Impact of risk factors for specific causes of death in the first and subsequent years of antiretroviral therapy among HIV-infected patients. Clin Infect Dis 2014; 59:287-297.
http://dx.doi.org/10.1093/cid/ciu261 PMid:24771333 PMCid:PMC4073781
5. Thein HH1, Yi Q, Dore GJ, Krahn MD. Natural history of hepatitis C virus infection in HIV-infected individuals and the impact of HIV in the era of highly active antiretroviral therapy: a meta-analysis. AIDS 2008; 22:1979-1991.
http://dx.doi.org/10.1097/QAD.0b013e32830e6d51 PMid:18784461
6. Danta M, Semmo N, Fabris P, et al. Impact of HIV on host-virus interactions during early hepatitis C virus infection. J Infect Dis 2008; 197:1558–1566. http://dx.doi.org/10.1086/587843 PMid:18419344
7. Loko MA, Bani-Sadr F, Winnock M, et al. Impact of HAART exposure and associated lipodystrophy on advanced liver fibrosis in HIV/HCV-coinfected patients. J Viral Hepat 2011; 18:307-314.
http://dx.doi.org/10.1111/j.1365-2893.2010.01417.x PMid:21692942
8. D'Arminio Monforte A, Cozzi-Lepri A, Castagna A, et al. Risk of developing specific AIDS-defining illnesses in patients coinfected with HIV and hepatitis C virus with or without liver cirrhosis. Clin Infect Dis 2009; 49:612-622. http://dx.doi.org/10.1086/603557 PMid:19591597
9. Ford N, Kirby C, Singh K, et al. Chronic hepatitis C treatment outcomes in low- and middle-income countries: a systematic review and meta-analysis. Bulletin of the World Health Organization 2012; 90:540–550.
http://dx.doi.org/10.2471/BLT.11.097147 PMid:22807600 PMCid:PMC3397704
10. European Association for Study of Liver. EASL Clinical Practice Guidelines: management of hepatitis C virus infection. J Hepatol 2014; 60:392-420. http://dx.doi.org/10.1016/j.jhep.2013.11.003 PMid:24331294
11. Cacciarelli TV, Martinez OM, Gish RG, et al. Immunoregulatory cytokines in chronic hepatitis C virus infection: pre- and posttreatment with interferon alfa. Hepatology 1996; 24: 6-9.
http://dx.doi.org/10.1002/hep.510240102 PMid:8707283 12. Tokumoto Y, Hiasa Y, Uesugi K, et al. Ribavirin regulates
hepatitis C virus replication through enhancing
interferon-stimulated genes and interleukin 8. J Infect Dis 2012; 205: 1121-1130. http://dx.doi.org/10.1093/infdis/jis025 PMid:22357660 13. Rigopoulou EI, Abbott WG, Williams R, Naoumov NV. Direct
evidence for immunomodulatory properties of ribavirin on T-cell reactivity to hepatitis C virus. Antiviral Res 2007; 75:36-42.
http://dx.doi.org/10.1016/j.antiviral.2006.11.008 PMid:17210188 14. Brenndörfer ED, Brass A, Karthe J, et al. Cleavage of the T cell
protein tyrosine phosphatase by the hepatitis C virus nonstructural 3/4A protease induces a Th1 to Th2 shift reversible by ribavirin therapy. J Immunol 2014; 192: 1671-1680.
http://dx.doi.org/10.4049/jimmunol.1301077 PMid:24442435 15. Falconer K, Askarieh G, Weis N, et al. IP-10 predicts the first
phase decline of HCV RNA and overall viral response to therapy in patients co-infected with chronic hepatitis C virus infection and HIV. Scand J Infect Dis 2010; 42:896-901.
http://dx.doi.org/10.3109/00365548.2010.498019 PMid:20608766
16. Zeremski M, Markatou M, Brown QB, et al. Interferon gamma-inducible protein 10: a predictive marker of successful treatment response in hepatitis C virus/HIV-coinfected patients. J Acquir Immune Defic Syndr 2007; 45:262-268. PMid:17414926 17. Thomson EC, Fleming VM, Main J, et al. Predicting spontaneous
clearance of acute hepatitis C virus in a large cohort of HIV-1-infected men. Gut 2011; 60: 837-845.
http://dx.doi.org/10.1136/gut.2010.217166 PMid:21139063 PMCid:PMC3095479
18. Brockman MA, Kwon DS, Tighe DP, et al. IL-10 is up-regulated in multiple cell types during viremic HIV infection and reversibly inhibits virus-specific T cells. Blood 2009; 114:346-356.
http://dx.doi.org/10.1182/blood-2008-12-191296 PMid:19365081 PMCid:PMC2714209
19. Porichis F, Hart MG, Zupkosky J, et al. Differential impact of PD-1 and/or interleukin-PD-10 blockade on HIV-PD-1-specific CD4 T cell and antigen-presenting cell functions. J Virol 2014; 88:2508-2518.
http://dx.doi.org/10.1128/JVI.02034-13 PMid:24352453 PMCid:PMC3958087
20. Grabmeier-Pfistershammer K, Steinberger P, Rieger A, et al. Identification of PD-1 as a unique marker for failing immune reconstitution in HIV-1-infected patients on treatment. J Acquir Immune Defic Syndr 2011; 56:118-124.
http://dx.doi.org/10.1097/QAI.0b013e3181fbab9f PMid:20980914
21. Spitsin S, Tustin NB, Riedel E, et al. Programmed death 1 receptor changes ex vivo in HIV-infected adults following initiation of highly active antiretroviral therapy. Clin Vaccine Immunol 2012; 19: 752-756. http://dx.doi.org/10.1128/CVI.00093-12 PMid:22441393 PMCid:PMC3346323
22. Cockerham LR1, Jain V, Sinclair E, et al. Programmed death-1 expression on CD4? and CD8? T cells in treated and untreated HIV disease. AIDS 2014; 28:1749-1758.
http://dx.doi.org/10.1097/QAD.0000000000000314 PMid:24871455 PMCid:PMC4206412
23. Rubbo PA, Van de Perre P, Tuaillon E. The long way toward understanding host and viral determinants of therapeutic success in HCV infection. Hepatol Int 2012; 6:436–440.
http://dx.doi.org/10.1007/s12072-011-9339-y PMid:26201406 24. Tuaillon E, Al Tabaa Y, Baillat V, et al. Close association of CD8+/CD38 bright with HIV-1 replication and complex relationship with CD4+ T-cell count. Cytometry B Clin Cytom 2009; 76: 249-260. http://dx.doi.org/10.1002/cyto.b.20467 PMid:19072838
Mediterr J Hematol Infect Dis www.mjhid.org 2016; 8: Open Journal System Pag. 8 / 8 commercial fluorescent bead-based luminex cytokine assays. PloS
ONE 2008; 3: e2535.
http://dx.doi.org/10.1371/journal.pone.0002535 PMid:18596971 PMCid:PMC2432042
26. Dupuy AM, Kuster N, Lizard G, et al. Performance evaluation of human cytokines profiles obtained by various multiplexed-based technologies underlines a need for standardization. Clin Chem Lab Med 2013; 51: 1385-1393. http://dx.doi.org/10.1515/cclm-2012-0648 PMid:23314551
27. Askarieh G, Alsio A, Pugnale P, et al. Systemic and intrahepatic interferon-gamma-inducible protein 10kDa predicts the first-phase decline in hepatitis C virus RNA and overall viral response to therapy in chronic hepatitis C. Hepathology 2010; 51:1523-1530.
http://dx.doi.org/10.1002/hep.23509 PMid:20186843 28. Sarasin-Filipowicz M, Oakeley EJ, et al. Interferon signaling and
treatment outcome in chronic hepatitis C. Proc Natl Acad Sci U S A 2008; 105:7034-7039.
http://dx.doi.org/10.1073/pnas.0707882105 PMid:18467494 PMCid:PMC2383932
29. Feld JJ, Nanda S, Huang Y, et al. Hepatic gene expression during treatment with peginterferon and ribavirin: identifying molecular pathways for treatment response. Hepathology 2007; 46: 1548-1563. http://dx.doi.org/10.1002/hep.21853 PMid:17929300 PMCid:PMC2808168
30. Dill MT, Duong FH, Vogt JE, et al. Interferon-induced gene expression is a stronger predictor of treatment response than IL28B genotype in patients with hepatitis C. Gastroenterology 2011; 140: 1021-1031. http://dx.doi.org/10.1053/j.gastro.2010.11.039 PMid:21111740
31. Chen L, Borozan I, Feld J, et al. Hepatic gene expression discriminates responders and nonresponders in treatment of chronic hepatitis C viral infection. Gastroenterology 2005; 128:1437-1444.
http://dx.doi.org/10.1053/j.gastro.2005.01.059 PMid:15887125 32. Micheloud D, Salcedo M, Banares R, et al. Serum levels of fibrosis biomarkers measured early after liver transplantation are associated with severe hepatitis C virus recurrence. Transpl Infect Dis 2009; 11:183-188. http://dx.doi.org/10.1111/j.1399-3062.2009.00370.x PMid:19254326
33. Mühlbauer M, Bosserhoff AK, Hartmann A, et al. A novel MCP-1 gene polymorphism is associated with hepatic MCP-1 expression and severity of HCV-related liver disease. Gastroenterology 2003; 125: 1085-1093. http://dx.doi.org/10.1016/S0016-5085(03)01213-7 34. El-Bassiouni NE, Mahmoud OM, El Ahwani EG, Ibrahim RA, El
Bassiouny AE. Monocyte adhesion molecules expression in patients with chronic hepatitis C liver disease. Mediterr J Hematol Infect Dis. 2013; 5(1): e2013054.
http://dx.doi.org/10.4084/mjhid.2013.054 PMid:24106604 PMCid:PMC3787663
35. Gu B, Ye B, Mao WL, Ye JL. Monocyte chemotactic protein-1 as possible prognostic markers of the efficacy of antiviral treatment in chronic hepatitis C. Hepatogastroenterology 2014; 61: 55-58. PMid:24895793
36. Heydtmann M, Adams DH. Chemokines in the immunopathogenesis of hepatitis C infection. Hepatology 2009; 49:676-688. http://dx.doi.org/10.1002/hep.22763 PMid:19177577 PMCid:PMC2919201
37. Tuyama AC, Hong F, Saiman Y, et al. Human immunodeficiency virus (HIV)-1 infects human hepatic stellate cells and promotes collagen I and monocyte chemoattractant protein-1 expression: implications for the pathogenesis of HIV/hepatitis C virus-induced liver fibrosis. Hepatology 2010; 52:612-22.
http://dx.doi.org/10.1002/hep.23679 PMid:20683959 PMCid:PMC2917256
38. Hong F, Bansal MB. HIV gp120(X4) promotes hepatic stellate cell activation, fibrogenesis, and proliferation: a potential mechanism
for rapid fibrosis progression in HIV/HCV coinfected patients. Hepathology 2009; 51:676-688.
39. Weiss JM, Nath A, Major EO, Berman JW. HIV-1 Tat induces monocyte chemoattractant protein-1-mediated monocyte transmigration across a model of the human blood-brain barrier and up-regulates CCR5 expression on human monocytes. J Immunol 1999; 163:2953-2959. PMid:10453044
40. Kim BO, Liu Y, Zhou BY, He JJ. Induction of C chemokine XCL1 (lymphotactin/single C motif-1 alpha/activation-induced, T cell-derived and chemokine-related cytokine) expression by HIV-1 Tat protein. J Immunol 2004; 172:1888-1895.
http://dx.doi.org/10.4049/jimmunol.172.3.1888 PMid:14734774 41. Gu L, Tseng S, Horner RM, et al. Control of TH2 polarization by
the chemokine monocyte chemoattractant protein-1. Nature 2000; 404:407–411. http://dx.doi.org/10.1038/35006097 PMid:10746730
42. Ansari AW, Heiken H, Meyer-Olson D, Schmidt RE. CCL2: a potential prognostic marker and target of anti-inflammatory strategy in HIV/AIDS pathogenesis. Eur J Immunol 2011; 41:3412-3418. http://dx.doi.org/10.1002/eji.201141676 PMid:22076814
43. Zhang Y, Guo D, Zhao Y, et al. The effect of cytokine profiles on the viral response to re-treatment in antiviral-experienced patients with chronic hepatitis C virus infection. Antiviral Res 2011; 92: 247-254. http://dx.doi.org/10.1016/j.antiviral.2011.08.009 PMid:21889543
44. Florholmen J, Kristiansen MG, Steigen SE, et al. A rapid chemokine response of macrophage inflammatory protein (MIP)-1a, MIP-1ß and the regulated on activation, normal T expressed and secreted chemokine is associated with a sustained virological response in the treatment of chronic hepatitis C. Clin Microbiol Infect 2011; 17: 204-209. http://dx.doi.org/10.1111/j.1469-0691.2010.03206.x PMid:20219081
45. Shimoda K, Begum NA, Shibuta K, et al. Interleukin-8 and hIRH (SDF1-alpha/PBSF) mRNA expression and histological activity index in patients with chronic hepatitis C. Hepatology 1998; 28:108-115 http://dx.doi.org/10.1002/hep.510280116 PMid:9657103
46. Mahmood S, Sho M, Yasuhara Y, et al. Clinical significance of intrahepatic interleukin-8 in chronic hepatitis C patients. Hepatol Res 2002; 24:413-419. http://dx.doi.org/10.1016/S1386-6346(02)00136-5
47. Asselah T, Bièche I, Laurendeau I, et al. Liver gene expression signature of mild fibrosis in patients with chronic hepatitis C. Gastroenterology 2005; 129:2064-2075.
http://dx.doi.org/10.1053/j.gastro.2005.09.010 PMid:16344072 48. Polyak SJ, Khabar KS, Paschal DM, et al. Hepatitis C virus
nonstructural 5A protein induces interleukin-8, leading to partial inhibition of the interferon-induced antiviral response. J Virol 2001; 75:6095-6106. http://dx.doi.org/10.1128/JVI.75.13.6095-6106.2001 PMid:11390611 PMCid:PMC114325
49. Akbar H, Idrees M, Butt S, et al. High baseline interleukine-8 level is an independent risk factor for the achievement of sustained virological response in chronic HCV patients. Infect. Genet Evol 2011; 11:1301–1305.
http://dx.doi.org/10.1016/j.meegid.2011.04.021 PMid:21554996 50. Feng B, Yang RF, Zhang HY, et al. Early predictive efficacy of
core antigen on antiviral outcomes in genotype 1 hepatitis C virus infected patients. Braz J Infect Dis. 2015;19: 390-398
http://dx.doi.org/10.1016/j.bjid.2015.04.007 PMid:26100438 51. Dieterich DT1, Rizzetto M, Manns MP. Management of chronic
hepatitis C patients who have relapsed or not responded to pegylated interferon alfa plus ribavirin. J Viral Hepat. 2009; 16: 833-843. http://dx.doi.org/10.1111/j.1365-2893.2009.01218.x PMid:19889142