HAL Id: hal-00305212
https://hal.archives-ouvertes.fr/hal-00305212
Submitted on 1 Jan 2002
HAL is a multi-disciplinary open access
archive for the deposit and dissemination of sci-entific research documents, whether they are pub-lished or not. The documents may come from teaching and research institutions in France or abroad, or from public or private research centers.
L’archive ouverte pluridisciplinaire HAL, est destinée au dépôt et à la diffusion de documents scientifiques de niveau recherche, publiés ou non, émanant des établissements d’enseignement et de recherche français ou étrangers, des laboratoires publics ou privés.
Assessing the effects of land-use changes on annual
average gross erosion
Armando Brath, Attilio Castellarin, Alberto Montanari
To cite this version:
Armando Brath, Attilio Castellarin, Alberto Montanari. Assessing the effects of land-use changes on annual average gross erosion. Hydrology and Earth System Sciences Discussions, European Geo-sciences Union, 2002, 6 (2), pp.255-265. �hal-00305212�
Assessing the effects of land-use changes on annual average gross
erosion
Armando Brath, Attilio Castellarin and Alberto Montanari
Università di Bologna, Viale Risorgimento, 2 – 40136 Bologna, Italy
Email for corresponding author: [email protected]
Abstract
The effects of land-use changes on potential annual gross erosion in the uplands of the Emilia-Romagna administrative region, a broad geographical area of some 22 000 km2 in northern-central Italy, have been analysed by application of the Universal Soil Loss Equation
(USLE). The presence of an extended mountain chain, particularly subject to soil erosion, makes the estimation of annual gross erosion relevant in defining regional soil-conservation strategies. The USLE, derived empirically for plots, is usually applied at the basin scale. In the present study, the method is implemented in a distributed framework for the hilly and mountainous portion of Emilia-Romagna through a discretisation of the region into elementary square cells. The annual gross erosion is evaluated by combining morphological, pedological and climatic information. The stream network and the tributary area drained by each elementary cell, which are needed for the local application of the USLE, are derived automatically from a Digital Elevation Model (DEM) of grid size 250 × 250 m. The rainfall erosivity factor is evaluated from local estimates of rainfall of six-hour storm duration and two-year return period. The soil erodibility and slope length-steepness factors are derived from digital maps of land use, pedology and geomorphology. Furthermore, historical land-use maps of the district of Bologna (a large portion — 3720 km2 — of the area under study), allow the effect of actual land use changes on the soil erosion
process to be assessed. The analysis shows the influence of land-use changes on annual gross erosion as well as the increasing vulnerability of upland areas to soil erosion processes during recent decades.
Keywords: USLE, gross erosion, distributed modelling, land use changes, northern-central Italy
Introduction
The Universal Soil Loss Equation (USLE), (Wischmeier and Smith, 1965; 1978) is probably the best-known empirical formula for predicting long-term (annual, monthly) gross erosion and is used frequently by soil conservationists around the world. The original equation, derived by analysis of extensive field measurements over small agricultural plots, was suitable only for spatial scales up to 1 ha (0.01 km2) and time scales of a month or year, and so was
immediately applicable to only a limited number of practical problems. However, many researchers have extended the approach to different spatial and time scales. Julien and Frenette (1987) introduced a correction factor to extend the applicability of USLE to larger areas and large catchments. Young et al. (1987) used an event-based extension of the USLE for medium to large catchments within the Agricultural Non-Point Source Pollution (AGNPS) model;
a catchment is divided into elementary cells, regarded as separate hydrological units and the USLE is applied to each elementary cell to predict soil erosion. More recently, Kinnel (2000) proposed including in AGNPS a modified USLE (USLE-M), which is more suited to event-based prediction and accounts for the impact of upslope runoff on soil erosion. Jain and Kothyari (2000) presented a catchment scale and event-based application of the USLE using a Geographical Information System (GIS) to identify sediment source areas and predict storm sediment yield; the performance was assessed by comparing observed and simulated storm sediment yields for two Indian catchments. To investigate the influence of spatial resolution on soil loss prediction, Molnár and Julien (1998) compared USLE calculations on different spatial scales of discretisation of the basin area into elementary grid cells, of sizes ranging from 30 × 30 m up to 6 × 6 km. Pilotti and Bacchi (1997) applied the
Armando Brath, Attilio Castellarin and Alberto Montanari
distributed form of the USLE to an alpine catchment in Italy. The present study makes a regional GIS application of the USLE by implementing the algorithm proposed by Pilotti and Bacchi (1997) to the 22 000 km2 hilly and mountainous
portion of the Italian administrative region Emilia-Romagna. The study focuses on two main aspects. The first assesses whether a regional scale application can provide useful indications about natural vulnerability to soil erosion of wide mountainous areas. Such estimates at the regional scale may assist in defining regional soil conservation strategies and can identify the most vulnerable areas where smaller scale evaluations of the erosion risk should be made. The second main aspect highlights, again on a regional scale, the effects on broad geographical areas of land-use changes on erosion vulnerability. Land-use maps for 1955 and 1980, available for a sub-portion of the present study area, show the extent of the changes in land usage in the hilly and mountainous areas over the period. This evidence suggests a fresh application of the approach on the basis of different historical land use scenarios.
Estimation of upland erosion
An extensive study by Wischmeier and Smith (1965) led to the definition of the USLE. This empirical relation computes the long-term (usually monthly or yearly) soil loss at a given location as follows:
A = RK
[
(
λ 22.13)
m]
SCP (1)where A is the soil loss in tons per unit area and time [t/(ha·y)]; R is the rainfall erosivity factor [(MJ·mm)/ (ha·h·y)]; K is the soil erodibility factor [(t·h)/(MJ·mm)]; λ is the field length (m) normalised to a plot length of 22.13 m; m is an exponent depending on field slope (dimensionless); S is the field slope factor normalised to a field slope of 9% (dimensionless), C is the cropping management factor normalised to a tilled area with continuous fallow (dimensionless) and P is the conservation practice factor normalised to straight-row farming up and down the slope (dimensionless).
Equation (1) is suitable for plots with homogeneous characteristics and, therefore, it is not directly applicable when the climatic, morphological, soil-type and soil-use characteristics vary along the slope. In the study by USDA-ARS (1991), the USLE is extended to heterogeneous plots by subdividing them along the slope into segments, whose within-segment physiographic, climatic and soil characteristics can be assumed constant. The approach then evaluates the total soil loss per unit-width, A(xi), by the equation:
( )
x
iA
=∑
= ∆ i j j A 1 = (2) where xj and xj-1 (m) are the distances from the top of the plot to the lower and upper edges of the j-segment respectively, and ∆Aj is the segment contribution toA(xi) [(t·m)/(ha·y)].
Starting from Eqn.(2), Pilotti and Bacchi (1997) developed an algorithm for the distributed application of the USLE to catchments of any dimension. Firstly, the flow paths are identified within the drainage basin on the basis of a Digital Elevation Model (DEM). Secondly, the overland grid cells are distinguished from those of the river network by choosing a constant Critical Source Area (CSA), (Montgomery and Foufoula-Georgiou, 1993), so that a given grid cell belongs to the river network if its contributing area (i.e. the area that the cell drains) is greater than the CSA. Then, the procedure regards each flow path as a single hillslope subdivided into separate elementary cells where the specific soil-loss A∆ [t/(ha·y)] is evaluated. The j-cell
j A
∆ can be evaluated as follows:
j A ∆ = j j
[
jm j m]
j j j m P C S n n K R g j j j 1 1 1 13 . 22 + − + − (3)where g (m) is the DEM grid-size, and nj (dimensionless) is the number of cells that the j-cell drains. Equation (3) is derived from (2) on the assumption that the ∆Aj due to the sheet erosion of two (or more) convergent flow paths is produced by the same two (or more) flow paths in series (Pilotti and Bacchi, 1997).
Regional scale upland erosion: an
Italian case study
The methodology outlined above is applied within a GIS environment to an Italian regional case study (Fig. 1), the Emilia-Romagna administrative region (22 000 km2), for
which data on morphological, climatic and soil-use characteristics are available. The approach was applied, in particular, to the hilly and mountainous portion (altitude ≥ 60 m a.s.l.) of the region, thus excluding from the study the flat areas which are naturally less exposed to sheet and rill erosion processes.
The flow paths are retrieved automatically for the study area from a DEM of grid size 250 × 250 m, after removing the pits and flat areas, using an eight-direction pour point algorithm (ESRI, 1994). This algorithm defines the flow direction for a given grid cell as the direction of steepest descent among the eight possible choices connecting the
[
]
∑
= + − + − i j j j j m j m j j j mj RK x j x j S C P 1 1 1 1 13 . 22 1cell to the eight surrounding grid cells. Then, the upslope contributing area for each cell is calculated by summing the areas of all upslope cells draining into it. A contributing area of 12.5 ha (2 grid cells) was chosen as the CSA and used to differentiate overland cells to which to apply (3), from stream-network cells for which (3) is no longer appropriate.
Although the accuracy and reliability of computations would improve markedly at higher resolutions, a 250 m grid-size was deemed adequate for a distributed application of the USLE to identify the spatial variability of vulnerability to soil erosion for the whole region of study.
The annual average rainfall erosivity factor Rj [(MJ·mm)/ (ha·h·y)] was evaluated for any given cell j as a function of the local rainfall depth for a storm duration of six hours and a return period of two years, D6hr,2y,j, by the empirical equation (Wischmeier and Smith, 1978):
17 . 2 , 2 , 6 417 . 0 = hr y j j D R (4)
Although Eqn. (4) was derived originally for north-western USA, its estimates of the annual rainfall erosivity factor correspond to the values of annual R characteristic of hilly and mountainous areas of the northern Apennine (RER-ERSO, 1990; Bianchi et al. 2001).
The value of D6hr,2y,j for each cell in the study area was estimated by using the outcomes of a recent regional frequency analysis of rainfall extremes (Brath and Castellarin, 2001). The study area includes the Emilia-Romagna and Marche regions and extends to 37 200 km2.
The area is characterised by a rainfall-gauging network with 419 daily and 132 hourly raingauges with record lengths of more than 30 years. The regional analysis provides reliable estimates of the rainfall depth for any return period and storm duration ranging from 1 to 24 hours (Brath and Castellarin, 2001).
A digital soil map, available for the study area, describes soils in terms of their organic matter content and characteristics of texture, relative permeability and average slope (RER Cartographic Service, 1994). The erodibility factor of the soil, Kj [(t·h)/(MJ·mm)], was retrieved for the
j-cell from the digital soil map either by using the abacus
proposed by the USLE authors or, where soils have a silt content lower than 70%, by applying the following semi-empirical algorithm (Wischmeier et al., 1971):
(5) with Mj (dimensionless) expressed as follows:
(6)
where aj (%) is the soil’s content of organic matter, bj (1 to
4) and cj (1 to 6) are codes depending on the soil’s texture
and permeability respectively, αj (%) is the soil’s content of
silt, βj (%) the content of fine sand and γj (%) the content of
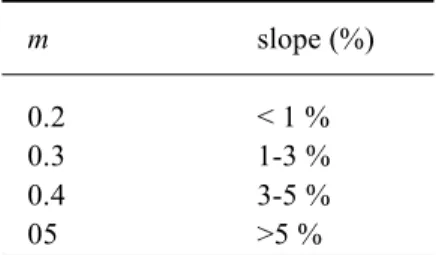
clay. The digital map information concerning soils’ average slope was then employed in the evaluation of both mj (see Table 1) and Sj. Sj was estimated by the following equation (Moore and Wilson, 1992):
(7) where θj is the slope gradient in degrees. Equation (7) was
adopted and validated in a recent study for the estimation of soil erosion and sediment yield using GIS (Jain and Kothyari, 2000).
The cropping-management factor Cj (dimensionless) was evaluated as a function of the soil-use characteristics of the
j-cell according to the indications reported in the USLE
manual (Wischmeier and Smith, 1965, 1978). These characteristics were derived from the digital land-use map of Emilia-Romagna for the year 1992. This map derives from a photo-interpretation of 1:100 000 satellite images and is produced in accordance with the guidelines defined within the European research programme CORINE (Co-ORdination of INformation on the Environment, European Environment Agency). Finally, the factor Pj (dimensionless) was set to 0.5 for all cells corresponding to plots and arboreal cultivation and, due to the absence of agricultural practices, equal to one everywhere else. The value 0.5 is an average value for farming on contours or contour strip cropping and slopes of 5-15%, as in this case (see for instance Shen and Julien, 1993).
The map in Fig. 2 shows the annual average gross erosion as computed by applying the approach described above. The map distinguishes areas of very low gross erosion (0–10 t ha–1y–1) from those with low (10–50 t ha–1 y–1),
moderately high (50–150 tha–1y–1) and high erosion (150–
500 t ha–1y-1) (Wischmeier and Smith, 1978). The application
shows differences in annual gross erosion from one zone to another and identifies the most vulnerable areas. The intermediate zone between the mountain region (southern
( )
(
)
[
2.1 10 12 129 . 0 100Kj = Mj1.14 −4 −aj(
2) (
2.5 3)
]
25 . 3 − + − + bj cj(
j j)(
j)
j M = α +β 100−γ(
sin 0.0896)
1.3 = j j θ STable 1. Values of the exponent m. m slope (%) 0.2 < 1 % 0.3 1-3 % 0.4 3-5 % 05 >5 %
Armando Brath, Attilio Castellarin and Alberto Montanari
Fig. 1. Emilia-Romagna administrative region, district of Bologna and Sillaro Torrent catchment.
border) and the foothills is the most likely to experience moderately high and high soil losses because of an unfavourable combination between the rainfall erosivity capacity and the erodibility of soils. In this intermediate area, the rainfall erosivity capacity is lower than that in the mountain regions and higher than that in the foothills, while the strength of the soil is much lower in the foothills and higher in the mountain region.
MODEL VALIDATION
The empirical derivation of the original USLE formulation affects all approaches that were developed from the USLE itself, such as the distributed approach that this analysis adopts. Therefore, the application of any USLE-based approach to a geographical context that differs, for example climatically or geologically, from the area where the USLE originated must be validated against field measurements.
The study by Pilotti and Bacchi (1997) validated the distributed approach by applying it to an Italian alpine catchment located upstream from a dam and comparing the results with measurements of reservoir sedimentation.
The regional estimates of annual average gross erosion in the present case study were assessed qualitatively (i.e. visually) and quantitatively by reference to the district of Bologna (see Fig. 1).
Firstly, the gross erosion patterns identified by the model (Fig. 2) are compared visually with the observed soil vulnerability to sheet and rill erosion. For example, window A, in Fig. 2, encircles a hilly zone south of Bologna characterised by areas with sharp erosional sculptures, lacking or with scanty vegetation and normally dry watercourses (i.e. Bologna’s badlands). These areas are associated with “Argilla Scagliosa” outcrops (i.e. chaotic assemblage with an argillitic matrix affected by slaty cleavage, see Pini, 1999), and are extremely vulnerable to sheet and rill erosion.
Figure 2-A´ shows for window A the “Argilla Scagliosa” outcrops in grey and some of Bologna’s badlands in dark grey, whereas Fig. 2-A´´ compares the estimated annual gross erosion with the boundaries of the “Argilla Scagliosa” outcrops. Figs. 2-A´ and 2-A´´ show a notable agreement between Bologna’s badlands and the simulated patterns of moderately high (50–150 t ha–1y–1) and high (150–500
t ha–1 y–1) erosion risk. This example confirms on a visual
basis the validity of the pattern identified by the model. Secondly, a quantitative validation is performed. To assess the accuracy of the model estimates, the annual gross erosion estimated for the Sillaro Torrent catchment (138 km2) in the
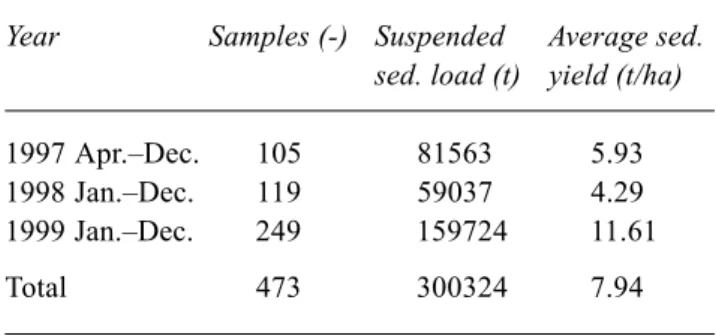
district of Bologna (Fig.1) was compared with measurements of suspended sediment load. An extensive measurement
campaign (473 samples over 33 months between 1997 and 1999) (Table 2) resulted in a total suspended sediment load of 300324 tons (Pavanelli et al., 2001), corresponding to an average annual soil loss of 7.9 t ha-1 y-1.
The estimate of the average annual gross erosion for the Sillaro Torrent catchment based on the 1992 land-use characteristics is equal to 48.0 t ha-1 y-1. An estimate of the
Sediment Delivery Ratio (SDR: the ratio of annual sediment yield to annual gross erosion) for this catchment can be calculated by using the empirical formula (Shen and Julien, 1993):
SDR = 0.41 A-0.3 (8)
where A is the catchment area (km2). Equation (8) produces
a SDR equal to 0.094 for the Sillaro catchment which, for the 1992 land-use scenario, gives an estimated annual sediment yield of 4.5 t ha-1 y-1. Shen and Julien (1993) report
the empirical relation between SDR and A of Eqn. (8) on a log-log diagram, together with the upper and lower bounds of the range of the experimental data used in its determination; the upper bound suggests a value of SDR of around 0.2 for an area A of 138 km2. The measured annual
suspended sediment load of. 7.9 t ha-1 can be reproduced
from the estimated annual gross erosion by using a SDR of 0.16, which is a feasible value for the Sillaro catchment. This supports the reliability of the order of magnitude of the model estimates of the annual gross erosion.
Recent soil-use changes in the study
area
Recently, considerable changes in land use have occurred in different ways in the various regions of Italy but a few general patterns can be delineated.
From the early 1950s, the meadows and pastures, which at that time characterised most of the upland regions,
Table 2. Measures of the suspended sediment load for the
Sillaro catchment (Pavanelli et al., 2001).
Year Samples (-) Suspended Average sed.
sed. load (t) yield (t/ha)
1997 Apr.–Dec. 105 81563 5.93 1998 Jan.–Dec. 119 59037 4.29 1999 Jan.–Dec. 249 159724 11.61 Total 473 300324 7.94
Armando Brath, Attilio Castellarin and Alberto Montanari
decreased as increasing industrialisation and urbanisation led to the abandonment of cattle-farming. Hence, these upland areas were left fallow and unproductive.
These patterns are detectable in a map of the district of Bologna (Fig. 1), which describes the land-use dynamics between the years 1955 and 1980. The map is one of the products of the special project RAISA (Advanced Researches for the Agricultural System Innovation) supported by the National Research Council of Italy, and describes the land-use characteristics, in 1955 and 1980, over the 3720 km2 wide area at 1:50 000 scale (Bertozzi et
al., 1992). The change in the soil-use characteristics in the
district of Bologna between 1955 and 1980 is shown in Fig. 3 in which, for the sake of generalisation, the original 10 land-use classes adopted by the RAISA project (Bertozzi et
al., 1992) were merged into 7 major classes: surface water;
fallow and unproductive areas; forestlands and woods; meadows and pastures; crops; arboreal cultivation; urbanised areas. The land-use changes, already evident in the maps of Fig. 3, are summarised in the bar-diagram of Fig. 4. The height of each bar segment is proportional to the relative areal extent of a given land-use type so that the heights of the different sectors sum to 100 %. While only slight changes can be observed in Fig. 4 when considering the areal extent of surface water and woods and crops, meadows and pastures fell from 23.7% in 1955 to 3% in 1980. This reduction was balanced by the increase in arboreal cultivation, unproductive areas and, only marginally, by the growth of urbanised areas. Although urbanised areas increased by more than 500% over the 25 years, their total extent in 1980 was still less than 5% of the entire district.
Effects of land-use changes on
upland erosion
Such land-use changes can have local, regional or global effects on hydrological processes (Calder, 1993) including the alteration of the natural vulnerability of a given region to soil erosion. To highlight the effects of land-use changes on soil erosion, the procedure presented earlier was applied in turn to the land-use scenarios of 1955 and 1980 for the district of Bologna. It was assumed that the climatic and morphological conditions were the same as those considered in the earlier application to the entire Emilia-Romagna region. While the small time span (25 years) ensures that this assumption is reasonable as regards the morphology of the area being studied, the same cannot be said for the climatic characteristics; Montanari et al. (1996) and Brath
et al. (2000) analysed Italian rainfall series and pointed out
the possible presence of non-stationarity. Nevertheless, the present paper focuses on the effects of land-use changes on
upland erosion independent of any effects induced by climate change.
Prior to evaluating the annual gross erosion for the different land-use scenarios of the district of Bologna it is worth highlighting that the land-use dynamics presented in the previous section refer to the entire district. To get a more objective perception of the effects of land-use changes on gross erosion, the land-use dynamics between 1955 and 1980 were re-analysed referring only to Bologna’s uplands. Using the grid environment with resolution 250 × 250 m as previously and adopting the criteria used in the evaluation of the annual average gross erosion for Emilia-Romagna (i.e. cell altitude ≥ 60 m a.s.l.; CSA = 12.5 ha), the grid cells belonging to the district of Bologna in which to apply (3) were finally identified. The land-use dynamics for this subset of grid cells are summarised in Fig. 5 using the layout adopted in Fig. 4. The same patterns that were detected with respect to the entire district are still visible when considering only the upland areas, even though in this case a few different features are present. There is still an important reduction in the extent of the meadows and pastures, which shrank from almost 50% of the upland territory in 1955 to less than 6% in 1980, whereas urbanised areas, fallow land and arboreal cultivation have expanded. When considering only the upland portion of the district of Bologna, a remarkable increase also characterises the crops, which on average do not show significant changes between 1955 and 1980 throughout the district (Fig. 4).
The evaluation of the annual average gross erosion relative to the 1955 and 1980 land-use scenarios was performed by re-applying the procedure presented earlier, except for the computation of the cropping-management factor C and the conservation practice factor P for the 1955 scenario. The simplified land-use classification adopted for the 1955 and 1980 scenarios (7 major land-use classes) required merging and averaging the C values reported in the USLE manual for the different soil-uses. The values adopted in the present study are reported in Table 3. The P factor for crops and
Table 3. Values of the cropping-management
factor C.
Land-use C (-)
Urbanised areas 0.000 Arboreal cultivation 0.259
Crops 0.100
Meadows and pastures 0.013 Forestlands and woods 0.005 Fallow and unproductive areas 0.020 Surface water 0.000