HAL Id: hal-02800827
https://hal.inrae.fr/hal-02800827
Submitted on 5 Jun 2020HAL is a multi-disciplinary open access archive for the deposit and dissemination of sci-entific research documents, whether they are pub-lished or not. The documents may come from teaching and research institutions in France or abroad, or from public or private research centers.
L’archive ouverte pluridisciplinaire HAL, est destinée au dépôt et à la diffusion de documents scientifiques de niveau recherche, publiés ou non, émanant des établissements d’enseignement et de recherche français ou étrangers, des laboratoires publics ou privés.
Deliverable D4.20, Part 2 6 Report on Claim WP4 Task
2, Activity c) (Ad-Hoc studies)
M. Arriaza, Tufan Bal, Petar Borisov, M. Cagla, S. Colombo, Laurence
Delattre, Veronika Ehmeier, Giuliano Galimberti, Renata Giedych, Florian
Gueniot, et al.
To cite this version:
M. Arriaza, Tufan Bal, Petar Borisov, M. Cagla, S. Colombo, et al.. Deliverable D4.20, Part 2 6 Report on Claim WP4 Task 2, Activity c) (Ad-Hoc studies). [Contract] 2014. �hal-02800827�
CLAIM D4.20 - Part 2 1
Project no. 289578
Claim
Supporting the role of the Common agricultural policy in Landscape valorisation: Improving the
knowledge base of the contribution of landscape Management to the rural economy
Call identifier: FP7-KBBE.2011.1.4-04
Funding scheme: Collaborative project
Part 2
Report on Claim WP4 Task 2, Activity c) (Ad-Hoc studies)
Deliverable D4.20
First draft: 28.02.2014
Final version: 01.04.2014
Start date of project: 01 January 2012
Duration: 36 months
Organisation name of lead beneficiary for this deliverable: BOKU
[authors see page 2]
Vienna, 01.04.2014
Project funded by the European Commission within the Seventh Framework Programme (2007- 2013) Dissemination Level
PU Public X
PP Restricted to other programme participants (Including the Commission Services) RE Restricted to a group specified by the consortium (Including the Commission Services) CO Confidential, only for members of the consortium (Including the Commission Services)
CLAIM D4.20 - Part 2 2
CLAIM Project:
Organisation Short Country
ALMA MATER STUDIORUM-UNIVERSITA DI BOLOGNA (Coordinator) UNIBO Italy
LEIBNIZ-ZENTRUM FUER AGRARLANDSCHAFTSFORSCHUNG ZALF Germany
JOINT RESEARCH CENTRE- EUROPEAN COMMISSION - Institute for
prospective technological studies JRC – IPTS Spain
UNIVERSITAET FUER BODENKULTUR WIEN BOKU Austria
VERENIGING VOOR CHRISTELIJK HOGER ONDERWIJS WETENSCHAPPELIJK
ONDERZOEK EN PATIENTENZORG VU-IVM Netherlands
INSTITUTO ANDALUZ DE INVESTIGACIONY FORMACION AGRARIA
PESQUERA ALIMENTARIA Y DE LA PRODUCCIONECOLOGICA IFAPA Spain
WARSAW AGRICULTURAL UNIVERSITY WAU Poland
SULEYMAN DEMIREL UNIVERSITY SDU Turkey
AGRICULTURAL UNIVERSITY AU Bulgaria
INSTITUT NATIONAL DE LA RECHERCHEAGRONOMIQUE INRA France
Authors of D 4.20 - Part 2:
UNIBO: Stefano Targetti, Rosa Manrique, Giuliano Galimberti, Meri Raggi, Matteo Zavalloni, Davide Viaggi
ZALF: Fabrizio Ungaro, Ingo Zasada, Kati Häfner, Annette Piorr
BOKU: Lena Schaller, Martin Kapfer, Veronika Ehmeier, Andreas Reindl, Jochen Kantelhardt
VU-IVM: Boris van Zanten, Peter Verburg
IFAPA: Rodríguez-Entrena, M., Colombo, S., Arriaza, M
WAU: Edward Majewski, Agata Malak-Rawlikowska, Paweł Kobus, Przemysław Wolski, Barbara Szulczewska, Renata Giedych, Gabriela Maksymiuk
SDU: F. Handan Giray, Tufan Bal, M. Cagla Ormeci Kart
AU: Dimitre Nikolov, Teodor Radev, Petar Borisov
CLAIM D4.20 - Part 2 3
Introduction to CLAIM D.4.20 – Part 2:
Report on WP4 Task 2, Activity c)
Activity c) represents original studies about the effects of landscape on economic activities and society welfare. These “ad-hoc studies” in Activity c) can be seen as the logical consequence of Activity a) and b): In the ad-hoc study, the knowledge gaps in the process of local answering the project’s guiding questions, that have been detected during Activity a) and b), shall be filled.
Furthermore, the ad-hoc studies test innovative methodologies likely to be sufficient in assessing the cause chain effects between landscape and rural development development/regional competitiveness. (At this, testing of methodologies is decided on case by case by the CLAIM consortium, depending on local need (and with a view of providing, altogether a coverage of different potential methods.)
Consequently, the different CSA ad-hoc studies do not follow a common methodological approach, as the different local basic conditions and knowledge gaps determine different needs and as a variety of methods shall be tested which could be suitable to address the projects objectives.
Part 4 of D4.20 represents the basic report on the application of different methods to answer the CSA specific research questions and on the final results of the ad-hoc studies. The report is organised country by country.
CLAIM D4.20 - Part 2 4
Contents of D4.20 – Part 2
1 CSA1: Landscape perception and ecosystem service uses: some results from surveys and latent variable models ... 5 2 CSA1: Using BBN to evaluate the influence of landscape on the creation of second-order effects: the case of agritourism. ... 39 3 CSA1: An Agent Based Model approach to the CSA 1 Ferrara Lowlands. ... 58 4 CSA2: Land-cover based assessment of landscape capacity to provide ecosystem services ... 67 5 CSA2: Mapping landscape services, competition and synergies. A case study using variogram models and geostatistical simulations in a rural landscape in Germany ... 76 6 CSA 2: Assessing the effect of scale enlargement on the provision of landscape services in a rural landscape in Germany ... 96 7 CSA 2: Assessing Cultural Ecosystem Services: A visual choice experiment on agricultural landscape preferences from a user perspective in the case study Märkische Schweiz, Germany ... 121 8 CSA 3: The role of stakeholder networks in landscape valorization: results of a Social Network Analysis
122
9 CSA3: Measuring the influence of landscape on the competitiveness of rural areas – an Austrian case study on municipality level ... 139 10 CSA 3: The impact of agricultural landscapes on rural development and regional competitiveness – Results of a short expert evaluation ... 159 11 CSA 4: Visitors’ landscape preference for a set of specific landscape attributes using visualized choice experiments ... 167 12 CSA 5: Is landscape attractiveness a driver of rural economy? The case of a pathway restoration in olive groves ... 188 13 CSA6: The impact of landscape structure and composition on regional competitivenessErrore. Il segnalibro non è definito.
14 CSA6: The impact of shelterbelts and CAP’s greening measures on landscape composition and farm performance in the Chlapowski landscape park ... 227 15 CSA7: Results of a survey of rose producers in Güneykent/Isparta ... 240 16 CSA8: Results of a survey of vine growing holdings in the Pazardjik district ... 245 17 CSA8: Results of survey of Wineries in the Pazardjik district on the contribution of landscape composition to wine tourism ... 262 18 CSA8: Consumers preferences to the landscape composition in wine tourism – Results of a choice experiment: ... 276 19 CSA9: Breeders’ production choices in the area “Castagniccia” in Corsica... 284
CLAIM D4.20 - Part 2 5
1 CSA1: Landscape perception and ecosystem service uses: some results from
surveys and latent variable models
Authors:
Galimberti G., Raggi M., Viaggi D.
1.1 Motivation and characteristics of the ad hoc study
The main objective of the first ad hoc study is to investigate the possible relationship between the relevance attributed to some components of agricultural landscape and the behavior in ecosystem service uses.
Data were collected through two ad hoc surveys carried out in the Po Delta area from July to September 2013. The first survey had the aim to collect information from inhabitants of the area selected, which is composed by ten municipalities: Codigoro, Comacchio, Goro, Jolanda di Savoia, Lagosanto, Massa Fiscaglia, Mesola, Migliarino, Migliaro and Ostellato. The municipalities were aggregated in three areas considering different geographical location and used as one of the three variables of stratification. The other two variables used to stratify the population were gender and age class.
The second survey was addressed to collect information from tourists. The questionnaire was distributed in 3 different occasions to people on the beach of the case study municipalities, distributed in the visit centers of the Po delta Park and in all agritourisms situated in the area. Finally, 380 tourists participated by compiling themselves the questionnaire.
Both questionnaires have the same structure even if some questions were adapted to be coherent with the respondents type (residents or tourists). The first set of questions have the aim to collect information about the perceptions of aspects of agricultural landscape. For the same set of landscape elements residents answered about their relevance for agricultural and tourism sectors and for inhabitants; instead tourists answered about the influence of the landscape elements on the choice of holiday location. More specifically the elements could be classified in two groups: “strictly” landscape elements (canals and bodies of water (lakes, ponds); herons, other fowl, aquatic animals; woods and characteristic plants, hedges, wetlands and other uncultivated land; rice paddies and related fauna (amphibians, insects, etc.); protected areas in the Po Delta Park;) and “promotional” landscape elements (networks of bicycle paths; wine and flavour routes (‘Strade dei vini e dei sapori’); crops and quality local products (PGI, PDO, DOCG); celebrations and local countryside festivals).
The second part focuses on “uses” of agricultural landscape services, in particular asking about local product purchases and activities connected to landscape (walking, bird watching, cycling,..). The last part of the questionnaire deals with individual and family characteristics (age, gender, education,…).
Data collected with the ad-hoc survey were analysed using Latent class factor models (Magidson and Vermunt, 2001), a particular subclass of latent variable models separately for residents and for tourists.
1.2 Methodology
Latent variable models are statistical models that can be used to analyze data in presence of unobservable variables. These models are particularly useful when one is interested in studying theoretical constructs that cannot be directly observed (such as the relevance attributed to landscape or to promotional activities related to landscape, or willingness to use landscape services). These models can be build starting from observed variables that can be considered as indirect indicators of such construct (for example the number
CLAIM D4.20 - Part 2 6
of landscape features that are considered relevant for the local economic activities, or the use of local agricultural products).
Latent class factor models (Magidson and Vermunt, 2001) are a particular subclass of latent variable models that are characterized by the assumption that the latent variables have an ordinal nature. Furthermore, these subclass of latent variable models allow to jointly consider more than one latent variable, and thus allow to investigate the relationships among the unobservable constructs. The commercial software Latent GOLD 4.0 (Vermunt and Magidson, 2005) can be used to estimate the parameters of these models.
1.2.1 Basic definition
Let Yi denote the i-th observed indicators, with i=1, ..., I, with I denoting the number of observed variables.
Although latent class factor models can deal with any type of observed indicators, in the following the attention is focused on either binary or ordinal indicators. In such a situation, the observed binary indicators are numerically coded by 0 or 1, and the observed ordinal indicators are coded by integer numbers ranging from 0 to S (without loss of generality, in the following ordinal indicators with the same number of categories are considered). Furthermore, it is assumed that binary indicators have a Bernoulli probability distributions and ordinal indicators have multinomial probability distributions. The key assumption of latent class factor models is that these probability distribution depend on L ordinal latent variables, with L≥1. These latent ordinal variables can have a different number of categories. For the sake of simplicity, in the following latent class factor models with two dichotomous ordinal latent variables, X1 and
X2 are considered.
The link between each binary indicator and the latent factors is expressed using a binary logistic regression model
(1)
x1 and x2 represent the numerical coding of specific levels of the two ordinal latent factors. In order to
guarantee identifiability of the resulting model, these numerical coding are set equal to fixed scores. Usually, equally spaced scores between 0 and 1 are considered. In this case, x1=0, 1, for l=1, 2.
Similarly, the link between each ordinal indicator and the latent factors is assumed to follow an adjacent-category ordinal logistic model
(2)
in equations (1) and (2), βi0, βi0s, βi1 and βi2 are unknown parameters that have to be estimated from an
observed data set. In particular βi1 and βi2 describe the strength of the relationship between Yi and each of
the two latent factors.
In order to complete the model definition, the joint distribution of the ordinal latent factors need to be specified. The simplest specification for this joint distribution can be obtained by assuming independence among latent factors. In such case, the joint distribution of the two factors in simply obtained by multiplying the two marginal distributions. In the case of dichotomous factors, these marginal distributions are modelled as follows:
CLAIM D4.20 - Part 2 7 Thus, for example,
(4)
Equations (3) and (4) can be combined to defining the following basic latent class factor model:
(5)
1.2.2 Estimation and inference
Latent class factor models are characterized by a set of unknown parameters that can be estimated using the maximum likelihood method.
Once the parameters of the model have been estimated, it is possible to compute the probability of an individual of belonging to one of the category of a latent factor, given the values of the observed indicators. For example, from Equation (5),
These probabilities can be used to assign a category of the latent factors to each individual, by resorting to the majority rule.
Hypothesis testing on the unknown parameters of latent class factor models can be performed using usual likelihood ratio tests (or, equivalently, using Wald tests, after having estimated the standard errors using the Fisher information matrix).
1.2.3 Some possible extensions of the basic model
The basic model above described can be extended in several ways. For example, it is possible to introduce the effect of C covariates Z1,..., ZC on the latent factor distributions given in Equation (3)
where z1,..., zC denote given values of the covariates and l1,..., lC are the unknown parameters that
measure the intensity of the effects of the covariates on Xl, l=1,2.
Furthermore, dependence between the latent factors can be introduced by assuming that
where . is an unknown parameter that measure the strength of association between X1 and X2.
Restrictions on the conditional distributions of the observed indicators can also be introduced, for example by setting βil equal to zero for some i and l (i=1,…,I and l=1,2), in order to let these distributions depend only
CLAIM D4.20 - Part 2 8
1.2.4 Model selection
Starting from a given set of observed indicators, several latent class factor models can be defined. Two latent class factor models obtained from the same data set can be compared using likelihood ratio tests or model selection criteria, such as AIC and BIC.
Likelihood ratio tests can be used only when two models are nested, that is when one of the two is obtained by imposing some restrictions on the parameters of the others. For example, nested models can be obtained by eliminating the effects of one covariate on the latent factors, or by setting to zero the association parameter between two latent factors.
Model selection criteria have to be used whenever the two model are not nested. For example, models with different number of latent factors, or models with the same latent factors but with different numbers of categories.
1.3 Results
1.3.1 Most relevant landscape features suggested by respondents
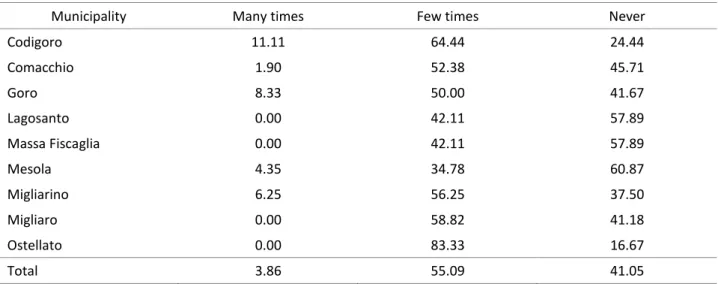
The first question in both questionnaire invited to list the main elements that characterize the agricultural landscape area in the 10 municipalities. The frequency of most cited aspects are presented in Table 1 showing that specific features of the area (intensive agricultural region, wet area as artificial canals, ponds, rivers and coastal zone) are remarked nearly the same by both residents and tourists. Obviously since these areas are mainly the location of a typical vacation along the coast that consist in doing activities on the beaches, the seaside has an higher frequency for tourists.
Table 1: Elements characterizing the agricultural landscape area (first in mind)
Elements Frequency of residents
(N=300)
Frequency of tourists
(N=380)
Agricultural area, crops, fields 59 + 7 Rice paddies 9 + 7 Rice paddies
Woods ,edges, wetlands 52 43
Canals and bodies of water, Po river 45 54
Beaches, seaside 44 130
Urban area 24 16
Herons, aquatic animals 4 9
Protected areas in the Po Delta Park 2 5
Two next sections illustrate results separately for residents and for tourists.
1.3.2 Results for residents
1.3.2.1 Some descriptivesA set of elements that characterised the case study landscape have been selected and used to ask about perception of landscape aspects. In particular for each element it was asked if it could be considered as an advantage or a disadvantage or indifferent for agricultural sector (Table 2), for tourism and commercial sector (Table 3) and for inhabitants (Table 4).
All the landscape elements are mainly considered as an advantage for agricultural sector (Table 2), but the presence of aquatic animals and of wetlands have the minor percentage. About the “promotional activity” the lowest percentage of an advantage is obtained by the presence of network of bicycle path.
CLAIM D4.20 - Part 2 9 Table 2: Role of landscape elements on agricultural sector (%)
Elements advantage indifferent disadvantage
Canals and bodies of water (lakes, ponds) 92.0 3.7 3.0
Herons, other fowl, aquatic animals 50.0 16.7 17.0
Woods and characteristic plants, hedges, wetlands and other uncultivated land
58.7 14.0 17.7
Rice paddies and related fauna (amphibians, insects, etc.)
64.0 11.0 15.7
Protected areas in the Po Delta Park 69.0 10.3 8.0
Networks of bicycle paths 58.7 22.7 8.7
Wine and flavour routes (‘Strade dei vini e dei sapori’) 74.7 7.3 1.3
Crops and quality local products (PGI, PDO, DOCG) 88.0 1.7 2.0
Celebrations and local countryside festivals 91.7 3.7 2.0
Considering the tourism and commercial sector, all the landscape elements are mainly considered as an advantage with one exception: the presence of “Rice paddies and related fauna” is judged more a disadvantage than an advantage (Table 3).
Table 3: Role of landscape elements on tourism and commercial sectors (%)
Elements advantage indifferent disadvantage
Canals and bodies of water (lakes, ponds) 75.3 7.3 10.0
Herons, other fowl, aquatic animals 87.3 4.3 3.0
Woods and characteristic plants, hedges, wetlands and other uncultivated land
77.7 6.0 12.7
Rice paddies and related fauna (amphibians, insects, etc.)
43.3 16.0 31.0
Protected areas in the Po Delta Park 91.3 2.7 2.0
Networks of bicycle paths 94.3 1.3 1.3
Wine and flavour routes (‘Strade dei vini e dei sapori’) 82.0 3.3 0.3
Crops and quality local products (PGI, PDO, DOCG) 88.0 2.3 2.3
Celebrations and local countryside festivals 94.7 1.3 2.3
Table 4 shows the percentage of advantage/disadvantage perception of landscape elements for inhabitants. The only element considered mainly a disadvantage is the presence of “Rice paddies and related fauna”. Instead all the other landscape aspects have a positive judgement.
Table 4: Role of landscape elements on residents (%)
Elements advantage indifferent disadvantage
Canals and bodies of water (lakes, ponds) 71.7 11.7 14.3
Herons, other fowl, aquatic animals 76.0 12.0 6.0
Woods and characteristic plants, hedges, wetlands and other uncultivated land
69.7 10.7 16.3
Rice paddies and related fauna (amphibians, insects, etc.)
38.7 15.0 39.7
Protected areas in the Po Delta Park 81.3 6.7 5.3
Networks of bicycle paths 93.3 1.7 2.0
Wine and flavour routes (‘Strade dei vini e dei sapori’) 75.0 7.3 2.0
Crops and quality local products (PGI, PDO, DOCG) 93.0 3.0 2.3
Celebrations and local countryside festivals 84.7 5.7 1.3
The second part of the questionnaire focuses on “uses” of landscape services. We consider two blocks of activities: recreational activities in rural area in the case study area or in the Po Delta area (walking; bird watching ( cycling; fishing in canals or other water bodies (not in the sea) or hunting; dining in rural guest houses (‘agriturismo’); visit to Po Delta Park) and purchases of local agricultural products (rice; wine; eel and/or clams; fruit and/or vegetables).
CLAIM D4.20 - Part 2 10
Some recreational activities have a very low (less than once in a month or never) incidence. That is quite justifiable for specific activities for example bird watching or fishing/hunting, but it is more unexpected for “dining in rural guest houses (‘agriturismo’)” and for “visit to Po Delta Park” (Table 5).
Table 5: Recreational activities in rural areas by residents in 2013 (%)
Activity Several times in a week Once or twice in a week Once or twice in a month Less than once in a month Never Walking 27.0 26.0 16.0 12.3 18.7
Bird watching (observation and study of birds and fowl in natural setting)
1.3 1.7 7.3 10.3 78.7
Cycling 33.7 27.7 12.7 7.3 18.7
Fishing in canals or other water bodies (not in the sea) or hunting
2.3 4.3 4.0 4.3 84.0
Dining in rural guest houses (‘agriturismo’)
1.0 2.7 19.0 35.7 41.3
Visit to Po Delta Park 1.7 0.7 6.7 34.0 56.0
Table 6 illustrates purchases frequency of local products: wine is the less often bought, followed by rice. Table 6: Purchase frequency of local products by residents (%)
Rice Wine Eel and/or clams Fruit and/or vegetables
Always 17.3 8.3 20.7 35.3
Often 23.7 16.3 37.3 43.3
Occasionally 24.0 18.3 29.0 13.7
Rarely 15.3 15.3 6.7 4.3
Never 16.7 40.3 6.0 2.7
The motivation of not buying agricultural local products is presented in Table 7 and in Table 8 is indicated the motivation of buying them. For all products except fruit and vegetables, the main motivation not buying them is because respondent doesn’t consume such products (34% for rice; 69% for wine and 66% for eel and clams). Concerning fruit and vegetables the main reason is the cost considered too high. The main motivation for buying local products is motivated by trusting in local producers.
Table 7: Why don’t you purchase quality local products? (%)
Motivation Rice
(N=96)
Wine (N=167) Eel and/or clams (N=38)
Fruit and/or vegetables (N=21)
I don’t consume such products 34.4 68.9 65.8 4.8
I don’t know where to buy them 19.8 2.4 - 4.8
I don’t buy them because they cost too much
11.5 3.0 21.1 19.0
I don’t not trust local producers 1.0 1.8 5.3 -
I’m not interested in quality local products
28.1 18.6 5.3 61.9
Table 8: Why do you purchase quality local products? (%, max two answers)
Motivation Percentage
They cost less (better value for money) 10.3 They have better flavour (they are better) 32.3
Trust in local producers 43.3
Support of local economy 20.7
Recommended by others (friends/family) 2.3 In favour of zero kilometre/zero mile philosophy 30.3
As gifts for friends/acquaintances 1.0
CLAIM D4.20 - Part 2 11 1.3.2.2 Model specification
Models with 4 latent ordinal factors were considered. As showed in Figure 1 each of these factors is related to only a subset of the observed indicators (illustrated as rectangle in the figure). In particular, factor 1 (with 2 categories) refers to awareness about the relevance of promotional activities, factor 2 (with 3 categories) accounts for awareness about the relevance of landscape features, factor 3 (with 2 categories) represents attitude to consume local products and factor 4 (with 3 categories) is related to attitude to exploit recreational services related to landscape.
In order to understand the relationships among awareness about the role of landscape and use of landscape services, all associations between pairs of factors were included in the model.
Finally, ten variables were considered as candidate covariates and their effects on the factors were included: age class, gender, income declared, labour condition, family type, years of residence, educational level, home location, area and agricultural-related occupation.
Parameters of this model were estimated using a data set composed of 295 residents, obtained by considering only residents with complete information about the indicators and the covariates.
1.3.2.3 Covariate selection
A backward elimination procedure was used to select the relevant covariates: starting from a complete model (including all covariates), each covariate was considered for elimination, obtaining 10 nested models. The p-value for the likelihood ratio tests that compare each of these nested models with the complete one were computed. The covariate whose elimination led to the largest p-value was selected and eliminated from the model if this p-value was larger than 0.05. This procedure was iterated until it was possible to find a covariate whose elimination produced a p-value larger than 0.05.
This backward elimination procedure led to the selection of 7 covariates: age class, gender, income declared, labour condition, family type, years of residence, educational level.
A null model (obtained by eliminating all the covariates from the model) was also fitted to the data.
The Table 9 shows comparisons between the model containing the selected covariates and the null and complete model. As it is possible to see, the selected model is significantly better than the null one. Furthermore, considering all the covariates does not lead to a significant improvement (the complete model is not significantly better than the selected one).
Table 9: Comparison among models
Loglikelihood Parameters AIC BIC Chisq df p-value selected covariates -3005.66 117 6245.32 6676.69
Null model
(no covariates) -3069.57 65 6269.14 6508.79 127.82 52 <0.001
Complete model
(all covariates) -2990.99 141 6263.99 6783.85 29.33 24 0.21
Table 10 reports the Wald test statistics and the corresponding p-value obtained by testing the significance of the specific covariate effects on each factor. As it is possible to see, no covariate affects the distributions of factor 1 (awareness about the relevance of promotional activities related to landscape), while factor 2 (awareness about the relevance of landscape features) seems to depend only on the educational level: highly educated people tends to have an higher awareness.
CLAIM D4.20 - Part 2 12
As far as factor 3 (attitude to consume local products) is concerned, the covariates having significant effects are age class, labour condition, family type, years of residence and (only marginally) gender. Specifically, attitude to consume local products seems to be higher for younger people, people with a job or looking for a job, couples with children, people living in the area for many years and males.
Finally, labour condition, family type, years of residence and income declared seem to significantly affects the distribution of factor 4. In particular, employed people, couples with children, people living in the area for few years and people who declared an income during the interview tends to have an higher attitude to exploit recreational services related to landscape.
Table 10: Inference on covariate effects on latent factors
DFactor1 DFactor2 DFactor3 DFactor4
Promotional elements Landscape elements Local products Recreational activities
Covariates Wald p-value Wald p-value Wald p-value Wald p-value
age class 0.1510 0.93 3.8701 0.14 6.4808 0.039 2.3892 0.30 labour condition 0.1050 0.95 0.8256 0.66 10.7716 0.0046 6.9673 0.031 family type 2.3132 0.31 0.5834 0.75 13.3478 0.0013 5.9298 0.052 years of residence 0.7649 0.86 5.9893 0.11 17.3900 0.00059 11.1450 0.011 income declared 0.0337 0.85 0.1168 0.73 0.0833 0.77 52.436 0.022 gender 0.2195 0.64 17.761 0.18 26.408 0.10 18.808 0.17 educational level 4.2022 0.12 8.9635 0.011 1.0736 0.58 1.3018 0.52 1.3.2.4 Association among factors
The following tables summarizes the results obtained with respect to the parameters (and corresponding Wald test statistics) in the model that are related to the associations among factors. As it is possible to see, some of these parameters are not significantly different from zero, thus implying conditional independence among some factors. Note that the sign of the association parameters may take negative values because for some factors (in particular factor 1, factor 3 and factor 4) the ordinal category corresponding to the high level is the first one (and not the last one, as for factor 2).
Table 11: Inference on association between latent factors
DFactors DFactor1 Wald p-value DFactor2 Wald p-value DFactor3 Wald p-value
DFactor2 -2.3400 7.9004 0.0050
DFactor3 1.1238 0.8164 0.37 0.1881 0.0187 0.89
DFactor4 0.4500 0.0683 0.79 -4.1141 4.7472 0.029 21.7651 11.7067 0.00062
Significant associations seem to relate factor 1 with factor 2 (high awareness about the relevance of promotional activities seems to be associated with high awareness about the relevance of landscape features), factor 2 with factor 4 (high awareness about the relevance of landscape features seems to be associated with high attitude to exploit recreational services related to landscape), and factor 3 with factor 4 (high attitude to exploit recreational services related to landscape seems to be related with high attitude to consume local products).
Figure 1 summarizes the final structure of the model showing significant associations between factors, observed variables and significant covariate effects on latent factors.
CLAIM D4.20 - Part 2 13 Figure 1: Structure of the model for residents
1.3.3 Results for tourists
1.3.3.1 Some descriptivesThe second survey collected information from tourists that fulfilled themselves the questionnaire. We kept the same structure of the residents questions, but some adaptations were necessarily needed. In particular, we asked about the influence of landscape elements on the decision to spend vacation in the area. The set of elements includes all the previous ones (“strictly” landscape elements and “promotional” landscape elements) and add some aspects more related to the holiday issues: beaches/seaside infrastructures; lower prices/cost; celebrations and local countryside festivals; knowledge of, and ties with, the territory.
The main” attractiveness” were beaches/seaside infrastructures and knowledge of, and ties with, the territory; the less one was rice paddies & related fauna. All the “strictly” landscape elements show a small influence (Table 12).
CLAIM D4.20 - Part 2 14 Table 12: Influence of landscape elements on decision to spend vacation in the area (%)
Elements very
much
somewhat not very much
not at all don’t
Canals and bodies of water (lakes, ponds) 16.1 28.2 24.2 22.1
Herons, other fowl, aquatic animals 17.1 33.9 24.2 15.3
Woods and characteristic plants, hedges, wetlands and other uncultivated land
15.8 29.5 25.5 18.9
Rice paddies & related fauna (amphibians, insects, etc.) 5.3 13.7 35.5 35.0
Protected areas in the Po Delta Park 26.1 33.2 21.1 11.1
Networks of bicycle paths 15.8 28.2 25.3 21.8
Wine and flavour routes (‘Strade dei vini e dei sapori’) 12.1 29.2 25.0 21.3 Crops and quality local products (PGI, PDO, DOCG) 17.6 30.0 26.3 13.7
Beaches / Seaside infrastructures 48.9 30.8 8.4 6.1
Lower prices/cost 19.5 30.8 23.2 16.8
Celebrations and local countryside festivals 13.2 32.1 27.1 17.6
Knowledge of, and ties with, the territory 32.1 32.1 16.3 9.5
Quite high percentage of none recreational activity was registered. The only two activities with a significant frequency are walking and cycling. (Table 13).
Table 13: Recreational activities in rural areas or in the Po Delta park during the vacation (%)
Activity often occasionally rarely never will do
Walking 56.3 25.5 4.2 5.8 1.3
Bird watching (observation and study of birds and fowl in natural setting)
5.5 13.9 13.9 44.5 4.5
Cycling 24.7 25.3 12.6 22.1 3.9
Fishing in canals or other water bodies (not in the sea) or hunting
3.2 5.3 7.4 66.6 1.3
Dining in rural guest houses (‘agriturismo’) 13.9 20.3 15.5 33.2 4.7
Visit to Po Delta Park 7.4 23.4 15.5 29.5 11.3
Purchase of local products during the vacation are likely for eel/clams and fruit/vegetables, but not for rice and wine (Table 14).
Table 14: Purchase possibility local products during the vacation (%)
Rice Wine Eel and/or clams Fruit and/or vegetables
Without a doubt yes 18.2 22.1 24.2 51.8
Likely Yes 14.7 17.1 19.5 17.1
Likely not 22.1 17.4 13.7 6.6
Without a doubt no 22.1 24.5 21.3 8.7
Main motivation of not buying local products is the same for tourists and residents (“I don’t consume such products”) recording the highest percentage for all products (Table 15).
Table 15: Why don’t you purchase local products? (%)
Rice (N=168) Wine (N=159)
Eel and/or clams (N=133)
Fruit and/or vegetables (N=58)
I don’t consume such products 34.5 59.7 73.7 13.8
I don’t know where to buy them 26.8 6.3 2.3 8.6
I don’t buy them because they cost too much
7.1 5.0 6.0 13.8
I don’t not trust local producers 0.6 1.9 - 1.7
I’m not interested in quality local products
14.3 13.8 9.0 34.5
CLAIM D4.20 - Part 2 15
Table 16 illustrates that the most relevant reason for buying local products is because they have a better taste flavour.
Table 16: Why do you purchase quality local products? (%, max two answers)
Motivation Percentage
They cost less (better value for money) 10.0 They have better taste (they are better) 35.0
Trust in local producers 25.8
Support of local economy 21.8
Recommended by others (friends/family) 4.0 In favour of zero kilometre/zero mile philosophy 21.5
As gifts for friends/acquaintances 2.9
Other reasons 1.1
1.3.3.2 Model specification
Models with 5 latent ordinal factors were considered. Each of these factors is related to only a subset of the observed indicators. In particular, factor 1 is related to the importance of promotional activities related to landscape in deciding the present holiday destination, factor 2 represents the importance of landscape features in deciding the present holiday destination, factor 3 refers to the attitude to consume local products during the present holiday, factor 4 accounts for the attitude to exploit recreational services related to landscape during the present holiday, and factor 5 is introduced in order to describe the importance of the so-called “seaside-type vacation” (a kind of vacation which is very typical along all the Emilia-Romagna coast, which, broadly speaking, consists in spending most of the holiday doing activities on the beaches) in deciding the present holiday destination. This factor states the tourist attraction for seaside and beaches. All factors have two ordered categories.
All the considered models included association parameters between each pair of factors, thus allowing to understand the relationships among the role of landscape in deciding the present holiday destination and the use of landscape services during the present holiday.
Finally, age class, gender, labour condition, family type, length of stay during the present holiday, number of previous holidays in the Delta Po area and type of interview (in a rural guest house/in a Delta Po park center/on a beach) were considered as candidate covariates for explaining the distributions of factors. Parameters of these models were estimated using a data set composed of 336 tourists, obtained by considering only tourists with complete information about the indicators and the covariates.
1.3.3.3 Covariate selection
A backward elimination procedure was used to select the relevant covariates: starting from a complete model (including all covariates), each covariate was considered for elimination, obtaining 8 nested models. The p-values for the likelihood ratio tests that compare each of these nested models with the complete one were computed. The covariate whose elimination led to the largest p-value was selected and eliminated from the model if this p-value was larger than 0.05. This procedure was iterated until it was possible to find a covariate whose elimination produced a p-value larger than 0.05.
This backward elimination procedure led to the selection of 4 covariates: age class, educational level, number of previous holidays in the same area and type of interview.
CLAIM D4.20 - Part 2 16
In Table 17 it is shown a comparisons between the model containing the selected covariates and the null and complete model.
Table 17: Comparison among models
Loglikelihood Parameters AIC BIC Chisq df p-value selected covariates -3963.797 94 8115.595 8474.403
Null model
(no covariates) -4077.562 59 8273.124 8498.333 227.529 35 4.482E-30
Complete model
(all covariates) -3936.710 134 8141.419 8652.912 54.176 40 0.067
As it is possible to see, the selected model is significantly better than the null one. Furthermore, considering all the covariates does not lead to a significant improvement (the complete model is not significantly better than the selected one).
Table 18 reports the Wald test statistics and the corresponding p-value obtained by testing the significance of the specific covariate effects on each factor.
The number of previous holidays in the Delta Po area seems to affect the distributions of all factors, apart from factor 1. In particular, tourists that have already spent some holidays in the Delta Po area tends to give lower importance to landscape features in their decision, have an higher attitude to consume local products but at the same time a lower attitude to exploit recreational services related to landscape. Finally, they seem to give higher importance to the “seaside-type vacation”.
As far as educational level is concerned, this covariate has significant effects only on factor 3 and 4: highly educated tourists show higher attitude both to consume local products and to exploit recreational services related to landscape.
With respect to the type of interview, it is possible to note that this covariate significantly affects factor 1, 2, 4 and 5. Namely, tourists interviewed on a beach seem to give higher importance to the “seaside-type vacation” and lower importance to landscape (with respect to both promotional activities and landscape features) in their decisions, and they show a lower attitude to exploit recreational services related to landscape.
Finally, age class seems to be related only to factor 2 and 5: younger tourists are characterized by a lower importance of landscape features in deciding the present holiday destination and a higher importance to the “seaside-type vacation”.
Table 18: Inference on covariate effects on latent factors
DFactor1 DFactor2 DFactor3 DFactor4 DFactor
5 Promot. elements Landscape elements Local products Recreat. activities Seaside Covariat es Wald p-value Wald p-value Wald p-value Wald p-value Wald p-value Previous holidays 1.997 0.160 6.369 0.012 1.645 0.200 2.832 0.092 4.715 0.030 Educatio nal level 1.214 0.550 2.172 0.340 5.562 0.062 7.682 0.021 1.774 0.410 Type of interview 5.988 0.050 5.332 0.070 1.180 0.550 14.390 0.001 8.995 0.011 Age class 2.621 0.270 14.943 0.001 1.337 0.510 0.967 0.620 5.761 0.056
CLAIM D4.20 - Part 2 17 1.3.3.4 Association among factors
Table 19 summarizes the results obtained with respect to the parameters (and corresponding Wald test statistics) in the model that are related to the associations among factors. As it is possible to see, some of these parameters are not significantly different from zero, thus implying conditional independence among some factors. Note that the sign of the association parameters may take negative values also in presence of a positive association because for some factors (in particular factors 2, 3 and 5) the ordinal category corresponding to the high level is the first one (and not the last one, as for factors 1 and 4).
Table 19: Inference on association between latent factors
DFactors DFactor1 Wald p-value DFactor2 Wald p-value DFactor3 Wald p-value DFactor4 Wald p-value
DFactor2 -1.281 6.040 0.014
DFactor3 0.485 0.472 0.490 0.723 1.411 0.230
DFactor4 0.829 1.633 0.200 -2.643 5.678 0.017 -0.933 0.551 0.460
DFactor5 -6.623 7.266 0.007 2.877 2.999 0.083 3.417 8.176 0.004 0.270 0.039 0.840
Significant associations seem to relate factor 1 with factor 2 (high importance of promotional activities seems to be associated with high importance of landscape features), factor 2 with factor 4 (importance of landscape features seems to be positively associated with high attitude to exploit recreational services related to landscape). Finally, factor 5 (importance of “seaside-type vacation”) seems to show significant positive associations with all factors, apart from factor 4.
Figure 2 summarizes the structure of the final model showing only significant associations between factors and relations between factors and observed variables.
CLAIM D4.20 - Part 2 18
Figure 3 summarizes the final structure of the model for tourists showing significant associations between factors and only significant covariate effects on latent factors.
Figure3: Model structure for tourists (only factors and significant covariates)
1.4 Discussion
The two discrete factor models have been obtained using observed indicators that refer to different aspects of the role attributed to promotional activities related to landscape and landscape features. Nevertheless, the results obtained from the data analyses suggest that their general structures are partly similar.
In particular, both models highlight a significant positive association between factor 1 and factor 2 (awareness of the relevance/importance attributed to promotional activities relate to landscape and awareness of the relevance/importance attributed to landscape features).
Furthermore, both models give some support to the hypothesis that awareness/importance attributed to landscape is positively associated to the attitude to use landscape services: this is confirmed by the significant positive association between factor 2 and factor 4 (awareness of the relevance/importance attributed to landscape features and attitude to exploit recreational services related to landscape). At the same time, however, it is interesting to note that both models are characterized by the absence of a “direct link” between that awareness/importance attributed to landscape and attitude to consume local products (no significant associations found between factor 1 and factor 3 and between factor 2 and factor 3).
CLAIM D4.20 - Part 2 19
The results validate the presence of a significant association between landscape awareness and ecosystem service uses. However the relevance of these results is mitigated by the low dimension of the groups identified. In fact the results show that only 9% of the residents appreciate landscape elements associated to an high use of landscape services (both recreational activities and local product purchases. This percentage increases to 19% considering the tourist model. This opens the question on choosing the best strategy to exploit the agricultural landscape in order to improve local competiveness, which may involve increase the knowledge on positive landscape aspects, acting on landscape management in order to improve further landscape features, valorise local landscape services towards a wider population.
References
Magidson J., Vermunt J. K. (2001) Latent class factor and cluster models, bi-plots, and related graphical displays. Social Methodology 31, 223-264.
Vermunt J. K., Magidson J. (2005) Technical Guide for Latent GOLD 4.0: Basic and Advanced. Statistical Innovations Inc., Belmont, MA.
CLAIM D4.20 - Part 2 20 APPENDIX 1: Questionnaire
Buonasera, parlo con la famiglia del sig./sig.ra {Cognome}?
Sono un’intervistatrice/tore del Centro Demoscopico Metropolitano della Provincia di Bologna e la sto contattando per conto dell’Università di Bologna. Stiamo svolgendo alcune interviste sul legame tra paesaggio ed attività economiche nelle aree rurali e per ottenere conoscenze sul futuro sociale ed ambientale come conseguenza dei cambiamenti della politica agricola. Il sondaggio fa parte di un progetto europeo (CLAIM) ed aiuterà a fornire indicazioni alla Commissione Europea nei processi di riforma della Politica Agraria Comune.
Posso farle alcune domande? L’intervista durerà pochi minuti
Le ricordo che le informazioni raccolte verranno utilizzate esclusivamente ai fini della ricerca, comunicate e diffuse esclusivamente in forma aggregata, nel rispetto delle norme sulla privacy e sulla tutela delle persone e dei dati personali.
Lei è maggiorenne e residente all'indirizzo a cui la sto chiamando?
Se minorenne o non residente all'indirizzo a cui la si sta chiamando l'intervista non può essere svolta.
domanda: 2
Indicare il genere
[01] Singola - maschio
[02] Singola - femmina
domanda: 2.1
Le posso chiedere la sua età (in anni compiuti)?
intervistare persone con età compresa tra i 18 anni i 70 anni compiuti.
Classi: 18-34 |35-54| 55-70
[01] Testo - età
[99] Singola - Non risponde
domanda: 2.2
Codificare l'età appena chiesta secondo le seguenti classi (et=[2.1]).
Se non ha voluto dichiarare i propri anni usare questa domanda: in quale delle
seguenti classi d'età la posso inserire?
[1] Singola - 18-34
[2] Singola - 35-54
[3] Singola - 55-70
domanda: 2.5
Come prima cosa le chiedo di indicarmi 3 elementi del paesaggio che secondo lei
caratterizzano la zona in cui vive
[01] Testo Multilinea - specificare (ANDARE A CAPO PER OGNI ELEMENTO INDICATO)
[77] Singola - Non ci sono elementi caratteristici del paesaggio
[88] Singola - Non so
CLAIM D4.20 - Part 2 21
3.0
Ora le proporrò un elenco di elementi del paesaggio; per ciascuno mi dovrà dire se
rappresentano un vantaggio o uno svantaggio per: il settore agricolo, il sistema turistico/commerciale/alberghiero o per chi abita sul territorio.
3.01
Secondo lei la presenza di canali e specchi d’acqua è un vantaggio, uno svantaggio, nessuno dei due, per:
un vantaggio uno svantaggio nessuno dei due Non so Non risponde 3.01.1 Il settore agricolo
3.01.2 Il sistema turistico, commerciale e
alberghiero
3.01.3 Per chi vi abita
3.02
Secondo lei la presenza di aironi, altri volatili, animali acquatici è un vantaggio, uno svantaggio, nessuno dei due, per:
un vantaggio uno svantaggio nessuno dei due Non so Non risponde 3.02.1 Il settore agricolo
3.02.2 Il sistema turistico, commerciale e
alberghiero
3.02.3 Per chi vi abita
3.03
Secondo lei la presenza di boschi e piante caratteristiche, siepi, zone umide e altre zone
non coltivate è un vantaggio, uno svantaggio, nessuno dei due, per:
un vantaggio uno svantaggio nessuno dei due Non so Non risponde 3.03.1 Il settore agricolo
CLAIM D4.20 - Part 2 22 3.03.2 Il sistema turistico, commerciale e
alberghiero
3.03.3 Per chi vi abita
3.04
Secondo lei la presenza di risaie e relativa fauna (anfibi, insetti, etc.) è un vantaggio, uno svantaggio, nessuno dei due, per:
un vantaggio uno svantaggio nessuno dei due Non so Non risponde 3.04.1 Il settore agricolo
3.04.2 Il sistema turistico, commerciale e
alberghiero
3.04.3 Per chi vi abita
3.05
Secondo lei le aree protette del parco del Delta del Po sono un vantaggio, uno svantaggio, nessuno dei due, per:
un vantaggio uno svantaggio nessuno dei due Non so Non risponde 3.05.1 Il settore agricolo
3.05.2 Il sistema turistico, commerciale e
alberghiero
CLAIM D4.20 - Part 2 23
3.1
Parliamo adesso delle attività di valorizzazione e promozione del territorio e dei prodotti
locali. Come nel caso precedente mi dovrebbe dire se ciascuna è un vantaggio o uno svantaggio per i settori produttivi o per i cittadini del Comune dove vive.
3.11
Secondo lei la rete di piste ciclabili è un vantaggio, uno svantaggio, nessuno dei due, per: un vantaggio uno svantaggio nessuno dei due Non so Non risponde 3.11.1 Il settore agricolo 3.11.2 Il sistema turistico, commerciale e alberghiero
3.11.3 Per chi vi abita
3.12
Secondo lei la Strada dei vini e dei sapori è un vantaggio, uno svantaggio, nessuno dei due, per: un vantaggio uno svantaggio nessuno dei due Non so Non risponde 3.12.1 Il settore agricolo 3.12.2 Il sistema turistico, commerciale e alberghiero
3.12.3 Per chi vi abita
3.13
Secondo lei le feste e le sagre locali sono un vantaggio, uno svantaggio, nessuno dei due, per: un vantaggio uno svantaggio nessuno dei due Non so Non risponde 3.13.1 Il settore agricolo 3.13.2 Il sistema turistico, commerciale e alberghiero
CLAIM D4.20 - Part 2 24
3.13.3 Per chi vi abita
3.14
Secondo lei i disciplinari legati alla produzione tipica (IGP, DOC, DOCG) sono un vantaggio, uno svantaggio, nessuno dei due, per:
un vantaggio uno svantaggio nessuno dei due Non so Non risponde 3.14.1 Il settore agricolo 3.14.2 Il sistema turistico, commerciale e alberghiero
3.14.3 Per chi vi abita
domanda: 4.1.1
Le chiederò ora la frequenza di acquisto di alcuni prodotti tipici locali.
Lei o la sua famiglia acquista riso tipico della zona (zona dei comuni del Delta del Po)?
[01] Singola - Sempre (ogni volta che fa questo genere di acquisto)
[02] Singola - Spesso (il più delle volte che ne ha necessità, ma non sempre)
[03] Singola - Qualche volta (per particolari occasioni)
[04] Singola - Raramente (se capita)
[05] Singola - Mai
[88] Singola - Non ricorda
[99] Singola - Non risponde
domanda: 4.1.1.1 (SE ACQUISTA RARAMENTE O MAI)
Per quale motivo non acquista riso tipico della zona?
[01] Mono - Non consuma questo prodotto
[02] Multipla - Non sa dove acquistarlo
[03] Multipla - I prodotti locali costano troppo
[04] Multipla - Non ha fiducia nei produttori locali
[05] Multipla - Non ha interesse per le produzioni tipiche o locali
[99] Mono - Non risponde
domanda: 4.1.2
Lei o la sua famiglia acquista vino tipico della zona (zona dei comuni del Delta del Po)?
[01] Singola - Sempre (ogni volta che fa questo genere di acquisto)
[02] Singola - Spesso (il più delle volte che ne ha necessità, ma non sempre)
[03] Singola - Qualche volta (per particolari occasioni)
CLAIM D4.20 - Part 2 25
[05] Singola - Mai
[88] Singola - Non ricorda
[99] Singola - Non risponde
domanda: 4.1.2.1 (SE ACQUISTA RARAMENTE O MAI)
Per quale motivo non acquista vino tipico della zona?
[01] Mono - Non consuma questo prodotto
[02] Multipla - Non sa dove acquistarlo
[03] Multipla - I prodotti locali costano troppo
[04] Multipla - Non ha fiducia nei produttori locali
[05] Multipla - Non ha interesse per le produzioni tipiche o locali
[99] Mono - Non risponde
domanda: 4.1.3
Lei o la sua famiglia acquista anguille o vongole della zona del Delta del Po?
[01] Singola - Sempre (ogni volta che fa questo genere di acquisto)
[02] Singola - Spesso (il più delle volte che ne ha necessità, ma non sempre)
[03] Singola - Qualche volta (per particolari occasioni)
[04] Singola - Raramente (se capita)
[05] Singola - Mai
[88] Singola - Non ricorda
[99] Singola - Non risponde
domanda: 4.1.3.1 (SE ACQUISTA RARAMENTE O MAI)
Per quale motivo non acquista anguille o vongole tipiche della zona?
[01] Mono - Non consuma questo prodotto
[02] Multipla - Non sa dove acquistarlo
[03] Multipla - I prodotti locali costano troppo
[04] Multipla - Non ha fiducia nei produttori locali
[05] Multipla - Non ha interesse per le produzioni tipiche o locali
[99] Mono - Non risponde
domanda: 4.1.4
Lei o la sua famiglia, acquista frutta o verdura tipica della zona (zona dei comuni del
Delta del Po)?
[01] Singola - Sempre (ogni volta che fa questo genere di acquisto)
[02] Singola - Spesso (il più delle volte che ne ha necessità, ma non sempre)
[03] Singola - Qualche volta (per particolari occasioni)
[04] Singola - Raramente (se capita)
[05] Singola - Mai
[88] Singola - Non ricorda
[99] Singola - Non risponde
domanda: 4.1.4.1 (SE ACQUISTA RARAMENTE O MAI)
Per quale motivo non acquista frutta o verdura tipica della zona?
[01] Mono - Non consuma questo prodotto
[02] Multipla - Non sa dove acquistarlo
[03] Multipla - I prodotti locali costano troppo
[04] Multipla - Non ha fiducia nei produttori locali
[05] Multipla - Non ha interesse per le produzioni tipiche o locali
[99] Mono - Non risponde
domanda: 4.1.5 (SE ACQUISTA SEMPRE, SPESSO O QUALCHE VOLTA)
CLAIM D4.20 - Part 2 26
Riso: [risposta 4.1.1] Vino: [risposta 4.1.2]
Anguille e/o vongole: [risposta 4.1.3] Frutta e/o verdura: [risposta 4.1.4]
In base a quello che mi ha appena detto, per quali motivi acquista i prodotti agro-alimentari tipici della zona (zona dei comuni del Delta del Po)?
Può darmi fino a 2 risposte.
[01] Multipla - Costano meno (migliore rapporto qualità/prezzo)
[02] Multipla - Hanno pi sapore (sono pi buoni)
[03] Multipla - Fiducia nei produttori locali
[04] Multipla - Sostegno all’economia locale
[05] Multipla - Consigliato da amici e parenti
[06] Multipla - Favorevole agli acquisti a km 0
[07] Multipla - Per fare regali ad amici/conoscenti
[66] Testo - Altro
[99] Mono - Non risponde
4.3
Nel corso del 2013 ha svolto una delle seguenti attività in una zona rurale del suo
comune o dei comuni del Delta?
Tenga conto che parleremo di una frequenza che va da: più volte alla settimana, una o due volte alla settimana, una o due volte al mese, meno di una volta al mese; oppure mai
Più volte alla settimana
Una o due volte alla settimana
Una o due volte al
mese
Meno di una
volta al mese Mai Non so
Non risponde
4.3.1 una passeggiata
4.3.2 birdwatching (osservazione
e studio di uccelli e volatili in ambiente naturale)
4.3.3 un giro in bicicletta
4.3.4 pesca nei canali del Delta o
in specchi d’acqua (non in
mare) o caccia
4.3.5 consumo di pasti in un
agriturismo della zona
4.3.6 entrata ad un Centro visita
del parco del Delta del Po
domanda: 4.4
Dove si trova l’abitazione in cui vive?
[01] Singola - In un centro abitato (nucleo o frazione) del comune
LE RISPOSTE RUOTANO
CLAIM D4.20 - Part 2 27
[02] Singola - Vicino a canali o specchi d’acqua
[03] Singola - In una zona agricola (ma non vicina a canali o specchi d’acqua)
[99] Singola - Non risponde
domanda: 4.7
Lei sa quali servizi fornisce il Consorzio di Bonifica della pianura ferrarese? Può
darmi anche più di una risposta. NON LEGGERE LE RISPOSTE
[00] Mono - Non conosce l’esistenza del Consorzio
[01] Multipla - Progettare, eseguire, gestire, mantenere opere di bonifica
[02] Multipla - Partecipare alla formazione dei piani urbanistici
[03] Multipla - Tutela dell’ambiente dall’inquinamento
[04] Multipla - Gestione ed erogazione del patrimonio idrico
[05] Multipla - Tutela delle acque destinate all’irrigazione
[06] Multipla - Raccogliere e far defluire le acque piovane
[66] Testo - Altro, specificare:
[77] Mono - Non sa che servizi offre il Consorzio
[99] Mono - Non risponde
domanda: 4.8 (SE CONOSCE ALMENO UN SERVIZIO)
Quanto è soddisfatto del servizio che riceve dal Consorzio di Bonifica della pianura ferrarese?
[01] Singola - molto soddisfatto
[02] Singola - abbastanza
[03] Singola - poco
[04] Singola - per niente soddisfatto
[88] Singola - non sa
[99] Singola - non risponde
domanda: 5.1
Siamo alle ultime domande. Le chiederò alcune informazioni a fini statistici.
L’ultimo titolo di studio che ha conseguito?
[01] Singola - Senza titolo o Licenza elementare
[02] Singola - Licenza di scuola media inferiore
[03] Singola - Diploma professionale (2-3 anni)
[04] Singola - Diploma di scuola media superiore (4-5 anni)
[05] Singola - Master o corsi professionali post-diploma
[06] Singola - Laurea o diploma universitario
[07] Singola - Dottorato (PhD) / Master o titoli post-laurea
[99] Singola - Non risponde
domanda: 5.1.1
DA NON LEGGERE: HA MENO DI 20 ANNI ED E' LAUREATO Scusi, Lei mi ha detto di
avere [2.1] anni e di essere laureato: corretto?
[01] Singola - ha più di 19 anni
[02] Singola - non è laureato
[03] Singola - ha meno di 20 anni ed è laureato
domanda: 5.2
Lei attualmente :
[01] Singola - Occupato
[02] Singola - Lavoratore precario
CLAIM D4.20 - Part 2 28
[04] Singola - Cassa integrazione
[05] Singola - Disoccupato (ex-occupato)
[06] Singola - In cerca di prima occupazione
[07] Singola - Studente
[08] Singola - Ritirato dal lavoro (pensionato)
[09] Singola - Casalinga
[10] Singola - Altra condizione
[99] Singola - non risponde
domanda: 5.2.0.1
DA NON LEGGERE: RISULTA CASALINGA ED E' MASCHIO Mi può dire di nuovo la sua
condizione professionale?
[01] Singola - non è maschio
[02] Singola - non è casalinga
[03] Singola - è maschio e casalinga
domanda: 5.2.0.2
DA NON LEGGERE: RISULTA PENSIONATO/A ED HA MENO DI 54 ANNI Scusi, lei mi ha detto di avere meno di 54 anni e di essere [5.2]: corretto?
[01] Singola - ha più di 54 anni
[02] Singola - non è pensionato
[03] Singola - ha meno di 54 anni ed è pensionato
domanda: 5.2.1 (SE E’ OCCUPATO)
Ed occupato come:
[01] Singola - Imprenditore
[02] Singola - Artigiano/familiare coadiuvante
[03] Singola - Commerciante, agente commercio, rappresentante, …
[04] Singola - Libero professionista
[05] Singola - Dirigente
[06] Singola - Docente, insegnante scuola superiore
[07] Singola - Insegnante media, elementare, materna
[08] Singola - Quadro, direttivo, tecnico
[09] Singola - Impiegato
[10] Singola - Operaio
[99] Singola - non risponde
domanda: 5.2.2 (SE E’ OCCUPATO)
E lavora in uno di questi ambiti: LEGGERE LE RISPOSTE
[01] Singola - coltivazioni agricole; agro-alimentare
[02] Singola - pesca, itticoltura (allevamento pesci)
[03] Singola - turismo (alloggio, ristorazione)
[04] Singola - servizi ambientali (trattamento acqua, gestione rifiuti, …)
[05] Singola - gestione del verde (giardinaggio, vivaistica, …)
[06] Singola - trasporti
[07] Singola - altro ambito
[99] Singola - non risponde
domanda: 5.3
La sua famiglia di tipo:
CLAIM D4.20 - Part 2 29
[02] Singola - Coppia senza figli
[03] Singola - Coppia con figli
[04] Singola - Genitore singolo con figli
[05] Singola - Nucleo con altri familiari o parenti conviventi
[06] Singola - Persone conviventi non legate da vincoli affettivi (colleghi, amici, studenti, …)
[99] Singola - non risponde
domanda: 5.4
Da quanti anni risiede nell’attuale abitazione?
[01] Singola - da sempre (dalla nascita)
[02] Singola - dal 2013 (da quest'anno)
[03] Singola - dal 2012 (dall'anno scorso)
[04] Singola - dal 2011 (da due anni)
[05] Singola - dal 2010 (da tre anni)
[06] Singola - dal 2007-2009 (da 4-5 anni)
[07] Singola - dal 2002 - 2006 (da 6-10 anni)
[08] Singola - dal 1982-2001 (da 11-30 anni)
[09] Singola - dal 1966 - 1981 (da 31 - 46 anni)
[10] Singola - dal 1965 o prima (da più di 47 anni)
[88] Singola - Non ricordo
[99] Singola - Non risponde
domanda: 5.4.1 (SE NON RISIEDE DA SEMPRE NELL’ATTUALE ABITAZIONE)
E dove viveva prima di trasferirsi nell’attuale casa?
[01] Assistita - in un comune della zona del Delta del Po
[02] Singola - in altro comune provincia di Ferrara
[03] Singola - in provincia di Ravenna
[04] Singola - in provincia di Rovigo
[05] Singola - in provincia di Bologna
[06] Assistita - altra provincia emiliano-romagnola
[07] Singola - altra regione del nord d'Italia
[08] Singola - altra regione del centro Italia
[09] Singola - altra regione del sud Italia o isole
[10] Singola - all'estero
[99] Singola - Non risponde
domanda: 5.5
Infine l’ultima domanda.
Mi potrebbe indicare in quale delle seguenti fasce si colloca il reddito annuo della sua famiglia?
[01] Singola - Meno di 14.000 euro
[02] Singola - 14.001-28.000 euro
[03] Singola - 28.001-42.000 euro
[04] Singola - Oltre 42.000 euro
[88] Singola - Non so
[99] Singola - Non risponde
domanda: 6.0
CLAIM D4.20 - Part 2 30
Se vuole può lasciare un commento sulle questioni che abbiamo trattato.
[01] Testo - commento
CLAIM D4.20 - Part 2 31 APPENDIX 2: Detailed output for resident model with factor distributions
Distribution of factor 1 and conditional distribution of indicators within categories of factor 1
DFactor1
0 (Level1) 0.5 (Level2) 1 (Level3) DFactor Level Size 0.685 0.249 0.066
n_van_agr_prom 0 0.000 0.000 0.203 1 0.000 0.117 0.734 2 0.078 0.763 0.063 3 0.922 0.119 0.000 n_van_tur_prom 0 0.000 0.000 0.153 1 0.000 0.018 0.751 2 0.010 0.751 0.096 3 0.990 0.231 0.000 n_van_res_prom 0 0.000 0.000 0.305 1 0.000 0.111 0.655 2 0.078 0.809 0.039 3 0.922 0.079 0.000