HAL Id: hal-01777969
https://hal.sorbonne-universite.fr/hal-01777969
Submitted on 25 Apr 2018
HAL is a multi-disciplinary open access
archive for the deposit and dissemination of
sci-entific research documents, whether they are
pub-lished or not. The documents may come from
teaching and research institutions in France or
abroad, or from public or private research centers.
L’archive ouverte pluridisciplinaire HAL, est
destinée au dépôt et à la diffusion de documents
scientifiques de niveau recherche, publiés ou non,
émanant des établissements d’enseignement et de
recherche français ou étrangers, des laboratoires
publics ou privés.
Targeted versus untargeted omics - the CAFSA story
Maria del Mar Amador, Benoit Colsch, Foudil Lamari, Claude Jardel, Farid
Ichou, Agnès Rastetter, Frédéric Sedel, Fabien Jourdan, Clément Frainay,
Ronald Wevers, et al.
To cite this version:
Maria del Mar Amador, Benoit Colsch, Foudil Lamari, Claude Jardel, Farid Ichou, et al.. Targeted
versus untargeted omics - the CAFSA story. Journal of Inherited Metabolic Disease, Springer Verlag,
2018, 41 (3), pp.1-10. �10.1007/s10545-017-0134-3�. �hal-01777969�
Targeted versus untargeted omics
— the CAFSA story
Maria del Mar Amador1 & Benoit Colsch2 & Foudil Lamari3,4 & Claude Jardel3,4 & Farid Ichou5 & Agnès Rastetter6 & Frédéric Sedel7& Fabien Jourdan8& Clément Frainay8& Ronald A. Wevers9& Emmanuel Roze1,4,6& Christel Depienne10
& Christophe Junot2 & Fanny Mochel4,6,11,12
Abstract
Background In 2009, untargeted metabolomics led to the delineation of a new clinico-biological entity called cerebellar ataxia with elevated cerebrospinal free sialic acid, or CAFSA. In order to elucidate CAFSA, we applied sequentially targeted and untargeted omic approaches.
Methods and results First, we studied five of the six CAFSA patients initially described. Besides increased CSF free sialic acid concentrations, three patients presented with markedly decreased 5-methyltetrahydrofolate (5-MTHF) CSF concentrations. Exome sequencing identified a homozygousPOLG mutation in two affected sisters, but failed to identify a causative gene in the three sporadic patients with high sialic acid but low 5-MTHF. Using targeted mass spectrometry, we confirmed that free sialic acid was increased in the CSF of a third knownPOLG-mutated patient. We then pursued pathophysiological analyses of CAFSA using mass spectrometry-based metabolomics on CSF from two sporadic CAFSA patients as well as 95 patients with an unexplained encephalopathy and 39 controls. This led to the identifica-tion of a common metabotype between the two initial CAFSA patients and three addiidentifica-tional patients, including one patient with Kearns-Sayre syndrome. Metabolites of the CSF metabotype were positioned in a reconstruction of the human metabolic network, which highlighted the proximity of the metabotype with acetyl-CoA and carnitine, two key metabolites regulating mitochondrial energy homeostasis.
Conclusion Our genetic and metabolomics analyses suggest that CAFSA is a heterogeneous entity related to mitochondrial DNA alterations either throughPOLG mutations or a mechanism similar to what is observed in Kearns-Sayre syndrome.
* Fanny Mochel [email protected]
1
Assistance Publique-Hôpitaux de Paris, Département de Neurologie, La Pitié-Salpêtrière University Hospital, Paris, France
2
Service de Pharmacologie et Immuno-Analyse (SPI), Laboratoire
d’Etude du Métabolisme des Médicaments, CEA, INRA, Université
Paris Saclay, MetaboHUB, F-91191 Gif-sur-Yvette, France
3
Assistance Publique-Hôpitaux de Paris, Laboratoire de Biochimie Métabolique, La Pitié-Salpêtrière University Hospital, Paris, France
4
Université Pierre et Marie Curie, Groupe de Recherche Clinique Neurométabolique et Centre de Référence Neurométabolique Adulte, Paris, France
5 Institute of Cardiometabolism And Nutrition, ICAN, Metabolomics
Core Facility, Paris, France
6 Sorbonne Universités, UPMC-Paris 6, UMR S 1127, and Inserm U
1127, and CNRS UMR 7225, and ICM, F-75013 Paris, France
7
MedDay Pharmaceuticals, Paris, France
8
Université de Toulouse, INRA, Université de Toulouse 3 Paul Sabatier, Toulouse, France
9 Radboud University Medical Centre, Translational Metabolic
Laboratory, Department Laboratory Medicine, Nijmegen, the Netherlands
10
Hôpitaux Universitaires de Strasbourg, Unité de cytogénétique chromosomique et moléculaire, Strasbourg, France
11
Assistance Publique-Hôpitaux de Paris, Département de Génétique, La Pitié-Salpêtrière University Hospital, Paris, France
12 Reference Center for Neurometabolic Diseases, Department of
Genetics, La Pitié-Salpêtrière University Hospital, 47 Boulevard de
Introduction
In 2009, an untargeted metabolomics approach using nuclear magnetic resonance spectroscopy (NMRS) led to the delinea-tion of a new clinico-biological entity in six patients among a cohort of 144 patients presenting with a progressive and com-plex unknown neurological disease (Mochel et al2009). The main clinical features of these patients were cerebellar ataxia, peripheral neuropathy and cognitive/psychiatric manifesta-tions (Mochel et al2009). While there was no overt sign of mitochondrial dysfunction on patient’s muscle biopsy, their clinical presentation led to the clinical suspicion of a mito-chondrial disease but several mitomito-chondrial investigations were negative. NMRS showed a striking elevation of free sialic acid in the cerebrospinal fluid (CSF) of all six patients (Mochel et al2009). The term cerebellar ataxia with elevated cerebrospinal free sialic acid (CAFSA) was proposed. Given the association of free sialic acid elevation in CSF with hyposialylation of transferrin, pathophysiological investiga-tions were initially oriented toward sialic acid metabolism. Four candidate genes were investigated but did not bear any mutation in the CAFSA patients (Mochel et al2009). Thus, we decided to take advantage of new genetic and metabolic tools to elucidate CAFSA. We applied sequentially targeted and untargeted omic approaches, including whole exome se-quencing and mass spectrometry (MS)-based metabolomics, on a series of patients with cerebellar ataxia and elevated ce-rebrospinal free sialic acid.
Patients and methods
Patients
All patients described in this study were addressed to rare diseases reference centers (the Pitié-Salpêtrière university hos-pital, Paris, France mainly and the Radboud University Nijmegen Medical Center, The Netherlands) for diagnostic and therapeutic assessment. They were over 18 years and signed a written informed consent before participating in the studies (RCB 2010-A01395–34).
In order to elucidate the molecular basis of CAFSA, after our failed candidate gene approach (Mochel et al2009), we decided to first conduct an untargeted genetic analysis using whole exome sequencing. Out of the six CAFSA patients initially described, DNA was available in sufficient amount for five of them. Unfortunately, none of the parents’ DNA was accessible so we were not able to performtrio analyses. For the patients whose exome sequencing was inconclusive
(3/5), we wished to pursue pathophysiological analyses and understand their peculiar CSF profile using MS-based meta-bolomics. CSF was available for two out of three patients and were included in a larger CSF study performed in 134 patients selected from a CSF biobank collected from adult patients seen in the neurometabolic research group of the Pitié-Salpêtrière university hospital and previously described (Mochel et al 2009). Briefly, 95 patients presented with an unexplained encephalopathy, i.e., patients with progressive neurological disorders that were selected based on clinical and radiological features suggestive of an inborn error of me-tabolism. Additionally, we included 39 negative controls, i.e., subjects without progressive neurological disease, for whom a lumbar puncture (LP) had been performed because of head-ache, dizziness, non-organic psychogenic neurologic symp-toms, non specific pain or spinal disc herniation. In all cases, the presence of an underlying neurological disease was discarded by thorough diagnostic work-up. LP were per-formed for a routine work-up or follow-up of all patients and not solely for research purposes.
Measurement of sialic acid by MS
Sialic acid in CSF was measured by UPLC-MS/MS according to the method reported for sialic acid determination in urine (Van der Ham et al2007), with modifications as detailed in
eMethodin the Supplementary material. Intra- and inter-assay variation in CSF was determined by analyzing a mix of ten CSF obtained from controls (see above) and was 3.34% and 6.13%, respectively. Limit of detection was 1.15μM and limit of quantification was 3.12 μM. Free sialic acid calibration curve was linear between 3.12 and 200μM with R2= 0.998, as obtained by linear regression. The concentration of free sialic acid determined in the CSF from 39 controls (see above) was 11 ± 4.8μM, which is very similar to the concentration reported in controls by NMRS (Mochel et al2009).
Whole exome sequencing
Genomic DNA of patients was extracted from blood cells using standard phenol-chloroform procedures. Exome sequencing was performed by DNAvision (Charleroi, Belgium). Genomic DNA was captured using the SureSelect Human All Exon 50 Mb kit (Agilent), followed by 75 base pair paired-end mas-sively parallel sequencing on a HiSeq2000 sequencing system (Illumina), according to the manufacturers’ instruction and pro-tocols. Reads were mapped onto the reference genome (hg19) using the Burrows-Wheeler Aligner software (Li et al2009; Li and Durbin2010). Removing of duplicated reads and mutation
calling were performed using samtools (Li et al2009; Li and Durbin2010) according to the following criteria: position cov-erage greater or equal to 20, mutation proportion greater or equal to 25%, and mutated bases called at least 10% on each strand. Filtering of variants included i) a minor allele frequency (MAF)≤ 1% in Hapmap, 1000 Genomes, and Exome variant server, ii) a predicted deleterious impact on the gene/protein (indels introducing frameshifts, in-frame insertions or dele-tions, nonsense or splice-site mutadele-tions, mutations altering start or termination codons, or non-synonymous variants predicted to be possibly deleterious by SIFT or Polyphen-2), and iii) a variant status compatible with an autosomal recessive inheri-tance (homozygous or compound heterozygous variants). Mutation interpretation was assessed using Alamut2.1 (Interactive Biosoftware).
MS-based metabolomics
Samples, chemicals and reagents, CSF metabolite extraction, experimental settings for liquid chromatography coupled to high-resolution mass spectrometry (LC-HRMS), data process-ing, metabolite identification criteria, and visualization of metabotypes are detailed in theeMethodin the Supplementary material. CSF samples were centrifuged, decanted, and immedi-ately frozen at−80 °C after LP. Sample analysis was performed in three independent experiments (batches). Quality control sam-ples were injected at regular intervals throughout the experi-ments. They aimed at correcting analytical drifts within each batch and performing batch fusion.
CSF samples were treated by methanol for protein precipi-tation. LC-HRMS analyses were performed using a NEXERA-Shimadzu liquid chromatography system (Champs-sur-Marne, France) coupled to an Exactive mass spectrometer from Thermo Fisher Scientific (Courtaboeuf, France) fitted with an electrospray source operated in the positive and negative ion modes. The ultra-high performance liquid chromatographic (UHPLC) separation was performed on a Hypersil GOLD C8 1.9μm, 2.1 mm × 150 mm column at 30 °C (Thermo Fisher Scientific, les Ulis, France). Mobile phases were 100% water in A and 100% ACN in B, both containing 0.1% formic acid.
Regarding data processing, all raw data were manually inspected using the Qualbrowser module of Xcalibur version 2.1 (Thermo Fisher Scientific, Courtaboeuf, France), and au-tomatic peak detection and integration were performed using the XCMS software package (Smith et al2006). XCMS returned two data matrices (i.e., corresponding to detection and chromatography conditions) containing m/z and retention time values of features together with their concentrations expressed in arbitrary units (i.e., areas of chromatographic peaks). Features were annotated by matching their accurate measured masses ±10 ppm with theoretical masses contained in biochemical and metabolomic databases by using an infor-matics tool developed in R language. They were also
annotated by our spectral database according to accurate mea-sured masses and chromatographic retention times (Roux et al
2012; Boudah et al2014; Weiss et al2016). Features corre-sponding to identified or putatively annotated ions were se-lected. Data were expressed as ratios of individual levels ob-served for patients and controls to control mean levels. A metabolite was considered to be present in a sample at an abnormal concentration as soon as it was above the [mean concentration + 2SD] value (SD: standard deviation of metab-olite concentrations in a given experiment).
Network of metabotype analysis Recon2 version 3 human genome scale metabolic network was used as a context for metabotype analysis (Thiele et al2013). Recon2 aims at gath-ering all metabolic reactions which can occur in human cells or tissues (7440 reactions and 2626 metabolites) in a single mathematical framework called a network (more formally a graph). This large knowledge resource allows going further than just focusing on few key metabolic pathways. It is of particular interest for holistic approaches. Such as untargeted metabolomics. Which may reveal biochemical modulations spanning several metabolic pathways. Recon2 contains infor-mation on cellular localization of metabolites which cannot be obtained from metabolomics analysis. Hence, the network was modified to obviate compartment segmentation. The net-work was turned into a compound graph where nodes repre-sent metabolites. Two nodes are connected by edges if the two corresponding metabolites are substrates and products of the same reaction. In order to keep only relevant substrate to product pairs, the graph was filtered by keeping only pairs of substrate product exchanging at least one carbon (atom mapping was computed using the Reaction Decoder Toolkit (Rahman et al2016). Inorganic carbonated compounds such as CO2were also removed. Shortest path distance matrix was
computed between each pair of metabolites in the metabotype. The matrix was represented as a heatmap using R HeatMap2 package, grouping rows and columns according to hierarchi-cal clustering method with complete linkage for aggregation and Euclidean distance. Sub-networks characterizing each cluster were created from the union of all shortest paths be-tween cluster members. These sub-networks were displayed using MetExplore web server (Cottret et al2010).
Results
Patient characteristics and targeted analyses
Table1(upper section) summarizes the main clinical and bio-chemical characteristics of five out of the six CAFSA patients previously reported (Mochel et al2009). CSF free sialic acid concentrations from the five patients ranged from 36 to 67μM. Clinically, cerebellar ataxia manifested in adulthood
Table 1 M ai n clini cal an d b ioche m ic al char ac ter ist ics o f p atie nts w ith ce rebe lla r at axia and ele v at ed cer ebr o spi n al fr ee sial ic ac id Patients A taxia onset/ last exa m H ear ing los s V is io n los s
Cognitive/ psychiatric symptoms Pyramidal syndrome Neuropathy O thers 5- MT HF in C S F R espons e to fo li ni c ac id tr ea tm en t Musc le biopsy Caus al gene P reviou sly pub lis hed C AFS A pat ien ts A 22/24 years + (child hood) OA Mental re ta rdat ion + A xonal (M) Short stature ↓↓ +N ? B 44/46 years + (child hood) Cataract Mental re ta rdat ion + – Pseudo -strokes ↓↓ ++ M u lti ple mtDN A de le tion ? C 24/36 years –– Cognitive dec line – Axonal (S) Epilepsy Dyston ia Mil d re na l dysfunction NN A N P O L G D 20/38 years –– Beh avioral symptoms – Axonal (S) – NN A N D P O L G E 20/37 years + OA RD ca tar ac t Beh avioral symptoms – Axonal (M) PEO ↓↓ -. but low dose tr ea tm en t N? N ewl y iden tif ie d pati ent s w it h ce rebe llar at axi a and el ev ated ce re br ospi nal fr ee sial ic aci d F 41/44 years –– – – – Pal ata l tre mor Mil d P EO NN A N D P O L G G 18/30 years –– Psychosis + A xonal (M) – ↓↓ ++ ND ? H 42/56 years + OA Cognitive dec line + D em ye lina ting (S M) M ild li ve r dysfunction ND NA N ? FF 9 35/43 years + RD Cognitive dec line –– Short stature PEO Hea rt b lo ck ↓↓ ND ND K S S OA: optic atrophy; R D : retinal dystrophy; M: motor; S: sensory ; PEO: ptosis-externa l ophthalmop legia; 5-MTHF: 5-m ethyltetrahydrofolate; mtDNA: mitochondrial DNA; K SS : K earn s-Sayre syndrome; N: normal; NA: not applicable; N D: not done
(20–44 years), and was associated with peripheral neuropathy, audition and/or vision loss, and cognitive/psychiatric symp-toms. The additional occurrence of pseudo-strokes, ptosis-ophthalmoplegia and renal dysfunction in some patients was even more suggestive of a mitochondrial dysfunction. Nonetheless, muscle histopathology was normal and only one patient (patient B) displayed multiple mitochondrial DNA deletions on muscle biopsy. Mitochondrial DNA point mutations were excluded in all patients as well asPOLG mu-tations in patient B. Besides sialic acid, we measured 5-methyltetrahydrofolate (5-MTHF) concentrations in patient’s CSF (Perry et al2009) and found a striking decrease in three of them. Importantly, two patients were markedly improved with folinic acid supplementation in terms of gait and ambu-lation, while the third patient did not show overt benefit, but only received low dose folinic acid.
Whole exome sequencing
Exome sequencing was undertaken in the three sporadic pa-tients (subjects A, B, E) and two affected sisters (subjects C and D) under the assumption that these patients had a disorder with autosomal recessive inheritance. Filtering of rare, possi-bly deleterious variants in the homozygous state in both sisters revealed variants in 11 different genes, including a known pathogenic mutation inPOLG (NM_002693.2:c.2243G > C, p.(Trp748Ser)), which was further confirmed by Sanger se-quencing in both individuals. There was no gene with at least two heterozygous variants common to both sisters. None of these three sporadic patients had variants inPOLG—which we previously excluded in patient B—or in genes involved in mitochondrial DNA maintenance such asTwinkle.
For the three sporadic patients (A, B, and E), special atten-tion was given to genes encoding for proteins involved in sialic acid or folate metabolism, but that was inconclusive. Filtering of rare, possibly deleterious homozygous variants in individual A, who had consanguineous parents revealed 31 variants in 29 genes and ten variants on chromosome X. Analysis of individ-ual B and E identified 15 and 24 in 11 and 18 autosomal genes, respectively, and five and six genes with at least two variants. Venn diagram showed six genes with variants in all three indi-viduals:FAM153B, RGPD5, RGPD8, PRAMEF11, OR11H1, OR11H2 (eFigurein the Supplementary material). However, all variants proved to be polymorphisms, with frequency below our threshold but relatively frequent in control populations (ExAC database), in genes tolerant to variations. Hence, this approach did not permit identification of the causative variants in the sporadic cases, suggesting that CAFSA is genetically heterogeneous.
Since two out the five CAFSA patients ended up bearing mutations inPOLG, we wanted to assess whether free sialic acid was elevated in other patients with known mutations in POLG. We were able to retrieve the CSF of one such patient
and found a significant elevation of free sialic acid in her CSF (38μM). This patient’s clinical presentation is summarized in Table1(lower panel, patient F).
MS-based metabolomics
Detection of CSF metabolites The LC-HRMS based analysis of CSF metabolome was previously performed in our labora-tory by combining reverse phase and hydrophilic interaction liquid chromatography. This led to the identification of 122 metabolites (Weiss et al2016). Here, metabolite detection was achieved using reverse phase chromatography, and 89 metab-olites, whose analytical information and identification status are displayed in eTable1in the Supplementary material, were selected from data processing steps (see eMethod in the Supplementary material). The detected CSF metabolome was composed of 37% amino acids and derivatives. Other detected species were peptides, acylcarnitines, carboxylic acids and derivatives, and nucleosides and nucleotidic bases. The CSF metabotype of CAFSA patients and identification of additional patients with cerebellar ataxia and elevated cere-brospinal free sialic acid The CSF metabotype of the two CAFSA patients (A and B) revealed that, in addition to in-creased sialic acid concentrations by a factor of 4 to 5, they also exhibited many other abnormally elevated metabolite concentrations, including sugar derivatives, such as hexosamine (putatively glucosamine, acetyl-galactosamine or acetyl-mannosamine), deoxyribose, xylonic acids, and isomers, threonic/erythronic acids, and adonitol/xy-litol, acylcarnitines, acetylated compounds (many amino acids) and other metabolites, such as N-ribosylhistidine and succinyladenosine (Table2and eTable3in the Supplementary material), the latter being known to accumulate in patients with adenylosuccinate lyase deficiency. In addition, among the 134 individuals analyzed by MS-based metabolomics, this metabotype was very similar to that of two other patients (G and H), including increased free sialic acid concentrations. In patient G, targeted MS analysis confirmed very high levels of free sialic acid (78μM). The clinical characteristics of patients G and H are reported in Table1(lower panel). Besides cere-bellar ataxia, these two patients also presented with peripheral neuropathy and cognitive/psychiatric symptoms. Patient H manifested with vision loss due to optic atrophy and mild liver dysfunction, evocative of a mitochondrial dysfunction, but his muscle biopsy and mitochondrial DNA analyses were normal. Exome sequencing had also been performed in patient H, as part of a research project on patients with a suspected mito-chondrial dysfunction (Fondation Maladies Rares, principal investigator: Claude Jardel), but failed to identify any causal mutation. Furthermore, 5-MTHF concentration was measured in the CSF of patient G and was extremely low. Similar to
patients A and B, the motor functions of patient G responded very well to folinic acid supplementation.
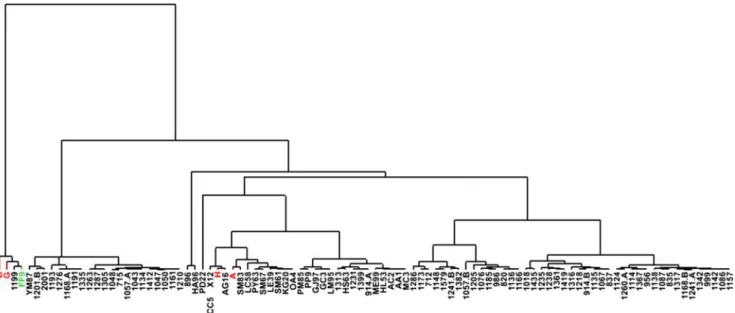
Interestingly, hierarchical clustering analyses performed on the 95 patients with unexplained encephalopathies plus CAFSA patients A and B showed that patients B and G clus-tered with patient FF9, who was diagnosed with Kearns-Sayre syndrome (Fig.1). Targeted MS analysis confirmed that free sialic acid was significantly elevated in this patient with Kearns-Sayre syndrome (60μM). In addition, patients A and H were grouped in another cluster. Metabolic abnormal-ities were more pronounced in patients B, G, and FF9 (Table 2), than in patients A and H who mainly exhibited increased concentrations of sugar derivatives and acylcarnitines (Table2).
Mapping of the CAFSA metabotype in the context of human genome scale metabolic network CSF metabotype is not nec-essarily the outcome of the modulation of a single metabolic pathway. Several, potentially disconnected, metabolic pro-cesses may be leading to metabolite concentration changes in the CSF. To test this hypothesis, metabolites of the CSF metabotype were then positioned in a reconstruction of the human metabolic network (Recon2), containing thousands of metabolites and reactions (Thiele et al2013), in order to know if they were located in the sameBarea^ of the network; thus, taking place in the same metabolic processes, and also if they could be closely linked to sialic acid and/or folic acid metabolism. Forty-one out of the 89 metabolites considered for this study were found in the Recon2 network (eTable2in the Supplementary material). Folic acid, which was not de-tected in our experimental conditions, was added to the list to decipher its connection to the rest of the metabotype.
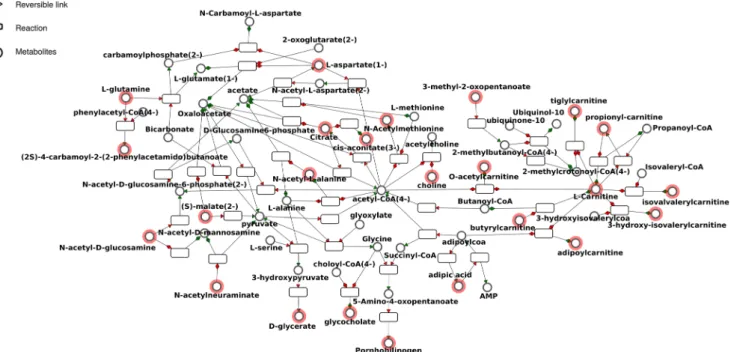
To formally evaluate closeness in terms of metabolism be-tween the elements of the metabotype, a distance analysis was first performed. Two metabolites were considered close if few biochemical reactions were required to transform one into the other, and far away if it required several reactions (Frainay and Jourdan 2017). Accordingly, a distance matrix was built where rows and columns were classified using hierarchical clustering and color of cells corresponded to short distances (red) to long distances (light yellow) between two metabolites (Fig.2). Likewise, we observed a core cluster (black) contain-ing mainly sub-clusters of carnitines and acetylated com-pounds and citrate. The sub-network corresponding to this black cluster (Fig. 3) highlighted the proximity of the metabotype with acetyl-CoA and carnitine, two key metabo-lites regulating mitochondrial energy homeostasis. A periph-eral cluster (blue) containing sub-clusters of aromatic amino-acids, nucleosides, and puric bases was also observed (Fig.2). Folic acid was far from most other detected CSF metabolites, and sialic acid was only connected to acetyl-hexosamine (i.e., putatively acetyl-glucosamine, acetyl-galactosamine or ace-tyl-mannosamine) (Fig.3).
Discussion
Using a combination of targeted and untargeted genetic and metabolomics analyses, we were able to further delineate the underlying causes of CAFSA. Two patients harbored muta-tions inPOLG and we showed in the CSF of a third POLG-mutated patient that free sialic acid was indeed elevated. In addition, MS-based metabolomics led to the identification of three additional patients with cerebellar ataxia and elevated
Fig. 1 Hierarchical clustering analyses performed on patients with CAFSA and patients with unexplained encephalopathies. Eighty-nine metabolites were taken into account. Chromatographic peak areas of
these metabolites were first mean-centered and scaled to unit variance before performing hierarchical clustering analysis using SIMCA-P12 software (Umetrics, Umea, Sweden)
Table 2 CSF metabotype from four CAFSA patients and one patient with Kearns-Sayre syndrome, belonging to the same clusters
Patient ID G a B a A b H b FF9 b
Name Chemical taxonomy c CAFSA CAFSA CAFSA CAFSA KSS
Carnitine Carnitines 1.94 1.03 1.61 1.08 0.71 Acetylcarnitine NC 2.04 1.37 1.74 1.66 1.59 Propionylcarnitine Acylcarnitines 1.75 1.00 1.33 1.67 1.15 Butyrylcarnitine / Isobutyrylcarnitine Acylcarnitines 1.79 0.94 1.46 1.38 4.66 2-ethylacrylylcarnitine / Tiglylcarnitine Acylcarnitines 1.61 2.69 0.93 1.85 3.24 2-methylbutyroyl-/ valeryl-/isovalerylcarnitine Acylcarnitines 1.59 1.05 2.15 1.40 2.79 3-hydroxyisovalerylcarnitine Acylcarnitines 1.29 1.27 0.67 1.16 1.69
3-methyl-2-oxovaleric acid Keto-acids & derivatives 1.56 0.68 0.41 1.24 1.60
4-methyl-2-oxovaleric acid
(ketoleucine) Keto-acids & derivatives 1.86 0.50 0.37 0.94 1.59
Stachydrine (proline-betaine) Carb. acids & derivatives 3.68 0.14 2.61 2.93 0.02
Malic acid Dicarb. acids & derivatives 0.64 1.25 0.67 1.32 1.13
Cis-aconitic acid Tricarb. acids & derivatives 1.82 1.93 1.74 2.05 1.09
Citric acid Tricarb. acids & derivatives 1.46 0.93 1.12 1.37 1.17
N2-succinyl-glutamic acid
5-semialdehyde N-acyl-alpha-amino acids 2.18 2.63 1.35 1.80 2.08
Acetyl-glycine N-acyl-alpha-amino acids 0.55 0.85 0.33 0.37 0.95
Acetyl-alanine N-acyl-alpha-amino acids 0.78 1.63 0.22 1.31 1.33
Acetyl-serine N-acyl-alpha-amino acids 1.63 3.18 0.61 1.32 2.22
Acetyl-valine or
acetyl-norvaline N-acyl-alpha-amino acids 0.96 1.45 0.38 1.04 1.56
N-acetyl-methionine N-acyl-alpha-amino acids 0.52 5.49 0.00 0.77 2.09
N-acetyl-phenylalanine N-acyl-alpha-amino acids 0.23 0.69 0.33 0.28 0.66
Phenylacetyl-glutamine N-acyl-alpha-amino acids 0.49 1.00 0.27 1.03 0.57
Leucyl-alanine Dipeptides 4.45 3.79 0.96 1.43 1.53
Prolyl-hydroxyproline Dipeptides 0.85 1.15 0.53 0.74 1.00
Leucyl-proline Dipeptides 3.12 3.64 1.64 1.29 3.25
Leucyl-aspartic acid Dipeptides 1.39 1.66 0.71 1.35 1.50
Acetyl-aspartylglutamic acid Dipeptides 2.14 2.75 0.86 0.48 1.01
Quinic acid NC 0.88 4.97 0.05 0.94 0.66
Dehydroquinic acid Cyclitols & derivatives 3.93 3.01 2.08 1.41 1.82
Anhydro-sorbitol Monosaccharides 1.26 0.69 1.38 0.32 0.59
Acetyl-hexosamine* Acylaminosugars 2.33 2.62 2.36 1.63 2.29
Deoxyribose Pentoses 4.18 8.74 1.95 1.97 7.89
Methylthioribose Pentoses 0.55 2.24 0.22 0.57 0.95
Xylonic acid or isomers Sugar acids 3.74 4.17 2.82 1.78 4.12
Threonic acid /Erythronic acid Sugar acids & derivatives 2.48 2.14 2.32 1.48 1.71
Glyceric acid Sugar acids & derivatives 1.24 1.23 0.80 1.87 1.20
Adonitol /Xylitol Sugar alcohols 3.34 4.27 2.57 1.37 3.14
Mannitol Sugar alcohols 2.20 2.16 0.95 1.05 1.61
N-acetylneuraminic acid N-acylneuraminic acids 5.19 5.06 3.96 1.50 3.89
KSS: Kearns-Sayre syndrome; UK: unknown; Carb.: carboxylic; a: mean values from three experiments; b: Values from one experiment; c: From HMDB; NC: Not classified; yellow: value > mean + 1SD; orange: value > mean + 2SD; red: value > mean + 3SD; *putatively acetyl-glucosamine, acetyl-galactosamine, or acetyl-mannosamine
cerebrospinal free sialic acid, including one patient with Kearns-Sayre syndrome. MS-based metabolomics also showed the implication of additional metabolites related to mitochondrial energy homeostasis, specifically acetyl-CoA and carnitine. Furthermore, 5-MTHF was extremely low in the CSF of the three initial CAFSA patients that were tested as well as in two novel patients with cerebellar ataxia and elevated cerebrospinal free sialic acid, including the patient with Kearns-Sayre syndrome as previously de-scribed (Quijada-Fraile et al 2014), but was normal in POLG-mutated patients. Although we did not evidence any mutation in other genes involved in mitochondrial DNA maintenance thanPOLG, one patient displayed mul-tiple mitochondrial DNA deletions. Altogether, our genetic and metabolomics analyses suggest that CAFSA is related to mitochondrial DNA alterations either through POLG mutations or a mechanism similar to what is observed in Kearns-Sayre syndrome.
Back in 2009, we suspected that CAFSA was geneti-cally heterogeneous, which we confirmed in the present study. Although our exome analysis was driven by meta-bolic hypotheses on sialic acid, folate, and mitochondrial
metabolism, it was only successful in two siblings out of six patients, which emphasizes the complexity of next generation sequencing when parents’ DNA is not avail-able. Still, targeted and untargeted metabolic approaches using MS allowed us to expand our characterization of CAFSA taking advantage of the increased sensitivity of MS technology compared to NMRS. First, hierarchical clustering analysis performed on metabolomic data showed that non POLG-mutated CAFSA patients belonged to two distinct clusters (Fig. 1), emphasizing the heterogeneity of this entity. Main concentration vari-ations observed in the CAFSA metabotype were related to sugar derivatives, acylcarnitines, carboxylic acid deriv-atives, acetylated amino acids, and dipeptides. Sugar de-rivatives are of special interest since their concentrations were dramatically modified in the two clusters. Notably, acetyl-hexosamines (i.e., putatively acetyl-glucosamine, acetyl-galactosamine or acetyl-mannosamine), whose levels were increased in CAFSA patients, are direct pre-cursors of acetyl-neuraminic acid, also called sialic acid. Such findings would need to be confirmed by an alterna-tive analytical method enabling the discrimination
Fig. 2 Distance matrix on the entire fingerprint. Each cell of the matrix is colored according to distance between the two corresponding entries, from red (distance = 0 to white distance = 9). We observed a core cluster
(black) containing mainly sub-clusters of carnitines and acetylated compounds and citrate and a peripheral cluster (blue) containing sub-clusters of aromatic amino-acids, nucleosides, and puric bases
between isomers. Second, we identified 5-MTHF defi-ciency as an additional CSF biomarker in these patients with high free sialic acid but noPOLG mutations. Third, in non POLG-mutated patients, we discovered a larger common metabotype pointing to alterations of mitochon-drial energy homeostasis and resembling that of a patient with Kearns-Sayre syndrome. Therefore, even if our ef-forts were only partially successful at elucidating CAFSA, we advocate the combination of next generation sequencing with advanced metabolomics to expand our understanding of complex neurodevelopmental and/or neurodegenerative entities. Recently, such an approach elegantly proved to also be successful in identifying nov-el inborn errors of metabolism (Tarailo-Graovac et al
2016).
Mitochondrial diseases remain the largest and most heterogeneous entities among inborn errors of metabolism due to the large number of nuclear genes encoding mito-chondrial proteins, as well as the additional contribution of the mitochondrial DNA. Lactate is a well-known bio-marker of mitochondrial dysfunction, and others have been suggested recently, such as creatine, FGF21, and GDH15. 5-MTHF deficiency has been described mainly in patients with Kearns-Sayre syndrome (Quijada-Fraile et al 2014) and recent studies showed that mitochondrial DNA replication defects remodel one-carbon metabolism, which involves folate, through altered dNTP pools
(Nikkanen et al 2016). As exemplified by our patients, 5-MTHF deficiency shall be looked for in the CSF of patients suspected of mitochondrial diseases since supple-mentation with folinic acid, in sufficient amount, may greatly improve their motor functions. Conversely, the elevation of free sialic acid in CAFSA patients remains perplexing as there is no clear link between sialic acid and mitochondrial metabolism. In our initial NMRS-based metabolomics study, sialic acid was measured in several patients with known mitochondrial defects but was nor-mal (Mochel et al 2009). Therefore, increased CSF free sialic acid may point to a subset of mitochondrial diseases involving mitochondrial DNA. It also remains to be de-termined whether free sialic acid can be a reliable bio-marker of POLG mutations and/or Kearns-Sayre syndrome.
Details of funding This study was supported by a grant from the French Ministry of Health (PHRC SPECTMET-II, ID RCB 2010-A01395–34). The authors confirm independence from the sponsors.
Compliance with ethical standards
Conflict of interest Maria del Mar Amador, Benoit Colsch, Foudil
Lamari, Claude Jardel, Farid Ichou, Agnès Rastetter, Emmanuel Roze, Ronald Wevers, Christel Depienne, Christophe Junot, and Fanny Mochel declare that they have no conflict of interest.
Frédéric Sedel is the CEO of MedDay Pharmaceuticals. Fig. 3 Sub-network corresponding to the black cluster built from the
distance matrix by keeping only the shortest paths between metabolites belonging to the cluster, and displayed using the MetExplore web server
(see thePatients and methodssection for additional information). Red
circled nodes are the ones belonging to fingerprint. The nomenclature used for metabolite identification, which mentions the enantiomer infor-mation, is that of Recon2
Animal rights This article does not contain any studies with animal subjects performed by the any of the authors.
References
Boudah S, Olivier M-F, Aros-Calt S et al (2014) Annotation of the human serum metabolome by coupling three liquid chromatography methods to high-resolution mass spectrometry. J Chromatogr B
Analyt Technol Biomed Life Sci 966:34–47
Cottret L, Wildridge D, Vinson F et al (2010) MetExplore: a web server to link metabolomic experiments and genome-scale metabolic
net-works. Nucleic Acids Res 38:W132–W137
Frainay C, Jourdan F (2017) Computational methods to identify metabolic
sub-networks based on metabolomic profiles. Brief Bioinform 18:43–56
Li H, Durbin R (2010) Fast and accurate long-read alignment with
bur-rows–wheeler transform. Bioinformatics 26:589–595
Li H, Handsaker B, Wysoker A et al (2009) The sequence alignment/map
format and SAMtools. Bioinformatics 25:2078–2079
Mochel F, Sedel F, Vanderver A et al (2009) Cerebellar ataxia with
ele-vated cerebrospinal free sialic acid (CAFSA). Brain 132:801–809
Nikkanen J, Forsström S, Euro L et al (2016) Mitochondrial DNA repli-cation defects disturb cellular dNTP pools and remodel one-carbon
metabolism. Cell Metab 23:635–648
Perry M, Li Q, Kennedy RT (2009) Review of recent advances in ana-lytical techniques for the determination of neurotransmitters. Anal
Chim Acta 653:1–22
Quijada-Fraile P, O’Callaghan M, Martín-Hernández E et al (2014)
Follow-up of folinic acid supplementation for patients with cerebral folate deficiency and Kearns-Sayre syndrome. Orphanet J Rare Dis
9:217–225
Rahman SA, Torrance G, Baldacci L et al (2016) Reaction decoder tool (RDT): extracting features from chemical reactions. Bioinformatics
32:2065–2066
Roux A, Xu Y, Heilier J-F et al (2012) Annotation of the human adult urinary metabolome and metabolite identification using ultra high performance liquid chromatography coupled to a linear quadrupole
ion trap-orbitrap mass spectrometer. Anal Chem 84:6429–6437
Smith CA, Want EJ, O’Maille G et al (2006) XCMS: processing mass
spectrometry data for metabolite profiling using nonlinear peak
alignment, matching, and identification. Anal Chem 78:779–787
Tarailo-Graovac M, Shyr C, Ross CJ et al (2016) Exome sequencing and the management of neurometabolic disorders. N Engl J Med 374: 2246–2255
Thiele I, Swainston N, Fleming RM et al (2013) A community-driven global reconstruction of human metabolism. Nat Biotechnol 31:
419–425
van der Ham M, Prinsen BH, Huijmans JG et al (2007) Quantification of free and total sialic acid excretion by LC-MS/MS. J Chromatogr B Analyt Technol Biomed Life Sci 848:251–257
Weiss N, Saint Hilaire PB, Colsch B et al (2016) Cerebrospinal fluid metabolomics highlights dysregulation of energy metabolism in