Hartnett 1
Analyzing the Feasibility of Lithium-Ion Batteries to Reduce Carbon Dioxide Emissions in Maritime Shipping
By Luke Hartnett
Submitted to the
Department of Mechanical Engineering
in Partial Fulfillment of the Requirements for the Degree of Bachelor of Science
at the
Massachusetts Institute of Technology May 2020
© 2020 Luke Hartnett All rights reserved
The author hereby grants to MIT permission to reproduce and to
distribute publicly paper and electronic copies of this thesis document in whole or in part in any medium now known or hereafter created.
Signature of Author:... Department of Mechanical Engineering
May 8, 2020 Certified by:... Betar Gallant Assistant Professor Thesis Supervisor Accepted by:... Maria Yang Professor of Mechanical Engineering
Hartnett 2
Analyzing the Feasibility of Lithium-Ion Batteries to Reduce Carbon Dioxide Emissions in Maritime Shipping
By Luke Hartnett
Submitted to the Department of Mechanical Engineering On May 8, 2020 in Partial Fulfillment of the Requirements for the Degree of Bachelor of Science in
Mechanical Engineering
ABSTRACT
The International Maritime Organization aims to reduce CO2 emissions in the shipping
industry by 50% by 2050. One of the methods for meeting this goal is to electrify ships with lithium-ion batteries. A 14-ship sample was analyzed to determine the feasibility of installing lithium-ion batteries onto modern-day vessels. The two feasibility constraints that guided this discussion were mass and volume of the necessary battery system. Results show that the mass of the battery pack was well within the current mass of engine rooms, but the volume required was often too high. In order to compensate for this, an increase in the estimate of energy density improved the number of trips made possible by lithium-ion batteries. When coupled with increases in depth of discharge and the volume available for the system in the engine room, 11 out of 14 vessels could complete at least one trip with one charge of the battery. This corresponded to about 48% of the total miles travelled by all 14 ships. Hybrid vessels could be deployed to test out the technology, but eventually moving to lithium-ion battery technology could come close to reducing emissions by 50% under the right parameters.
Thesis Supervisor: Betar Gallant Title: Associate Professor
Hartnett 3 Table of Contents
1. Introduction 5
1.1 IMO Regulations……… 5
1.2 Introduction to Lithium-Ion Batteries……… 7
1.3 More Electric Aircraft Discussion……….. 11
2. Methods & Calculations 13
2.1 Introduction to Vessels Sample……….. 13
2.2 Mass and Volume Calculations……….. 15
3. Data Analysis 17
3.1 Initial Findings……….... 17
3.2 Depth of Discharge Analysis……….. 18
3.3 Available Volume Analysis……… 20
3.4 Energy Density Analysis……… 21
3.5 Mileage Analysis……… 26
3.6 Combined Variable Analysis………. 27
4. Conclusion 29
Hartnett 4 Acknowledgements
There is only one person that needs to be thanked, and that person is Dr. Betar Gallant for exceeding the expectations of a supervisor from start to finish. Thank you for introducing this subject to me as a potential undergraduate thesis project. Especially in the midst of such an unusual semester, thank you for your calm and guidance throughout.
Hartnett 5
Introduction
1.1 IMO Regulations
As global temperatures have been on the rise over the last few decades, the scientific world is looking into different options to reduce carbon dioxide (CO2) emissions. Many industries have
already seen technical innovations and regulations motivated by reducing emissions. While most people are familiar with electric vehicles like Tesla, or cap and trade policies being exercised in other countries, one industry that does not receive as much attention is that of maritime shipping. However, the International Maritime Organization (IMO) has placed multiple regulations on emissions in the shipping industry.
In fact, there have been urgent restrictions on the amount of sulfur oxides emitted from ships. The IMO has mandated that the concentration of sulfur in crude oil must be reduced from 3.5% to 0.5% by January 1st, 2020 [1]. According to the IMO, human health is a concern with sulfur oxides, as they cause respiratory issues as well as lung disease. Luckily for some vessels, they have already instituted sulfur oxide scrubbers to remove any sulfur oxide from their emissions. They can continue to combust the same crude oil because their sulfur oxide emissions are roughly zero. For vessels without these scrubbers, they have a few options. Some have decided to use different fuels, such as liquified natural gas and biofuels. Provided in reference one, the IMO has suggested that refineries offer these vessels the option to blend the sulfur-dense crude oil with other compliant fuels in order to decrease the sulfur concentration.
As mentioned previously, the IMO is the governing body that writes and enforces these regulations. Established by the United Nations in the mid-20th century, the IMO provides a
Hartnett 6
regulatory framework for the international shipping industry in order to ensure safety, security, and environmental progress [2]. While the recent sulfur oxide regulations are not directly aiming to fight against climate change, the IMO has set its sights on tackling this issue. The IMO has stated that they “fully support” the strategies developed at the Paris Climate Agreement. Specifically, the plan is to reduce CO2 emissions by 50% by 2050 compared to 2008 levels [3].
This plan was further fleshed out in April of 2018 when the IMO’s Marine Environment Protection Committee (MEPC) developed an initial strategy to cut down on emissions. Different sections of the report include short-term, mid-term, and long-term measures to reduce greenhouse gas emissions. For most of the report the emissions are referring to greenhouse gases in general without specifically mentioning CO2. However, CO2 emissions make up 65% of greenhouse gas emissions
as can be seen in the figure below from the EPA.
Hartnett 7
Most of these measures, whether short or long-term, are not concrete, direct actions to be taken. For example, one of the short-term measures is to “actively promote the work of the Organization to the international community…to highlight that the Organization…has developed and adopted technical and operational measures that have consistently provided a reduction of air emissions from ships”. Most of the short and mid-term measures are similar to this in scope; perform data analysis, develop new energy efficiency standards, increase communication, etc. From reference five, one of the two long-term measures is to “pursue the development of zero carbon or fossil free fuels” [5].
1.2 Introduction to Lithium-Ion Batteries
This pursuit of zero carbo fuels requires some clarification. It is not enough to convert their fuels to be cleaner and eliminate emissions through the use of batteries or hydrogen fuel cells. These systems also need to be powered by an emission-less electricity grid. The issue here is that using batteries that are charged by electricity generated from power plants continues to indirectly contribute to CO2 emissions. While ships may meet the regulations imposed, the global issue of
reducing CO2 emissions would not be addressed. An emission-less electricity grid is not available
yet. Until that is possible, the shipping industry can do their best by taking the first step in the right direction by pursuing more green systems that will at least reduce carbon dioxide emissions on their end. One such technology that has been pursued in other industries with success is that of batteries. Lithium-ion batteries are some of the highest performing, most energy dense batteries today that have been used in smartphones as well as electric vehicles. Storing electric energy in batteries is a popular method of reducing CO2 emissions. A brief overview of how these batteries
work is important in understanding how they can be used in the shipping industry, as well as their limitations.
Hartnett 8
A battery in its simplest form is a chemical system that takes advantage of the electric potential difference between two metals. The energy that comes from the process is in the flow of electrons due to an oxidation-reduction reaction. One metal, the anode, is at a higher electric potential than the other, which causes that metal to lose electrons as they move towards the other metal, the cathode. The receiving metal is reduced as it picks up this negative charge. In lithium-ion batteries, the lithium-lithium-ions flow from the anode to the cathode through something called the separator. During charging, the reverse reaction takes place [6].
Figure 2: Lithium-Ion Battery Discharging. Diagram obtain from “Nobel prize for chemistry: the lithium-ion battery” article from the Economist [7].
Hartnett 9
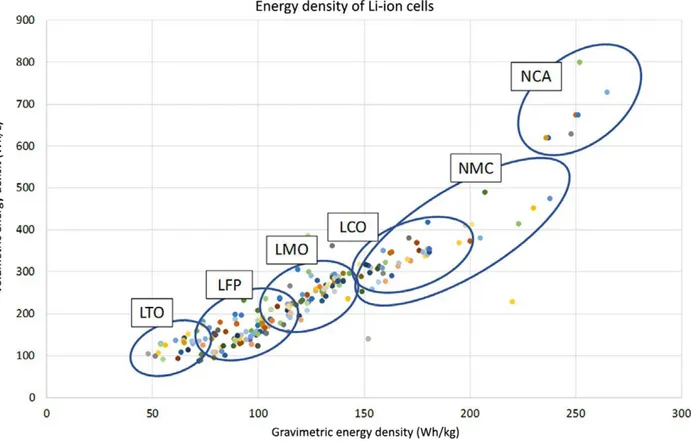
According to John Warner’s book titled Lithium-Ion Battery Chemistries, reference six, most lithium-ion batteries use a carbon-based anode, typically graphite. As for the cathode, there are many different materials used, but lithium cobalt oxide LiCoO2 is most common. A comparison
of energy density, here referred to as volumetric energy, and specific energy, or gravimetric energy, is shown below in figure three.
Figure 3: Specific Energy & Energy Density for Li-Ion Batteries with Different Cathodes. Figure obtained from reference six, Warner’s book on lithium-ion batteries.
There are different quantities associated with battery performance, some of which will be analyzed with respect to shipping. One of the most important issues with battery technology comes from the size of the batteries. Specifically, how much energy can be stored in a particular mass
Hartnett 10
and or a particular volume. The term “energy density” is often used for both mass and volume considerations. Moving forward, a clear distinction must be made between the two. The amount of energy a battery can store in a given volume will be defined as the energy density. Specific energy will be defined as the amount of energy stored in a given mass for a battery. Both of these quantities are essential when analyzing the feasibility of a battery system given the energy required for that system to operate. Another important characteristic of a battery is the depth of discharge. This quantity refers to the fraction of the total battery capacity that is actually being used. When performing data analysis on the capacity required for lithium-ion batteries, this will be an important number to recall. Another important distinction is that, of course, these systems do not use only one battery. Battery cells are arranged together to form a module, and these modules are then put together to form a battery pack. In the analysis moving forward, characteristics of the battery pack, or sometimes referred to as a system, will be used.
Battery systems have been used in many everyday applications, but of course, lithium-ion technology has significantly expanded the scope of battery use. Gianfranco Pistoia’s book,
Lithium-Ion Batteries: Advances and Applications, reviews the history of lithium-ion batteries.
The need for these batteries grew in the technical revolution as computers, cell phones, cameras and other devices were innovating at a fast rate. However, the battery technology that existed at the time was not sufficient to meet the energetic demands of these new products. Batteries needed to be smaller as these devices were shrinking. Lithium-ion batteries came onto the scene in the 1980’s, finally reaching commercialization in the early 1990’s. These batteries offered higher energy densities, which allowed them to be used in smaller devices [8]. This has become a crucial requirement over the last decade as lithium ion batteries have moved to the forefront of electric vehicle use.
Hartnett 11 1.3 More Electric Aircraft Discussion
While lithium ion batteries have made it possible to drive electric vehicles on the ground, there has been research done to investigate the technology in other transportation systems. Rosero et al. describe the idea of the “More Electric Aircraft” or MEA concept in their article, “Moving towards a more electric aircraft”. They explain that airlines have a set of different energy sources for their operation. Of course, the most well-known being the jet engine used to provide thrust. However, there are other power systems on the plane to run applications
including in-flight entertainment, lighting, communication systems, etc. There are four main categories for these systems: mechanical, electrical, pneumatic, and hydraulic. MEA concepts try to convert more of these into electrical systems. Outside of reducing CO2 emissions, there are
other benefits from MEA. By eliminating the need for mechanical and hydraulic systems, the plane can reduce weight. Without pneumatic systems, the gas turbine need not bleed air, which increases the energy efficiency of the system [9].
Most MEA ideas revolve around increasing energy efficiency and reducing CO2 emissions.
Completely converting airplanes to become all-electric is a bit more ambitious. There are some current aircrafts that are fully-electric, but they are for short-range trips, and are not widely available to the general public. For example, there is a startup company in Israel that has developed, Alice, the all-electric aircraft.
Hartnett 12
\
Figure 4: Alice, the all-electric aircraft. Image obtained by Alan Pierce’s article, “Alice the All-Electric Commercial Airplane” [10].
The company is called Eviation, and according to Pierce’s article, Alice can fly for 621 nautical miles (714 miles) at a speed of 240 knots (276 mph) on one charge. After an hour of flying, it takes the plane a half an hour to recharge. The battery pack weighs 7800 pounds, which is more than seven times the weight of a Tesla battery pack. In place of the jet engine is a set of three motors that can be seen in the above figure, as they have propellers attached to them. Eviation says that they are aiming to sell in the United States in the next few years.
Venkat Viswanathan of Carnegie Mellon has done plenty of research into MEA in the past. In their article titled, “Performance Metrics Required of Next-Generation Batteries to Electrify Commercial Aircraft”, Viswanathan et al. have determined that the specific energy is crucial for developing battery technology for aircrafts. Specifically, they found that smaller, regional aircrafts have much smaller specific energy requirements than larger aircrafts (600 Wh/kg-pack vs 820 Wh/kg-pack and 1280 Wh/kg-pack for larger classes of aircrafts). While the size of the plane matters, the distance travelled has more of an effect on these specific energy calculations. Not only do regional aircrafts have lower, more feasible specific energies, but they are also more practical. Larger planes tend to utilize a large fraction of their range, flying for long distances [11].
Hartnett 13
Viswanathan has also put this research into action by teaming up with MIT’s Yet-Ming Chiang. James Temple’s article in the MIT Technology Review titled, “A powerful new battery could give us electric planes that don’t pollute”, showcases their findings. The two have implemented a magnetic field inside of the battery to straighten out the path of the lithium ions through the electrodes. This will speed up the rate of discharge and could give planes the power to liftoff without burning any fuel. They aim to power a plane that could take twelve people 400 miles, a typical flight from San Francisco to Los Angeles [12].
It appears that the all-electric aircraft is on its way but will take some time before it is commercially available at high volumes. The question then becomes, can the same be done with the shipping industry? If not, to what extent does lithium ion battery technology play a role in cutting CO2 emissions in half over the next 30 years in the shipping industry? That question will
guide most of this discussion. The mission henceforth is to determine the feasibility of converting the current fleet of vessels in the international shipping industry to lithium-ion battery-powered electric ships.
Methods & Calculations
2.1 Introduction to Vessels Sample
International shipping encompasses a large quantity of vessels, which makes data analysis difficult. However, John J. Minnehan and Joseph W. Pratt of Sandia National Laboratories published a report titled, “Practical Application Limits of Fuel Cells and Batteries for Zero Emission Vessels” on the feasibility of battery technology for the shipping industry. The ships
Hartnett 14
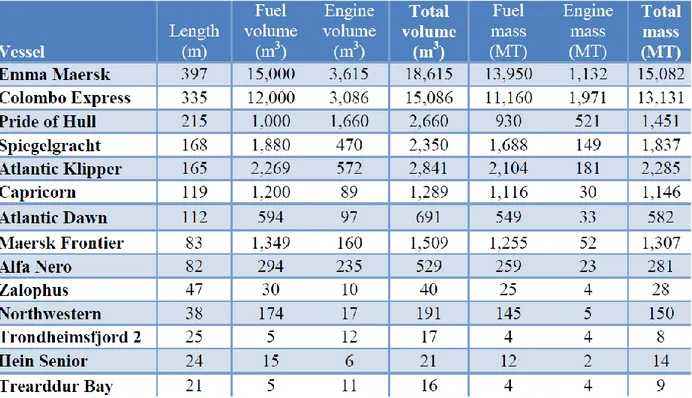
included in the sample are seen below in table one. The vessels are listed in descending order of length to get an idea for the size of the vessels. The Zalophus, Pride of Hull, Trondheimsfjord 2, and Alfa Nero are all passenger ferries and or yachts. The Emma Maersk and Colombo Express are both large container ships. Some are fishing boats like the Hein Senior, and Northwestern. Cargo ships like the Spiegelgracht, Atlantic Klipper, Capricorn, and Atlantic Dawn are included as well. The Maersk Frontier is an offshore supply vessel, and the Trearddur Bay is a service boat for the offshore wind industry [13].
Table 1: Vessel Length, Volume, and Mass Specifications obtained from reference 13, the Sandia report.
The specifications given relate to the size of the engine room in terms of both volume and mass. These two quantities guide the feasibility calculations moving forward. It is important to note that a thorough analysis of feasibility would include a discussion on economics and a consideration of any regulations and restrictions put in place for safety measures. However, that is
Hartnett 15
beyond the scope of this paper. Instead, this analysis focuses on the dimensions of the necessary battery system that would be put in place. Once the energy required for each ship’s voyage has been calculated, the specific energy and energy density are used to determine the required mass and volume of the battery system. These two numbers are then compared to the current available mass and volume of the engine rooms in the vessels. If the mass and volume required are less than the available mass and volume currently on the vessel, then this is counted as one trip the vessel can complete. If a vessel had the necessary mass and volume to complete one trip, the energy required was then doubled to determine if multiple trips could be completed. This process is repeated until the available volume and or mass are not sufficient for the energy demands. It is important to note that simply multiplying the energy for one trip by two does not equate to the energy of a round trip. There is energy spent idling, and there may not be access to recharge at the port. However, this provides a decent approximation to start with, and perhaps more research can further determine the requirements for round trips and recharging.
2.2 Mass and Volume Calculations
The following calculations were obtained from the reference 13, the Sandia report, and then repeated under adjusted parameters for the purposes of this paper. First, the load factor was found by comparing the average speed to the maximum speed reached over the voyage as seen below.
Hartnett 16
This number gives a coefficient that can be multiplied by the power available, which will yield the average amount of power required for the voyage. This quantity, the average shaft power, is calculated in the next step. MCR is the installed engine power for the vessel.
Equation 2: Average Shaft Power Calculation
Using the average shaft power and the total time needed for the voyage the energy required to complete the trip is calculated.
Equation 3: Energy Required Calculation
However, for batteries, this is not the final answer. This is due to the fact that batteries do not operate at full capacity. Depth of discharge is defined as the fraction of the battery capacity that is being used at a given time. Taking this into account results in the capacity of the battery that will be needed for a vessel to complete one voyage. With the capacity, one can calculate the volume and mass required for the battery system by dividing by the energy density and specific energy respectively.
Hartnett 17
Data Analysis
3.1 Initial Findings
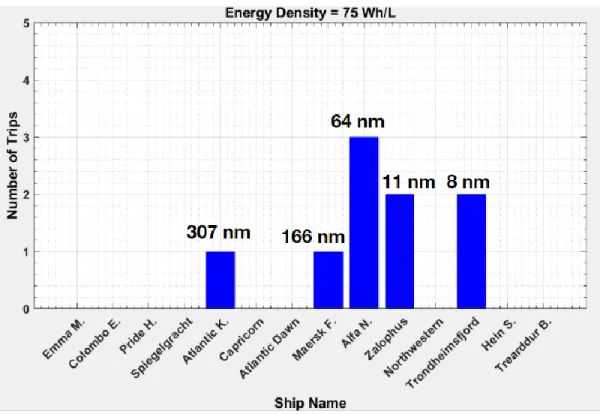
The Sandia report concluded that only five of the fourteen ships analyzed in the study were capable of being battery-operated for at least one trip. Figure five shows the number of trips that can be completed with a battery for each ship using the numbers from the report.
Figure 5: Number of Trips Using Sandia Report Parameters. This figure, as well as many of those that follow, are original data collection completed for this paper, but derived from the calculations made in reference 13, the Sandia report.
Most of the ships are not capable of completing a single voyage given the current mass and volume available in the engine room. For the five ships that can, the voyages are all 307 nautical miles or less. Three of these five ships are passenger ferries, with the other two, Atlantic Klipper and Maersk Frontier, are an offshore supply vessel and a cargo ship respectively. These results are
Hartnett 18
not promising for the 50% CO2 emission reduction by 2050. Less than half of the ships in the
sample can be powered by a battery. However, it is worth looking back on some of the estimates that were used to produce these results. Of course, there are many different variables at play here. Specifications including average speed, engine power, and mass of the engine are more concrete. Assumptions were made, however, when there were no published specifications to go off of.
3.2 Depth of Discharge Analysis
One of the first assumptions made was the depth of discharge, which was set at 50%. This estimate was based on a paper written by Will Ayers of Elliot Bay Design Group titled, “Comparative Payback of Lithium-Ion Batteries for Pacific NW Ferries”. Ayers describes that decreasing depth of discharge improves the overall cycle life of the battery. He estimates that decreasing the depth of discharge from 100% to 50% could lead to three times the original number of cycles [14]. However, according to their specification sheet, some of the PBES batteries, which were included in the data set used in the report, claim to have a depth of discharge closer to 80% [15]. The following analysis was not taken from the Sandia report, but instead was generated for this paper. It took the same numbers from the report and adjusted the depth of discharge to be 100% to get an idea for the best-case scenario.
Hartnett 19 Figure 6: Increased Depth of Discharge to 100%
The blue bars represent the original numbers using 50% depth of discharge, and the green bars represent the additional trips when increased to 100%. No additional vessels were able to complete one voyage. However, the Atlantic Klipper and Maersk Frontier both gained an additional trip. One may think that doubling the depth of discharge would have the same effect on every ship, therefore doubling the number of trips across the board. However, this is not the case. While doubling the depth of discharge does cut each vessel’s required energy in half, the volume available on each ship differs. Therefore, the available volume needs to be high enough for this change in energy to demonstrate a measurable effect. The Atlantic Kipper benefits from having the third highest available volume in the engine room, while only requiring enough energy to travel 307 nautical miles, a fairly average distance compared to the other vessels. The Maersk Frontier benefits from a shorter trip at 166 nautical miles. However, some of the other short trips like the Alfa Nero, Zalophus, and Trondheimsford 2, do not gain an extra trip. While they have a short
Hartnett 20
voyage, the available volume is significantly smaller. For example, the Trondheimsford 2 has an engine room volume of only 17 m3 compared to the Atlantic Klipper, which has 2,350 m3 available. 3.3 Available Volume Analysis
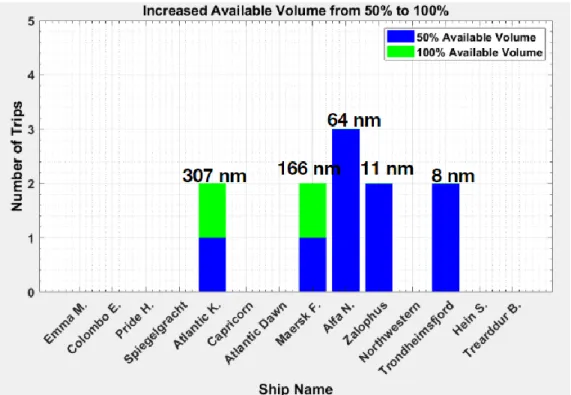
Available volume on board these engine rooms is clearly a key limiting factor in whether or not a ship can complete a voyage with a battery. Adjusting this quantity may have an impact on the results. Minnehan and Pratt made another key assumption when it came to the available volume in the engine room. They mention that most of the engine rooms had more volume than just that of the engine. In fact, the total volume of the room itself is, according to Minnehan and Pratt, “at least five times” higher than the volume of the engine. This is done to meet regulatory standards for safety and maintenance. Battery systems, however, require significantly less clearance than a much larger engine would. Therefore, they assumed that the available volume for a battery system would take up 50% of the engine room’s volume compared to the 20% percent the engines are allowed. If the battery system had the entire engine room volume, it would then be two times higher than the current data given on available volume. Redesigning the engine room is another option that would impact the feasibility of the battery system. However, that is outside the scope of this project. Instead, the available volume data was scaled up by a factor of two, to see how that would impact the results. To clarify, this is not changing the volume required for the battery to provide enough energy for the trip. The available volume that can be met on the ship is what is being changed.
Hartnett 21
Figure 7: How Doubled Available Volume Affects the Number of Trips
After scaling up each vessel’s available volume, not much has changed. Only two vessels were able to complete an additional trip. In fact, they are the same two ships from the depth of discharge analysis: Atlantic Klipper and Maersk Frontier. The volume required for the Maersk Frontier to complete two trips is 1,706.72 m3, which is only 13% larger than the original volume. Doubling the available volume was more than enough to complete the extra trip. Atlantic Klipper also benefits from having the large volume available to begin with for a fairly short trip. However, the other twelve vessels are not benefitting from additional volume.
3.4 Energy Density Analysis
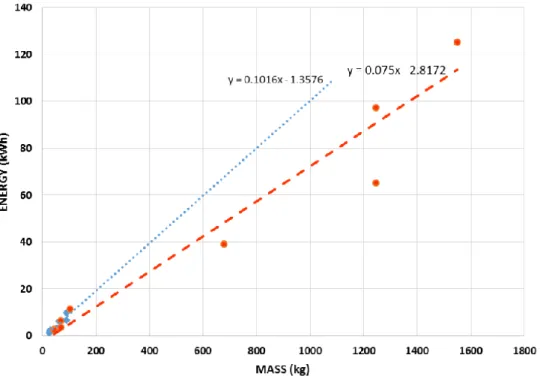
If doubling the volume does not significantly change the results, then perhaps the energy density needs to be adjusted. Sandia used specifications from a set of batteries to obtain an estimate for the energy density as well as the specific energy. The data from each of the batteries were
Hartnett 22
plotted and a line of best fit was found for both the module data as well as the pack or system level data. For this report the system/pack level data was used.
Figure 8: Energy vs. Mass Data to Find Specific Energy from reference 13.
Hartnett 23
It is important to note that the mass consideration for the battery packs is not significant. In fact, each one of the vessels, using the specific energy of 0.075 kWh/kg from the report, had the available mass to complete at least one trip. This is due to the fact that the engines on these vessels are significantly more massive than what would be required for a battery system. The true limiting factor in the calculations has always been the volume of the battery packs. Volume calculations are dependent on the energy density of the system, which was calculated to be 75 Wh/L as seen above in figure nine. However, it appears that there is a cluster of low volume data points that would result in an increased energy density. In fact, the energy density of most lithium-ion batteries is much higher than 75 Wh/L. The Clean Energy Institute at the University of Washington estimates the energy density is actually in the range of 250-670 Wh/L at the cell level [16]. Martin Winter et al. include some useful estimates for energy density at the cell level in an article titled, “Performance and cost of materials for lithium-based rechargeable automotive batteries”.
Hartnett 24
Table 2: Energy Density Estimates for Current Battery Technology. Figure obtained from Winter et al. [17].
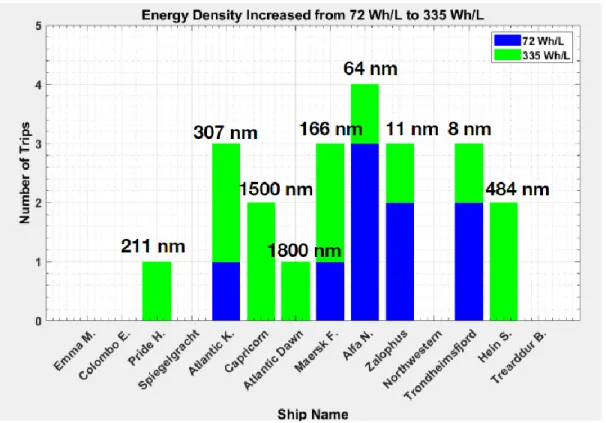
The energy density values mentioned above are referring to the cell level. However, the 72 Wh/L estimated in the Sandia report refers to the pack level. Therefore, in order to incorporate these new estimates for energy density into the data analysis, they must be converted to the pack level. Minnehan and Pratt had energy density estimates for both the system and module levels as seen in figure nine. The ratio of module to system energy density was 1.67. Therefore, a conservative ratio for cell level to pack level was set to 2. Therefore, the highest pack level energy density is 335 Wh/L, which yielded the following results.
Figure 10: How Increased Energy Density Affects the Number of Trips
This demonstrates the importance of the energy density estimation. Nine out of the 15 vessels are now able to complete at least one trip with the increased energy density. Four additional ships are able to complete a trip, with additional trips being made possible for the original five.
Hartnett 25
The mileage per trip for the vessels range from eight to 1800 nautical miles. IMO regulations only require a 50% decrease in CO2 emissions, and this increase in energy density has resulted in 64%
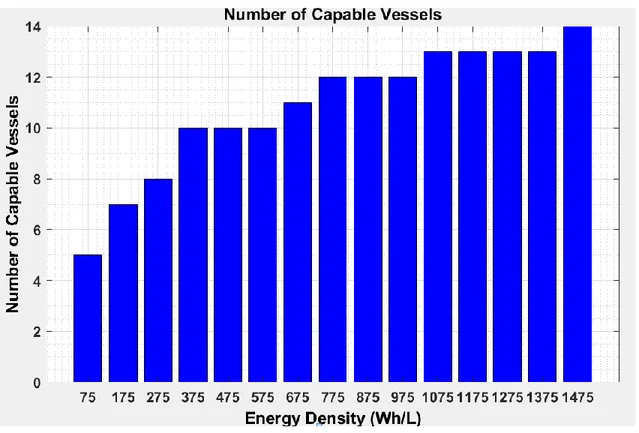
of the vessels in this sample being able to go carbon free. The only vessels that cannot make one trip are the Emma Maersk, Colombo Express, Spiegelgracht, Northwestern and the Trearddur Bay. Four of those give ships travel some of the longest distances in their respective voyages, which creates significantly higher volume constraints. While the Trearddur Bay has a shorter trip at only 51 nautical miles, the volume available in the engine room is the least of the fourteen vessels at just 16 m3. The figure below shows how high the energy density would need to be to incorporate
all fourteen vessels.
Figure 11: Number of Capable Vessels vs. Energy Density
Capable vessels here are defined to be vessels that can complete at least one voyage with a battery. Starting off with 75 Wh/L, close to Sandia’s estimate for energy density, the number of capable vessels is five. At 375 Wh/L, an additional ship is counted from the nine found at 335
Hartnett 26
Wh/L in figure 11. Batteries with energy densities higher than about 400 Wh/L become fairly impractical. It would take a 1475 Wh/L battery to have all fourteen vessels operate with a battery system. According to Mikhaylik et al. in their report, “650 Wh/kg, 1400 Wh/L Rechargeable Batteries for New Era of Electrified Mobility”, Sion Power has claimed that their Licerion batteries can reach up to 1400 Wh/L at the cell level [18]. However, they would experience significant losses in energy density at the pack level.
3.5 Mileage Analysis
While the number of capable vessels gives a good idea for how efficient these batteries need to be, the end goal is not to fully equip every vessel with lithium ion batteries. Reducing CO2
emissions in shipping by 50% is the benchmark, and this can be illustrated by looking at how many miles are being travelled with lithium-ion technology. The mileage fraction is defined to be the fraction of nautical miles travelled by ships that can travel one voyage with a battery divided by the sum of the nautical miles of each ship’s voyage. Since the CO2 emissions scale with the number
of miles travelled, this will give a more accurate idea of how helpful these batteries can be in achieving the 50% reduction goal. Mileage fraction was calculated for each energy density used in figure 12 to create the following plot.
Hartnett 27
Figure 12: Mileage Fraction at Different Energy Densities
Using the initial numbers from the Sandia report, the fraction of total miles needed for all fourteen vessels is below five percent. There is an incremental pattern that emerges where increasing the energy density by about 300 Wh/L produces a jump up to the next mileage fraction where it remains fairly constant until the next 300 Wh/L jump occurs. At the University of Washington’s upper limit of current technology around 335 Wh/L at the pack level, the mileage fraction is about 28%. While figure 11 suggested that about 64% of ships could go carbon free with 335 Wh/L batteries, the remaining 36% of ships have much longer voyages which brings the mileage fraction down to 28%. Therefore, the most energy dense lithium ion batteries, if installed on those ships, would only meet a little over half of the required emission reductions.
3.6 Combined Variable Analysis
Assuming that ships can install lithium-ion batteries with cell level energy densities of 670 Wh/L may not be feasible. These batteries are likely more expensive, and less abundant as they
Hartnett 28
require significant investment, design considerations, and intricate fabrication. Not to mention the safety concerns surrounding flammability explained in further detail by the University of Washington in their report, “Lithium Battery Safety” [19]. Instead, the energy density would likely need to be slightly lower, but still higher than the 75 Wh/L from the Sandia report. Of course, this would not result in an optimistic reduction in CO2 emissions. However, combining an increase in
energy density with an increase in both depth of discharge and available volume might be helpful. Using a lower energy density of 275 Wh/L at the pack level, a depth of discharge increased to 75% (still lower than the 80% reported by PBES), and an available volume that takes up 75% of the engine room space instead of 50%, the following results were generated.
Figure 13: Combined Effect of Depth of Discharge, Available Volume, and Energy Density Two additional vessels are now able to operate with a lithium ion battery: Northwestern and the Colombo Express. The mileage fraction is much more optimistic at 48%, just shy of the 50% reduction needed by 2050. The energy density is within the bounds of current technology. As for depth of discharge, one of the batteries that the Sandia report uses to estimate energy density
Hartnett 29
and specific energy has published their depth of discharge starts above 80%. Therefore, 75% seemed to be a reasonable increase. As for the available volume, the original numbers assumed that half of the engine room was used so there could be room for clearance and maintenance work. As battery systems do not require as much clearance space, it felt safe to increase it while leaving 25% for maintenance.
Conclusion
In order to make the 50% reduction in CO2 emissions by 2050 a reality, there needs to be
a concrete plan in place that guides the IMO on how to get there. Based on the data analysis performed on the 14-ship sample, about 48% of the total miles travelled by all of the ships could be powered by a lithium ion battery system. This system would need to have certain characteristics in order for this to be feasible. The pack-level energy density would need to be at least 275 Wh/L. A depth of discharge at 75% seems to be within the standards of current battery technology, however, the losses in cycle life should be analyzed in more depth. As for the volume of space required for the battery system, the engine rooms do not need to be redesigned. However, the clearance space allowed can only be as high as 25%.
The potential of lithium-ion battery technology in maritime shipping is high, but it will require some time and financial resources before it can truly take over the industry. In order to reach the mileage fraction of 48%, 11 out of the 14 ships in the sample were powered by batteries. This would mean that approximately 79% of all ships would be run by a lithium ion battery. Another option could be hybrid ships that use battery power on every other trip. Either way, a large
Hartnett 30
quantity of vessels would need to either remove their current engine setup or alter it to include a new battery system. It takes adequate amounts of time and money to make this happen. Luckily, there are thirty years before the 50% reduction needs to take place. This would make lithium-ion battery technology one of the long-term efforts in reaching this goal.
It is helpful to break down the action plan for the future the same way the MEPC report did. Immediate action can be taken to perform a cost-benefit analysis on converting to electric shipping. Research and development will help to determine realistic depth of discharge estimates given the sacrifice in cycle life. Plans for the design of a battery system can be fleshed out as well. Mid-term goals could be the adoption of battery systems on smaller, passenger ferries that could operate as hybrid ships. Depending on the success of those trials, long-term goals would include converting as many ships to battery systems as possible. If by then, more can be done to decarbonize the electric grid, the IMO can meet the necessary regulations, and the dangerous effects of climate change can be successfully mitigated.
Hartnett 31
Bibliography
[1] “Sulphur 2020 – Cutting Sulphur Oxide Emissions” [Online]. Available:
http://www.imo.org/en/MediaCentre/HotTopics/Pages/Sulphur-2020.aspx. [Accessed: 08-May-2020].
[2] “About IMO” [Online]. Available: http://www.imo.org/en/About/Pages/Default.aspx. [Accessed: 08-May-2020].
[3] “Energy Efficiency and the Reduction of GHG Emissions from Ships” [Online]. Available: http://www.imo.org/en/MediaCentre/HotTopics/GHG/Pages/default.aspx. [Accessed: 08-May-2020].
[4] US EPA, O., 2016, “Global Greenhouse Gas Emissions Data,” US EPA [Online]. Available: https://www.epa.gov/ghgemissions/global-greenhouse-gas-emissions-data. [Accessed: 08-May-2020].
[5] 2018, ADOPTION OF THE INITIAL IMO STRATEGY ON REDUCTION OF GHG
EMISSIONS FROM SHIPS AND EXISTING IMO ACTIVITY RELATED TO REDUCING GHG EMISSIONS IN THE SHIPPING SECTOR, International Maritime Organization.
[6] Warner, J., 2019, Lithium-Ion Battery Chemistries, Elsevier.
[7] 2019, “Nobel Prize for Chemistry: The Lithium-Ion Battery,” The Economist. [8] Pistoia, Gianfranco, 2014, Lithium-Ion Batteries : Advances and Applications.
[9] Rosero, J. A., Ortega, J. A., Aldabas, E., and Romeral, L., 2007, “Moving towards a More Electric Aircraft,” IEEE Aerospace and Electronic Systems Magazine, 22(3), pp. 3–9. [10] Pierce, Alan, 2019, “Alice the All-Electric Commercial Airplane.”
[11] Bills, A., Sripad, S., Fredericks, W. L., Singh, M., and Viswanathan, V., 2020, “Performance Metrics Required of Next-Generation Batteries to Electrify Commercial Aircraft,” ACS Energy Lett., 5(2), pp. 663–668.
[12] Temple, J., “A Powerful New Battery Could Give Us Electric Planes That Don’t Pollute,” MIT Technology Review [Online]. Available:
https://www.technologyreview.com/2018/10/30/1901/top-battery-scientists-have-a-plan-to-electrify-flight-and-slash-airline-emissions/. [Accessed: 08-May-2020].
[13] Minnehan, J. J., Pratt, J. W., and Military Academic Collaboration (MAC) Program, 2017, Practical Application Limits of Fuel Cells and Batteries for Zero Emission Vessels, SAND--2017-12665, 1410178.
[14] Ayers, W., 2016, “Comparative Payback of Lithium-Ion Batteries for Pacific NW Ferries,” p. 7.
[15] “SPBES Specification Sheet.”
[16] “Lithium-Ion Battery | Clean Energy Institute.”
[17] Schmuch, R., Wagner, R., Hörpel, G., Placke, T., and Winter, M., 2018, “Performance and Cost of Materials for Lithium-Based Rechargeable Automotive Batteries,” Nature Energy, 3(4), pp. 267–278.
[18] Mikhaylik, Y., Kovalev, I., Scordilis-Kelley, Y., Liao, L., Laramie, M., Schoop, U., and Kelley, T., 650 Wh/Kg, 1400 Wh/L Rechargeable Batteries for New Era of Electrified
Mobility, Sion Power.
![Figure 1: Greenhouse Gas Emission Rates by Gas provided by the EPA [4].](https://thumb-eu.123doks.com/thumbv2/123doknet/13997638.455612/6.918.110.515.612.1026/figure-greenhouse-gas-emission-rates-gas-provided-epa.webp)
![Figure 2: Lithium-Ion Battery Discharging. Diagram obtain from “Nobel prize for chemistry: the lithium-ion battery” article from the Economist [7]](https://thumb-eu.123doks.com/thumbv2/123doknet/13997638.455612/8.918.110.817.342.931/figure-lithium-battery-discharging-diagram-chemistry-lithium-economist.webp)
![Figure 4: Alice, the all-electric aircraft. Image obtained by Alan Pierce’s article, “Alice the All-Electric Commercial Airplane” [10]](https://thumb-eu.123doks.com/thumbv2/123doknet/13997638.455612/12.918.113.751.106.328/figure-electric-aircraft-obtained-pierce-electric-commercial-airplane.webp)