HAL Id: hal-02803584
https://hal.inrae.fr/hal-02803584
Submitted on 5 Jun 2020
HAL is a multi-disciplinary open access
archive for the deposit and dissemination of sci-entific research documents, whether they are pub-lished or not. The documents may come from teaching and research institutions in France or abroad, or from public or private research centers.
L’archive ouverte pluridisciplinaire HAL, est destinée au dépôt et à la diffusion de documents scientifiques de niveau recherche, publiés ou non, émanant des établissements d’enseignement et de recherche français ou étrangers, des laboratoires publics ou privés.
Building tree allometric equation to assess volume and biomass : from the field to the prediction
Matieu Henry, Laurent Saint-André, Nicolas Picard
To cite this version:
Matieu Henry, Laurent Saint-André, Nicolas Picard. Building tree allometric equation to assess vol-ume and biomass : from the field to the prediction. Training Material - Building tree allometric equation to assess volume and biomass : from the field to the prediction, UN-Reducing Emissions from Deforestation and forest Degradation (UN-REDD). Genève, CHE.; Food and Agriculture Orga-nization (FAO). ITA., Jun 2012, Hanoi, Vietnam. 26 p. �hal-02803584�
Building tree allometric equation to
assess volume and biomass : from
the field to the prediction
Dr. Matieu Henry & Dr. Laurent Saint- André
& Dr. Nicolas Picard
1. Forest stratification (theorical concept);
2. Three approaches for land use change assessment;
3. Assessing national land use & carbon stock
changes;
4. Different methods to assess forest carbon stocks
and carbon stock changes;
5. Harmonization of tree allometric equations to
maximize the use of existing tree allometric
equations;
6. Definitions;
7. Content of the course.
• adequate, i.e., capable of representing land-use categories, and conversions between land-use categories, as needed to estimate carbon stock changes and greenhouse gas emissions and removals;
• consistent, i.e., capable of representing land-use categories consistently over time, without being unduly affected by artificial discontinuities in time-series data; • complete, which means that all land within a country should be included, with increases in some areas balanced by decreases in others, recognizing the bio-physical stratification of land if needed (and as can be supported by data) for estimating and reporting emissions and removals of greenhouse gases; and • transparent, i.e., data sources, definitions, methodologies and assumptions should be clearly described.
1.Forest stratification (theorical concept)
Under the IPCC 2006:
1.Forest stratification (theorical concept)
The land-use categories for greenhouse gas inventory reporting are:
(i)Forest Land
This category includes all land with woody vegetation consistent with thresholds used to define Forest Land in the national greenhouse gas inventory. It also includes
systems with a vegetation structure that currently fall below, but in situ could
potentially reach the threshold values used by a country to define the Forest Land category.
(ii) Cropland (iii) Grassland (iv) Wetlands (v) Settlements (vi) Other Land
Under the IPCC 2006:
Land-use categories and sub-categories may be further stratified on the basis of land-use practices and biophysical characteristics in order to create more
1.Forest stratification (theorical concept)
Strata are areas assumed to contain trees from a single population (in terms of statistical prediction).
Within stratum vegetation characteristics will be similar in terms of structure, species ‐ composition, size class, growth form, age distribution, and canopy characteristics.
The strata used for sampling biomass will be limited by the available vegetation classification and mapping schemes and the scale of estimation required, which in this case is national.
Stratifying an forest area by its carbon stocks rather than by forest vegetation can reduce uncertainty and costs
Which are the forest classifications that will allow us to estimate carbon stock and carbon change?
White Pink
Which are the forest classifications that will allow us to estimate carbon stock and carbon change?
1.Forest stratification (theorical concept)
2. Three approaches for land use representation
Approach 2: Total land-use area, including changes between categories
Approach 3: Spatially-explicit land-use conversion data
2. Three approaches for land use representation
Souza, C. M. J., D. A. Roberts, et al. (2005)
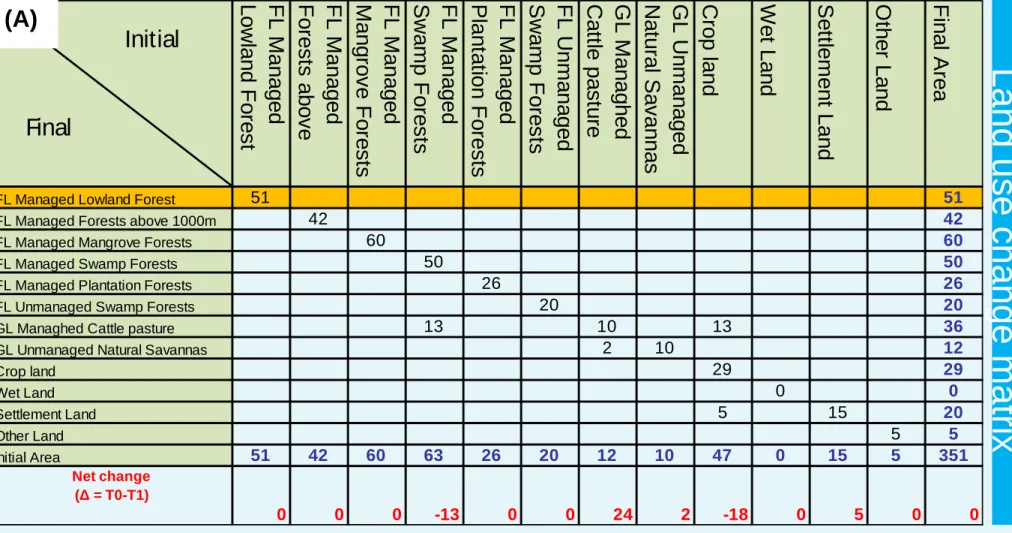
Table 1. Land use change matrix. This matrix describes the change trajectories of the six categories defined under the IPCC
GHG Guidelines (2006): FL = Forest Land, GL = Grass Land, CL = Crop Land, SL = Settlement Land, OL = Other Land. These categories are firstly divided into managed and unmanaged land, then further subdivided into homogeneous strata (i.e. forest types,
grassland types, etc.). Columns and row totals show the total land area for each sub-category at times T0 (Initial Area) and T1 (Final
Area), the Net Change (last row) is estimated as the difference between T0 and T1.
La
n
d u
se
c
h
an
ge
m
a
trix
F L M an ag ed Lo w la nd F or es t F L M an ag ed F or es ts a bo ve F L M an ag ed M an gr ov e F or es ts F L M an ag ed S w am p F or es ts F L M an ag ed P la nt at io n F or es ts F L U nm an ag ed S w am p F or es ts G L M an ag he d C at tle p as tu re G L U nm an ag ed N at ur al S av an na s C ro p la nd W et L an d S et tle m en t L an d O th er L an d F in al A re aFL Managed Lowland Forest 51 51
FL Managed Forests above 1000m 42 42
FL Managed Mangrove Forests 60 60
FL Managed Swamp Forests 50 50
FL Managed Plantation Forests 26 26
FL Unmanaged Swamp Forests 20 20
GL Managhed Cattle pasture 13 10 13 36
GL Unmanaged Natural Savannas 2 10 12
Crop land 29 29 Wet Land 0 0 Settlement Land 5 15 20 Other Land 5 5 Initial Area 51 42 60 63 26 20 12 10 47 0 15 5 351 Net change (Δ = T0-T1) 0 0 0 -13 0 0 24 2 -18 0 5 0 0 Initial Final (A)
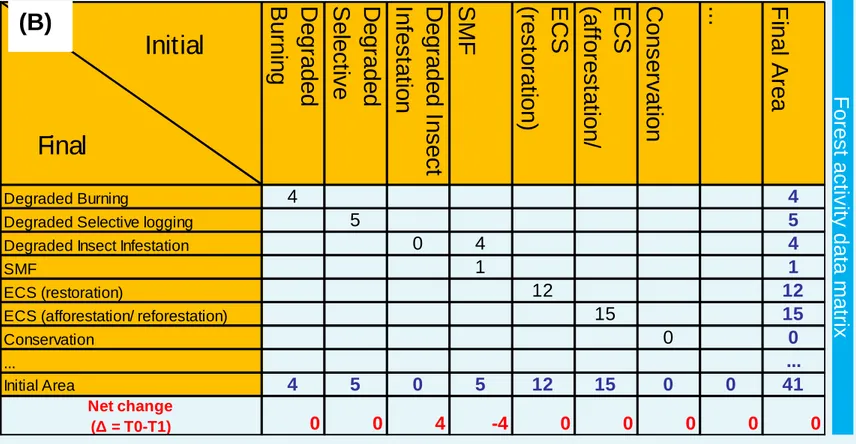
Table 1.1. Use change matrix within a land use subcategory. This table subcategorizes the
change trajectories on forest land into their management activities. As an example, this matrix focuses on degradation, Sustainable Management of Forests (SMF) and Enhanced Carbon Stocks (ECS), affecting evergreen lowland rainforests.
D eg ra de d B ur nin g D eg ra de d S ele cti ve D eg ra de d In se ct In fe sta tio n S M F E C S (re sto ra tio n) E C S (a ffo re sta tio n/ C on se rv at io n ... F in al A re a Degraded Burning 4 4
Degraded Selective logging 5 5
Degraded Insect Infestation 0 4 4
SMF 1 1
ECS (restoration) 12 12
ECS (afforestation/ reforestation) 15 15
Conservation 0 0 ... ... Initial Area 4 5 0 5 12 15 0 0 41 Net change (Δ = T0-T1) 0 0 4 -4 0 0 0 0 0 Initial Final F or es t a cti vit y d at a m at rix (B)
4. Different methods to assess forest
carbon stocks and carbon stock changes
Method 1: Average carbon stocks / stratums / land uses
ST1 ST1 ST2 ST3 ST2 ST1 ST3
FL Managed lowland forest FL Managed > 1000m
Ecological zones identified >> ecology, climate, topography
Land use identified >> boundary mapping, remote sensing Stratum >> field measurements/ remote sensing
Method 2: modelling
A
G
C
variables
NDVI/ NDFI, AVI, GVI etc… Remote sensing/
optical sensors Remote sensing/ radar sensors Remote sensing/ laser sensors
Landsat, MODIS, Ikonos, Quickbird, DEMOS
ERS, JERS,
Envisat, PALSAR Lidar
4. Different methods to assess forest
carbon stocks and carbon stock changes
Saatchi et al. (2011) Zheng et al. (2007)
Based on LAI
4. Different methods to assess forest
carbon stocks and carbon stock changes
This study also demonstrates that the biomass estimates are primarily driven by the biomass reference data while the type of spatial maps used for their
stratification has a smaller, but not negligible, impact.
5.Harmonization of tree allometric
equations to maximize the use of
existing tree allometric equations
Kenzo et al. (2009) Henry et al. (2010) A G B ( kg )
Crown diameter (m) T re e h ei g h t (m ) Lo g h ei g h t (m ) C ro w n h ei g h t (m ) Circumference or diameter (cm) at 1.3m Basal circumference or diameter (cm) T re e vo lu m e (m 3) Lo g v ol um e (m 3 ) B ra nc h v ol um e (m 3 ) Le af v o lu m e (m 3) Crown area (m2) Basal area (m2) T T Bg Bg Bt Bt Bg Bg L L Leaves B B B B Bark Gross branches: D>7cm L L T T Trunk-underbark Bt Bt Thin branches: D<7cm S S Rb Rb Rb Rb S S Stump Large roots Bd Bd Bd Bd Dead branches Rm Rm Rf Rf Rm Rm Rf Rf Medium roots Fine roots F F F F Fruit/seed
5.Harmonization of tree allometric
equations to maximize the use of existing
tree allometric equations
Melson et al. (2011)
6. Definitions
Volume
:
Stem volume is function of a tree's height, basal area, shape, and depending on definition, bark thickness. Volume is often measured for specific purposes, and the interpretation of the volume estimate will depend on the units of measurement, standards of use, and other specifications…
For example:
Biological volume is the volume of stem with branches trimmed at the junction with the stem, but usually excluding irregularities not part of the natural growth habit (e.g. malformation due to insects, fungi, fire, and mechanical damage).
Merchantable volume: excludes some volume within irregularities of the bole shape caused by normal growth in addition to those irregularities not part of natural growth. For example, the volume contained in the swelling around a branch node may be excluded because this volume could not be utilized (by a nominated user).
Gross volume estimates would include defective and decayed wood. Net volume estimates would exclude defective and decayed wood.
Definitions
Biomass:
Biomass is defined as:
IPCC(2006) Woody biomass: Edible biomass: Stump biomass Dry biomass: Etc…
>> dry mass of wood tree components >> dry mass of the stump
>> mass of edible leaves
Definitions
Allometric equation establishes the relation between the tree dimensions Within each tree population, there is a statistical relation between
individual tree measurements
This relation is the results of : Genetics + Environment + History
Furthermore, the relation between dbh & H, CD & AGB etc. is the same for all the individuals within the considered population.
( )
Tree biomass allometric equation establishes the relation a dendrometric parameter and the biomass (AGB, BGB …)
Tree volume allometric equation establishes the relation a dendrometric parameter and the volume
7. Content of the course
1. Basis for biomass assessment: from the biology to the AE (Complexity of tree growth and biomass allocation)
3. Field work: example from case studies 2. Sampling strategy and stratification
4. Data entering, data management and QC
Content of the course
7. Practical cases and issues related to model fitting 8. Use and prediction
• Bombelli, A., V. Avitabile, et al. (2009). Biomass - Assessment of the status of the development of the standards for the Terrestrial Essential Climate Variables, Food and Agriculture Organization - Global Terrestrial Observation System: 30.
• Brown, S. (1997). Estimating Biomass and Biomass Change of Tropical Forests: a Primer. Rome, FAO.
• Souza, C. M. J., D. A. Roberts, et al. (2005). "Combining spectral and spatial information to map
canopy damage from selective logging and forest fires." Remote Sensing of Environment 98: 329 – 343.
• Kenzo, T., T. Ichie, et al. (2009). "Development of allometric relationships for accurate estimation of
above- and below-ground biomass in tropical secondary forests in Sarawak, Malaysia." Journal of Tropical Ecology 25(04): 371-386
• Henry, M., N. Picard, et al. (2011). "Estimating tree biomass of sub-Saharan African forests: a review of
available allometric equations." Silva Fennica Monographs 45(4): 1-94.
• Avitabile, V., M. Herold, et al. (2011). "Mapping biomass with remote sensing: a comparison of methods
for the case study of Uganda." Carbon Balance and Management 6(1): 7
• Saatchi, S. S., N. L. Harris, et al. (2011). "Benchmark map of forest carbon stocks in tropical regions
across three continents." Proceedings of the National Academy of Sciences.
• Melson, S. L., M. E. Harmon, et al. (2011). "Estimates of live-tree carbon stores in the Pacific Northwest
are sensitive to model selection." Carbon Balance and Management 6(2)
• Zheng, G., J. M. Chen, et al. (2007). "Combining remote sensing imagery and forest age inventory for
biomass mapping." Journal of Environmental Management 85: 616-623.