Publisher’s version / Version de l'éditeur:
The 56th Conference of Metallurgists COM 2017, 2017-08-30
READ THESE TERMS AND CONDITIONS CAREFULLY BEFORE USING THIS WEBSITE. https://nrc-publications.canada.ca/eng/copyright
Vous avez des questions? Nous pouvons vous aider. Pour communiquer directement avec un auteur, consultez la première page de la revue dans laquelle son article a été publié afin de trouver ses coordonnées. Si vous n’arrivez pas à les repérer, communiquez avec nous à [email protected].
Questions? Contact the NRC Publications Archive team at
[email protected]. If you wish to email the authors directly, please see the first page of the publication for their contact information.
This publication could be one of several versions: author’s original, accepted manuscript or the publisher’s version. / La version de cette publication peut être l’une des suivantes : la version prépublication de l’auteur, la version acceptée du manuscrit ou la version de l’éditeur.
Access and use of this website and the material on it are subject to the Terms and Conditions set forth at
Advanced laser-induced breakdown spectroscopy (LIBS) sensor for
gold mining
Harhira, Aïssa; Bouchard, Paul; Rifai, Kheireddine; Haddad, Josette El;
Sabsabi, Mohamad; Blouin, Alain; Laflamme, M.
https://publications-cnrc.canada.ca/fra/droits
L’accès à ce site Web et l’utilisation de son contenu sont assujettis aux conditions présentées dans le site LISEZ CES CONDITIONS ATTENTIVEMENT AVANT D’UTILISER CE SITE WEB.
NRC Publications Record / Notice d'Archives des publications de CNRC:
https://nrc-publications.canada.ca/eng/view/object/?id=e302005a-66d5-4a1e-921d-d2cdb0ba0e77 https://publications-cnrc.canada.ca/fra/voir/objet/?id=e302005a-66d5-4a1e-921d-d2cdb0ba0e77
ADVANCED LASER-INDUCED BREAKDOWN SPECTROSCOPY (LIBS) SENSOR FOR GOLD MINING
*A. Harhira1, P. Bouchard1, K. Rifai1, 2, J. El Haddad1, M. Sabsabi1, A. Blouin1, and M. Laflamme2
1
National Research Council Canada,
75 de Mortagne Blvd., Boucherville, Quebec, Canada J4B 6Y4 (*[email protected])
2
Department of Mining, Metallurgical and Materials Engineering, Laval University 1045 Av. de la Médecine, Quebec, Canada G1V 0A6
ABSTRACT
There is a need in the mining industry for determining quickly and in the field the concentration of gold in mineral ore samples. Existent portable analyzers cannot determine the gold content at the ppm range. Hence, a portable LIBS (Laser-Induced Breakdown Spectroscopy) appears as a good candidate but developments are required to fulfill the needs of the gold mining industry. Developing a functional LIBS based analyzer involves several challenges to be addressed prior to its use in the field. To be of practical use, the analyzer has to probe a representative sampling of the surface of the mineral samples and has to tackle the matrix effect resulting from several mineralogical compositions of the samples. This paper presents the recent on-going work at the National Research Council Canada (NRC) and Laval University using LIBS for gold mining, from the determination of gold-bearing rock composition to direct detection of gold and system prototyping.
KEYWORDS
INTRODUCTION
The mining industry is facing the challenges of the depletion of high-grade ore bodies, commodity markets, cost factors and environmental considerations. There is an increasing need to drive down costs while improving efficiency and productivity through innovation, in such fields as on-line analysis and control, automation and robotics, drilling and real-time decision support (Marshall, 2015). Furthermore, mining operations require laboratory-based analysis to control the quality of the ore and to monitor the extraction process. Sample collection, handling, preparation and analysis performed using standard techniques based on wet chemistry or fire assay are time-consuming and cause production delays on the mining or processing steps, thus increasing the operating and production costs.
To address these issues, the mining industry has spent huge investments developing more accurate and effective measurement and control technologies to monitor the feed quality and to improve the recovery efficiency and the tailings treatment. In the case of gold-mining industry, the technology should measure concentration in the order of less than one gram of gold per ton (µg/g or ppm) depending on the operational costs and the market value of gold.
Existing technologies can control to some extent the gold ore properties in real time and in the field during the different mining process steps. For instance, near-infrared spectroscopy (NIR) is based on the detection and the analysis of the NIR radiation reflected from an irradiated solid material. The spectra of the reflected radiation in the NIR region (700-2500 nm) is the signature of electronic molecular processes and molecular band vibrations (De Benedetto, Laviano, Sabbatini, & Zambonin, 2002) which are characteristic of the mineral composition of a sample. However, only minerals that produce NIR active molecules can be identified by NIR spectroscopy (Knapp, Neubert, Schropp, & Wotruba, 2014; Wotruba & Harbeck, 2000) which limits its use to this kind of mineralogy. Applicability of a NIR sensor to characterize epidermal gold ores in terms of economic value has been investigated. The recognition of ore samples with low gold grade is based on specific alteration mineral assemblages detectable from the 1300– 2500 nm range in the NIR spectra. Also, discrimination between samples with high and low sulfur contents based on detecting either Fe-oxide or sulfides minerals from the visible range of the NIR spectra (350– 1300 nm) has been demonstrated (Dalm, Buxton, & Van Ruitenbeek, 2015). Another technique used for on-site real time measurement is X-ray transmission. This technique is based on X-ray absorption of different materials, which depends on the property and the density of each material. In the case of gold, the X-ray transmission technique is able to detect pyrite (FeS2) which is associated with the presence of gold.
It means that gold is indirectly detected by using pyrite presence as an indicator of gold containing ores (Kleine, Riedel, von Ketelhodt, & Murray, 2010; Kleine, Robben, & Wotruba, 2011). Furthermore, X-ray fluorescence (XRF) has been used successfully for determining the concentration of the valuable elements in mineral ores (Hall, Buchar, & Bonham-Carter, 2011). This technique is based on the spectral analysis of secondary rays emitted from the irradiated samples surface irradiated by primary rays. The emitted X-ray fluorescence is the fingerprint for the content of specific elements in the sample and can be used to quantify the elemental composition of each sample. However, it is inappropriate for quantifying the gold content because of the low sensitivity of the technique (Hall et al., 2011). In addition, portable XRF systems have a higher limit of detection in the order of few tens of ppm and suffer from interference with iron, which gives false reading and limits its use for gold detection. The portable XRF technology also suffers from interferences with some other elements such as arsenic, tungsten, and zinc, which can give erroneous values of gold and compromise its determination. In contrast, XRF portable devices are used to detect elements that can serve as indicators or tag of gold-bearing ores. None of these technologies have been demonstrated to be able to directly detect the gold content at the ppm range. A breakthrough would be a technology able to determine the gold content directly, quickly, on-site and down to 1 ppm, since gold is still economically valuable at such low concentration.
Laser-induced breakdown spectroscopy (LIBS) appears to be a potential technique to fulfill the requirement of the gold-mining industry. LIBS is a spectroscopic technique based on atomic emission. It uses a short duration (nanosecond) pulsed laser beam focused onto a sample (solid, liquid or gas) to vaporize samples, atomize the vapour and form a plasma where atoms and ions are in excited state. The
atoms and ions then return to their fundamental states by emitting radiation. The emitted radiation by the plasma is analyzed by a spectrometer and the emission spectrum is recorded by detectors. Wavelengths of the atomic lines provide qualitative information on the chemical composition of the ablated material and the line intensities are related to the element concentrations. By using calibrated samples, it is then possible to determine quantitatively the concentration of the elements in any sample (Cremers & Radziemski, 2013). As an analytical technique, LIBS has many advantages for real-time and in the field applications. LIBS can detect simultaneously spectral lines of several atomic elements in a very short time and with no sample preparation. Only a few milliseconds are required to record a LIBS spectrum. Advancements in photonics and laser industry permit the miniaturization of LIBS system components as well as the field-ability of the technique by developing remote and standoff analyses. LIBS has already been considered for the analysis of ore samples including the identification of mineral groups, with a quantitative analysis of the minor and major elements contained in ore samples. The ore types investigated include iron ores, phosphates and coal. Most of the studies were dedicated to the qualitative and semi-quantitative multi-element analysis of powdered or pellets iron ore (Death, Cunningham, & Pollard, 2008; Grant, Paul, & O'neill, 1990, 1991; Sun, Tran, Smith, & Winefordner, 2000) and the potential effect of particle size and ore mineralogy in iron ore samples (Michaud, Leclerc, & Proulx, 2007; Michaud, Proulx, Chartrand, & Barrette, 2003). Phosphates ores have been already characterized by using LIBS (Rosenwasser et al., 2001). Furthermore, Gaft et al. (Gaft, Sapir-Sofer, Modiano, & Stana, 2007) demonstrated that LIBS can be used for on-line monitoring of phosphate and coal ores. More recently, Dalm and Buxton (2016) showed that LIBS can be used to distinguish between the economic and sub-economic value of gold in epidermal Au-Ag deposits. They also reported that a relationship may exist between the alteration mineralogy of samples and their Au content. In their work, the authors mentioned that the Na/Al peak intensity ratio from LIBS spectra could be used to predict the Au grade of the samples.
To the best of our knowledge, there is no study devoted to the direct detection and analysis of gold in ore samples by LIBS technique. This is due partly to the complexity of the application, in terms of low limit of detection required for gold in ore samples, sample heterogeneity where gold distribution is often extremely irregular, rendering it complicated to quantify with confidence, and variation of the mineralogical matrix in ore samples. This entails a significant intensity variation of the atomic emission line of a given element (e.g. gold) at the same concentration level in several different mixtures of matrices such as iron-matrix and quartz-matrix (Harmon, Russo & Hark, 2013).
In this work, we investigate the use of the LIBS technique to analyze gold ore samples to assess the ore and quantify its gold content. We classified the samples using principal component analysis (PCA) according to their abundant chemical elements. To perform the calibration curves, we prepared synthetic samples with gold concentrations ranging between 0 and 120 ppm which were measured with our LIBS setup. These calibration curves were then used to assess the gold content of a drill core. Finally, we present a Core analysis prototype that we developed. The aim of this paper is to present the progress of the ongoing NRC and Laval University activities on using LIBS for gold mining industry.
EXPERIMENTAL
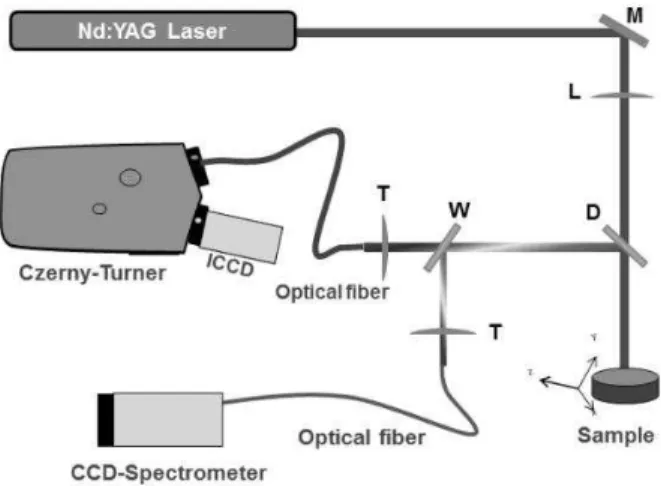
The experimental setup, shown in Figure 1, is based on a pulsed Nd:YAG laser operating at the fundamental wavelength of 1064 nm, delivering a maximum pulse energy of 300 mJ at a maximum repetition rate of 10 Hz. The present configuration includes a 0.67 m Czerny-Turner spectrometer with 2400 grooves/mm grating, coupled with an intensified charge-coupled device (ICCD) detector. The spectrometer system was selected to match the requirements of the gold measurements in terms of sensitivity, spectral response and resolution, aperture, grating, etc. The Czerny-Turner/ICCD combination system was optimized to have the high sensitivity needed for detecting the gold at ppm range. The 2400 grooves/mm grating used in our conditions provides an optimum balance between bandwidth and resolution. A CCD-spectrometer Avantes having a 200 to 800 nm bandwidth was also used to provide more information about the gold-bearing matrix. The laser beam was focused onto the surface to generate plasma. The sample was mounted on a motorized stage for scanning the sample surface. The collected plasma light was reflected on the dichroic filter and then split into two fractions by a quartz plate, so that
around 92% of the light was focused by a lens into an optical fiber bundle. The output of this bundle was positioned in front of the entrance slit of the 0.67 m Czerny-Turner spectrometer. The remaining 8% of the light was focused into an optical fiber connected to the CCD-spectrometer.
Figure 1. Experimental Setup
LIBS APPLIED TO GOLD-BEARING MINERALS
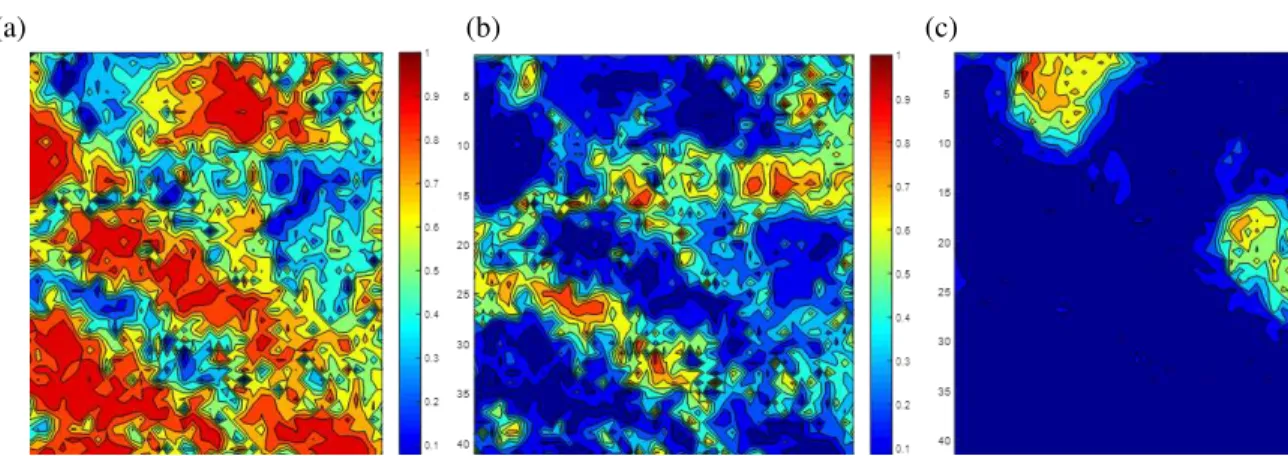
LIBS measurements were carried out on a polished gold-bearing rock from Casa Berardi mine (Quebec-Canada). Spectra were acquired from 45×45 locations with a laser spot of 50 µm and a step size of 100 µm. The major elements in these spectra are silicon, calcium, copper and iron. Prior to determine the gold concentration on the surface of a heterogeneous sample by using a relationship between the gold line intensity and the element concentration, it is important to evaluate the mineral assemblages present in the material. The PCA method (Wold, Esbensen, & Geladi, 1987) was applied to the normalized and scaled spectra to analyze the acquired data. The contributions of each wavelength (or wavelength range) to a particular principal component are called loadings. Figure 2 presents the loadings of the first p[1] and the second principal component p[2]. For the first component, Si lines which are correlated with the abundance of Si-rich minerals such as quartz represent negative loading values and the other elements (Fe, Ca, Mg, etc.) represent the positive values. Fe lines have the highest positive values on the first component p[1], and Fe lines are correlated with the abundance of Fe-rich minerals such as Fe-oxides or sulfides. In the second component, Ca and Mg lines, i.e. carbonates, represent the positive loadings. The projections of LIBS spectra, known as the PCA scores, on the first and the second principal component of the PCA model were arranged to build score maps. The maps shown in Figure 3 (a) presents the scores of the first component and as for loadings (cf. Figure 2) the highest score values indicate the highest intensities of iron lines, and the lowest values correspond to high intensities of Silicon lines. Figure 3 (b) presents the score of the second components and as shown in Figure 2 the highest score values are related to the highest values in calcium and magnesium lines. Following the normalization of the PCA scores, the mapping gives the location of each type of abundant matrix. Figure 4 shows the normalized abundance of the Si-rich matrix (a), the Ca-rich matrix (b) and the Fe-rich matrix (c). As expected, more than one abundant matrix is seen. This means that the variation of gold line intensity cannot be related only to the gold concentration but may also be attributed to the influence of the chemical matrix effect, which cannot be neglected in a mixture of several minerals. So applying multivariate analysis methods to LIBS spectra can be useful to distinguish Fe-rich and Si-rich gold-bearing minerals. To achieve this matrix recognition, well-known classification and discrimination models such as SIMCA, PLS-DA, SVM-DA (Harmon, Russo, & Hark, 2013; Senesi, 2014) could be used.
Figure 2. Loading projections of the first p[1] and the second p[2] principal components
Figure 3. PCA Score projections of the 45×45 LIBS mapping (a) score values of the first principal component and (b) score values of the second principal component
(a) (b) (c)
Figure 4. Mapping of abundance matrices from zero to 1 for (a) Si-rich matrix (b) Ca-rich matrix and (c) Fe-rich matrix
DIRECT GOLD DETECTION AND QUANTIFICATION
Many gold lines can be found in the NIST atomic spectra database (Sansonetti, 2005). According to the atomic physical data, such as transition probabilities, statistical weight, energy levels, etc., the lines 242.73 nm and 267.59 nm appear to be the strongest for gold detection and thus are suitable to obtain a low detection limit. Because the 242.73 nm line suffers from interference with neighbouring iron lines, the 267.59 nm line was selected for gold detection. Therefore, the experimental configuration was optimized for a spectral window centred at 265 nm. To study the influence of the matrix effect on the variation of the Au line intensity, 11 synthetic matrices made of compressed fine powders with a quasi-uniform concentration of gold were fabricated. In addition, silicon, sulfur and iron concentrations were determined by standard laboratory methods. The controlled gold concentration in the synthetic samples helps to overcome the heterogeneity and the sampling issues, which are beyond the scope of this work and are currently under development in our laboratory.
The measurements of these samples were performed by scanning 8 × 8 mm2 areas with a step size
of 800 µm and averaging over 100 laser shots. Each measurement is repeated 5 times in order to evaluate the reproducibility. Figure 5 shows two averaged normalized LIBS spectra in the 267 nm window, one for a quartz chlorite sample (Si-rich) and the other of a pyrite sample (Fe-rich). Only the wavelength region around 267 nm is shown. The quartz chlorite sample contains 31 ppm of gold and 4.99% of iron while the pyrite sample contains 25.4 ppm of gold and 39.55% of iron. As expected, a significant change has been observed in the spectra as the mineralogy varies. On the spectrum of the quartz chlorite sample, we identified the gold line at 267.59 nm and the ionic chromium line at 267.71 nm. It can be seen that the gold line is well resolved on this spectrum within the spectral resolution of the spectrometer (FWHM = 0.015 nm). However, for the Fe-rich matrix, two strong neighbouring iron lines appear next to the gold line, which causes a significant offset when extracting the net intensity of the gold line for quantification purposes. In order to evaluate this offset, a blank sample (i.e. without gold) having roughly the same concentration of iron needs to be measured to determine the spectra intensity at the position of the gold line (267.59 nm). In practical cases where real samples such as a drill-core or a rock are measured, the iron-rich matrices can be identified by using a chemometric tool such as PCA or PLS-DA. Moreover, the determination of this offset is easy to extract from gold-free spots on the sample surface.
Figure 5. Spectra between 265 and 270 nm for two different mineralogical matrices. Solid line (31 ppm of Au, 4.99% of Fe); dotted line (25 ppm of Au, 39.6% of Fe); and dashed line (0 ppm of Au and 39.55% of
Fe)
To establish calibration curves, samples containing fewer than 5% of iron are considered as Si-rich samples and samples having more than 10% of iron are considered as Fe-Si-rich samples. In Figure 6, the normalized gold line shows a good linearity with the gold concentration up to about 120 ppm. The
normalization was performed by dividing the Au line by the adjacent background at 267.38 nm. The solid lines represent linear fits for the Si-rich and Fe-rich samples, with a good coefficient of correlation R2 =0.9935 and 0.9875, respectively. Based on the 3σ criterion (Morrison, Cheng, & Grasserbauer, 1979) and using the calibration curves, the limit of detection (LOD) for gold is estimated to be 0.75 ppm for the Si-rich samples and about 1.5 ppm for the Fe-Si-rich samples.
Figure 6. Calibration curves using the normalized gold line at 267.59 nm for the quartz-matrix samples (circles) and for the iron-matrix samples (squares). The solid lines represent the linear regression fit of the
points from each sample set
AVERAGE GOLD CONCENTRATION ON THE SURFACE OF A DRILL CORE
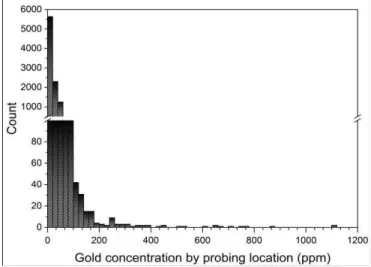
A drill core from the Lapa gold mine (Quebec, Canada) was analyzed. The core, which is a cylinder of about 1 metre long and 7 cm diameter, has been cut lengthwise into two parts. One half has been grinded and homogenized, and then analyzed by fire assay. The concentration determined by fire assay on the 1 metre long core was 46 ppm. 10,000 laser shots have been performed onto the flat surface of the other half of the core with a laser-scanned area of 5x20 cm2. The laser spot size was about 600 µm
while the step between the shots was 800 µm. The gold concentration for each laser shot on the surface is determined by using PCA to determine the gold-bearing matrix and then using both calibration curves shown in Figure 6 and by extrapolating their linear fits to determine concentrations higher than 100 ppm. Figure 7 shows the gold concentration distribution of 10,000 shots over the 5×20 cm2 surface. The
concentration values were high (up to few thousands ppm) in some probing locations and very low for other sites. These results show the level of heterogeneity of the distribution of gold on the drill core surface over a millimetre scale. The averaging gold concentration over 10,000 laser shots resulted in values of 25.47 ppm, which is about twice lower than the fire assay reference value. This discrepancy is likely due to the sample heterogeneity and the gold distribution on the surface, which may not reflect the volume concentration. Another possible reason is that the measurements performed on a relatively small scanned area may not be representative of the whole core.
Figure 7. The gold concentration distribution of 10,000 shots over the 5×20 cm2 surface of a drill core PROTOTYPE DEVELOPMENT
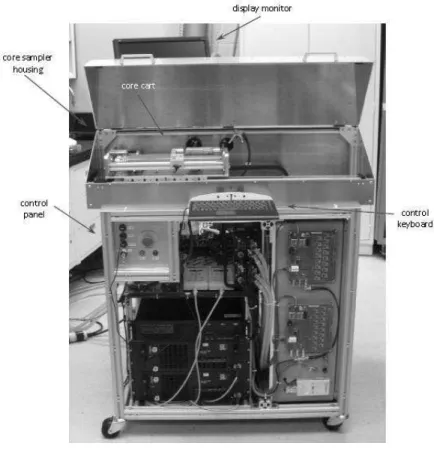
In the past, the NRC has been mandated to design and to assemble a prototype LIBS system optimized for the detection of Au and some other indicators elements such as Ag, Cu, Pb, Zn, Ni, Cr, Bi, Na, K, Mg, and Al content in Si-rich core samples. The prototype LIBS system was installed in a core shack at the Goldcorp Porcupine mine in Timmins (Ontario, Canada). The physical configuration of the CoreLIBS unit is described in Figure 8. The system consists of a double-pulse laser system for plasma generation, a Paschen-Runge polychromator with photomultiplier tube detectors for light collection and a core sampler which allows simultaneous mechanical translation and rotation of the core sample in front of the laser beam. In addition, a custom software module was developed to control the system components and give access to the measured data, both in real-time during a scan or for post-processing. The CoreLIBS system allows the determination of elemental concentrations at the core surface by performing simultaneous measurements of spectral line intensities. In order to translate the spectral data into actual concentrations, a set of factors has to be determined from a family of calibration curves and fed into the system. To assess the performance that can be achieved by the system, homogeneous calibration samples were measured using the CoreLIBS system. Therefore, the calibration factors for the measurement of gold were derived from the graphs of element concentration vs the LIBS line-to-background ratio signal. In the on-going projects, the NRC is working on the integration of an extra broadband spectrometer in future prototypes. This allows the recognition of additional gold-bearing minerals and therefore a more accurate gold concentration determination.
Figure 8. The CoreLIBS unit
CONCLUSIONS
The given examples showed that LIBS coupled to chemometrics tools such as a PCA can be used to distinguish Fe-rich and Si-rich gold-bearing minerals by using the spectra as chemical fingerprints of the mineralogy. This means that the LIBS spectrum can be used to both detect gold and predict which mineral is probably hosting gold. The results showed that the LIBS technique is able to directly detect the gold content of mineral samples. Calibration curves of the Au I 267.59 nm line for Si-rich samples (<5% iron) and one for Fe-rich samples (> 13% iron) with limits of detection of 0.75 ppm and 1.5 ppm, respectively, were determined. The attempt of the gold concentration prediction on a surface of a drill core showed the multiscale heterogeneous distribution of gold on the surface. The ~45% relative difference between the fire assay and LIBS results can be attributed to sample heterogeneity and to the heterogeneous nature of the gold distribution on the centimetre scale. Our next challenge is to develop an algorithm for determining the gold concentration within a wider range of matrix composition representing most of the gold ore in the Canadian Shield mineral. The second challenge is having representative sampling. Recent activities addressing both challenges in our laboratory are in progress and the preliminary obtained results are encouraging.
ACKNOWLEDGMENTS
The authors would like to thank François Vidal from INRS, Marc Constantin, Maryline Castello, Blandine Nguegang Kamwa from Laval University and SOREDEM, Canadian Malartic, Goldcorp, Agnico Eagle, Hecla Quebec, and Iamgold for providing samples.
REFERENCES
Cremers, D. A., & Radziemski, L. J. (2013) Handbook of Laser-Induced Breakdown Spectroscopy: John Wiley & Sons Ltd.
Dalm, M., & Buxton, M. (2016). Characterizing the economic value of an epithermal Au-Ag ore with Laser Induced Breakdown Spectroscopy (LIBS). Paper presented at the Proceedings of the 7th Sensor-Based Sorting and Control 2016.
Dalm, M., Buxton, M., & Van Ruitenbeek, F. (2015). Applicability of near-infrared hyperspectral imagery (NIR-HI) for sensor based sorting of an epithermal Au-Ag ore. Paper presented at the Proceedings of the 54th Annual Conference of Metallurgists COM 2015, Ontario (Canada).
De Benedetto, G., Laviano, R., Sabbatini, L., & Zambonin, P. (2002). Infrared spectroscopy in the mineralogical characterization of ancient pottery. Journal of Cultural Heritage, 3(3), 177-186. Death, D., Cunningham, A., & Pollard, L. (2008). Multi-element analysis of iron ore pellets by
laser-induced breakdown spectroscopy and principal components regression. Spectrochimica Acta Part B: Atomic Spectroscopy, 63(7), 763-769.
Gaft, M., Sapir-Sofer, I., Modiano, H., & Stana, R. (2007). Laser induced breakdown spectroscopy for bulk minerals online analyses. Spectrochimica Acta Part B: Atomic Spectroscopy, 62(12), 1496-1503. Grant, K. J., Paul, G. L., & O'neill, J. A. (1990). Time-resolved laser-induced breakdown spectroscopy of
iron ore. Applied spectroscopy, 44(10), 1711-1714.
Grant, K. J., Paul, G. L., & O'Neill, J. A. (1991). Quantitative elemental analysis of iron ore by laser-induced breakdown spectroscopy. Applied spectroscopy, 45(4), 701-705.
Hall, G., Buchar, A., & Bonham-Carter, G. (2011). Quality control assessment of portable XRF analysers: development of standard operating procedures, performance on variable media and recommended uses. CAMIRO Project 10E01 report.
Harmon, R. S., Russo, R. E., & Hark, R. R. (2013). Applications of laser-induced breakdown spectroscopy for geochemical and environmental analysis: A comprehensive review. Spectrochimica Acta Part B: Atomic Spectroscopy, 87, 11-26. doi:10.1016/j.sab.2013.05.017
Kleine, C., Riedel, F., von Ketelhodt, L., & Murray, R. (2010). Sensor-Based Sorting: Aachen, March. Kleine, C., Robben, M., & Wotruba, H. (2011). Physical Separation: Falmouth, June.
Knapp, H., Neubert, K., Schropp, C., & Wotruba, H. (2014). Viable Applications of Sensor‐Based Sorting for the Processing of Mineral Resources. ChemBioEng Reviews, 1(3), 86-95.
Marshall, B. (2015). Facts and Figures of the Canadian Mining Industry. Retrieved from http://mining.ca/sites/default/files/documents/Facts-and-Figures-2015.pdf
Michaud, D., Leclerc, R., & Proulx, É. (2007). Influence of particle size and mineral phase in the analysis of iron ore slurries by Laser-Induced Breakdown Spectroscopy. Spectrochimica Acta Part B: Atomic Spectroscopy, 62(12), 1575-1581.
Michaud, D., Proulx, E., Chartrand, J.-G., & Barrette, L. (2003). Shooting slurries with laser-induced breakdown spectroscopy: sampling is the name of the game. Applied Optics, 42(30), 6179-6183.
Morrison, G. H., Cheng, K., & Grasserbauer, M. (1979). General-Aspects of trace analytical methods. 4. Recommendations for nomenclature, standard procedures and reporting of experimental-data for surface-analysis techniques. Pure and Applied Chemistry, 51(11), 2243.
Rosenwasser, S., Asimellis, G., Bromley, B., Hazlett, R., Martin, J., Pearce, T., & Zigler, A. (2001). Development of a method for automated quantitative analysis of ores using LIBS. Spectrochimica Acta Part B: Atomic Spectroscopy, 56(6), 707-714.
Sansonetti, J. E. & Martin, W. C. (2005). Handbook of Basic Atomic Spectroscopic Data. Retrieved February, 2017 https://www.nist.gov/pml/handbook-basic-atomic-spectroscopic-data
Senesi, G. S. (2014). Laser-Induced Breakdown Spectroscopy (LIBS) applied to terrestrial and extraterrestrial analogue geomaterials with emphasis to minerals and rocks. Earth-Science Reviews, 139, 231-267. doi:http://dx.doi.org/10.1016/j.earscirev.2014.09.008
Sun, Q., Tran, M., Smith, B., & Winefordner, J. (2000). Determination of Mn and Si in iron ore by laser-induced plasma spectroscopy. Analytica Chimica Acta, 413(1), 187-195.
Wold, S., Esbensen, K., & Geladi, P. (1987). Principal component analysis. Chemometrics and Intelligent laboratory Systems, 2(1-3), 37-52.
Wotruba, H., & Harbeck, H. (2000). Sensor-Based Sorting Ullmann's Encyclopedia of Industrial Chemistry: Wiley-VCH Verlag GmbH & Co. KGaA.