HAL Id: hal-01688416
https://hal.archives-ouvertes.fr/hal-01688416
Submitted on 12 Mar 2018
HAL is a multi-disciplinary open access
archive for the deposit and dissemination of
sci-entific research documents, whether they are
pub-lished or not. The documents may come from
teaching and research institutions in France or
abroad, or from public or private research centers.
L’archive ouverte pluridisciplinaire HAL, est
destinée au dépôt et à la diffusion de documents
scientifiques de niveau recherche, publiés ou non,
émanant des établissements d’enseignement et de
recherche français ou étrangers, des laboratoires
publics ou privés.
Thermal decomposition of bio-oil: Focus on the products
yields under different pyrolysis conditions
Younes Chhiti, Sylvain Salvador, Jean-Michel Commandre, Francois Broust
To cite this version:
Younes Chhiti, Sylvain Salvador, Jean-Michel Commandre, Francois Broust. Thermal decomposition
of bio-oil: Focus on the products yields under different pyrolysis conditions. Fuel, Elsevier, 2012, 102,
pp.274-281. �10.1016/j.fuel.2012.06.098�. �hal-01688416�
Thermal decomposition of bio-oil: Focus on the products yields under
different pyrolysis conditions
Younes Chhiti
a,⇑, Sylvain Salvador
a, Jean-Michel Commandré
b, François Broust
b aEcole des Mines d’Albi – Carmaux, Centre RAPSODEE, FRE CNRS 3213, Campus Jarlard, route de Teillet 81013, Albi CT Cedex 09, France bCIRAD, UR Biomasse Energie, TA B-42/16, 73, Avenue J.-F. Breton, 34398 Montpellier Cedex 5, FranceKeywords: Bio-oil Pyrolysis Char Gas Tar a b s t r a c t
In this study, pyrolysis process of wood bio oil was studied. The effects of temperature in the range 550 1000!C, heating rate in the range 2 2000 !C s1and ash content of the bio oil on char, tar and gas yields
were investigated. The main gas species generated are quantified by Micro GC: H2, CO, CO2, CH4and trace
amounts of C2H4and C2H6.
A temperature increase from 550 to 1000!C enhanced greatly the gas yield, whilst solid and liquid yields decreased significantly. The heating rate was varied in a range covering rapid pyrolysis using the Horizontal Tubular Reactor (HTR) to flash pyrolysis using an Entrained Flow Reactor (EFR). A decrease of char yield from 11 wt.% down to 4 wt.% was observed when heating rate is changed from 2 to 100!C s 1. In EFR a flash heating rate of 2000!C s 1led to a char yield as low as 1 wt.%.
Bio oil with a natural ash contents of 0.05 wt.% and bio oil added with 3 wt.% of ash were finally pyr olyzed. Ash seems to favor re polymerization reactions that lead to an increase in char yield. A decrease in the amount of gas is observed when ash is added while an increase was a priori expected.
l ll
1. Introduction
Among the different thermochemical processes for converting lignocellulosic biomass into energy, fast pyrolysis has gained par ticular attention for the last years as a process for preconditioning
of biomass into high yields of bio oils, as liquid intermediate bio fuel before its transport to a larger energy production unit. Fast pyrolysis is operated under inert atmosphere, high heating rates, moderate temperature, short vapour residence times and rapid quenching of the pyrolysis vapours. The main advantage of bio oils is due to their unique and specific properties. Bio oil has much higher energy volume density than that of solid biomass. This is particularly promising due to the high geographic dispersion of biomass which generally leads to high transportation costs: ⇑Corresponding author. Tel.: +33 6 60425664.
bio oils can easily be stored and transported from scattered gath ering stations to a large scale processing plant. Bio oil has a wide range of potential industrial uses [1]: combustion for heat and power (boilers, engines or gas turbines), syngas or hydrogen pro duction via gasification/steam reforming process in high tempera ture entrained flow reactors, co refining after upgrading. Moreover, the specific composition of bio oils (hundreds of organic compounds issued from the depolymerization of cellulose, lignin and hemicelluloses) widens opportunities for the co production of chemicals (anhydro sugars like levoglucosan, resins, liquid smoke, wood preservative, etc.).
In the high temperature applications such as gasification, steam reforming or even combustion, the very first step of fuel thermal decomposition is under pyrolysis conditions. It is of particular interest to understand the behaviour of bio oils in these condi tions. However, only few works have been dedicated to this ‘‘sec ondary’’ pyrolysis process oil conversion under various operating conditions.
The earliest combustion tests of bio oil droplets were con ducted in Sandia National Laboratory[2,3]. In situ video imaging revealed that biomass oil droplets undergo several distinct stages of combustion. Initially biomass oil droplets burn quiescently in a blue flame, then rapid droplet swelling and distortion, followed by a microexplosion. The same observations were found by Cala bria et al.[4].
Thermogravimetric analysis (TGA) is widely used in the litera ture to characterize the different mechanisms occurring during combustion of bio oils. Although this methodology is limited to rather low heating rates, these studies concluded that the bio oil weight loss process in inert atmospheres can be divided into two stages: the evaporation of light volatiles (<150 200!C) and the subsequent thermal decomposition of unstable heavier compo nents (<350 400!C). In the presence of air, the weight loss of bio oils comprises an additional step, corresponding to the com bustion of chars formed in the first two stages (>400!C)[5,6].
Bio oil evaporation was investigated by Branca et al.[7 9]. They studied separately the devolatilization of several wood bio oils and the heterogeneous combustion of the resulting secondary char, using an original thermogravimetric system operating. From the weight losses obtained in air with a heating rate of 0.08 C s 1to fi
nal temperature of 600 K, the authors concluded that the bio oil sample modification and the secondary char formation start at temperatures of about 460 490 K. The yield of secondary char var ies from about 25 39% (on a total oil basis). Moreover, a conceptual reaction mechanism, consisting of six main zones was suggested to explain these low temperature (600 K) devolatilization character istics[10].
Hallet and Clark [11] established a numerical model for the evaporation and pyrolysis of a single droplet of bio oil derived
from biomass. The model is compared with the results of sus pended droplet experiments, and is shown to give good predictions of the times of the major events in the lifetime of a droplet: initial heating, evaporation of volatile species, and pyrolysis of pyrolytic lignin to char.
van Rossum et al.[12]studied the evaporation of bio oil and product distribution at varying heating rates ("1.5 1.5.104 !C s 1)
with surrounding temperatures up to 850!C. A total product distri bution (gas, vapor, and char) was measured using two atomizers with different droplet sizes. A big difference is seen in char produc tion, they found that small droplets (undergoing high heating rate) are much quicker evaporated and give much less char compared to larger droplets (undergoing low heating rate).
From this short review, it appears that the decomposition of bio oil occurring under pyrolysis (inert) conditions is a complex process involving vaporization and thermal cracking reactions with formation of gas, tars and char.
The present work aims to better understand this step, to bridge the lack of knowledge concerning the physicochemical transforma tion of bio oil and to investigate the effect of various operating conditions on the pyrolysis products yield. In particular, it will focus on the influence of the heating rate and the final pyrolysis temperature on the product distribution. For this aim, two comple mentary devices were used to study on the one hand a wide range of heating rates, in the range from 2 to 2000!C s 1and on the other
hand final temperature ranging from 550 to 1000!C. Finally ash is known for its catalytic effect during thermo chemical conversion of biomass as approved the works done on solid biomass. In the present work the influence of ash on the bio oil pyrolysis process has also been evaluated.
2. Materials and methods
2.1. Description of the laboratory device and of the procedure Two complementary devices, namely: a Horizontal Tubular Reactor (HTR) and a High Temperature Entrained Flow Reactor (HT EFR), were used to study a wide range of heating rates, in the range from 2 to 2000!C s 1and final temperature from 550
to 1000!C.
2.1.1. Horizontal tubular reactor HTR
The experiments of fast pyrolysis were carried out in a HTR (Fig. 1). This device allowed carrying out experiments in conditions of fast pyrolysis which is not possible in a thermobalance. The reactor consisted of a double walled quartz pipe. The length and inside diameters were 850 mm and 55 mm respectively for the in ner tube, and 1290 mm and 70 mm respectively for the outer tube. The reactor temperature can reach 1100!C.
1- Furnace 5- Refractory wool soaked with 1g of bio-oil 2- Quartz reactor 6- Thermocouple
3- Movable sample boat 7- Outlet gas
4- Metal grid M- Mass flow meters and controllers
The procedure carried out for an experiment was the following. First, the furnace was heated and the gas flowrate (nitrogen) was adjusted using a mass flow meter controller. When the tempera ture was stabilized, the sample was placed on the metal grid at the unheated section of the reactor. This section was swept by half of the total cold nitrogen flow injected, in order to maintain it cold and under inert atmosphere, and therefore avoid its degradation. Meanwhile the second half of the nitrogen flow was preheated through the double walled annular section of the reactor as shown inFig. 1. The sample consisted in 1 g of bio oil was placed inside a crucible of 25 mm diameter and 40 mm height for studying the ef fect of temperature and of ash content. In order to achieve higher heating rates, some runs were performed with 1 g of bio oil previ ously soaked in a refractory wool sample of 100 # 20 mm length and width and 3 mm thickness. The choice of this sample holder al lowed increasing the exchange surface and subsequently obtaining larger heating rates. We proved that this wool has no catalytic ef fect on bio oil pyrolysis. Indeed, previous bio oil pyrolysis experi ments were carried out first with a single crucible, and secondly in the refractory wool deposited in the crucible. The wool didn’t in duce any change on the products yield.
The reactor outlet was first connected to an O2gas analyser to
ensure that there is no oxygen in the reactor. Afterwards, a manual insertion enabled to move the sample in the furnace at different velocities, ranging between 0.06 cm s 1and 30 cm s 1. The sample
temperature evolution was measured using a thermocouple placed in the middle of the sample in order to determine a heating rate for each experiment. Variation of the heating rate was obtained by varying the sample introduction through the tubular reactor. Four different durations have been used: 16, 8, 4 and finally 0.03 min resulting in four different heating rates. The sample then remained in the middle of the reactor for a definite time and is brought back out of the furnace; the solid residue was weighed after cooling. Even after several experiments, no char deposit was observed in side the reactor. Only tar deposits were observed in the cold outlet of the reactor. The reactor outlet was connected to a sampling bag at t 0 just before sample introduction. The gases formed by pyro lysis were collected in the bag. The duration of all experiments was 10 min with a 2 NL/min N2flowrate which enabled to know accu
rately the volume of N2sampled in the bag. In HTR reactor, the vol
ume of formed gas never exceeded 1% of the volume of N2sampled
in the bag. After the experiment the bag was disconnected from
HTR, and connected to the micro chromatograph analyser (
l
GC). From the total volume of gas in the bag and measure of the gas concentration, the quantity of each gas formed by 1 g of bio oil can be precisely calculated.2.1.2. Entrained flow reactor EFR
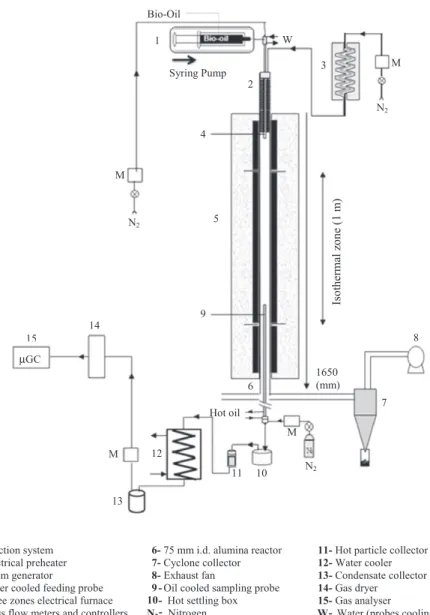
To increase heating rate and reach flash pyrolysis conditions, a few additional experiments were carried out in a laboratory scale EFR. It consisted in a vertical tubular reactor electrically heated by a total of 18 kW three zones electrical furnace, and was able to reach 1600!C in a 1 m long isothermal reaction zone, as illus trated in Fig. 2. The atmosphere gas was generated by feeding the controlled flows of nitrogen in a 2 kW electrical steam genera tor. This atmosphere gas was then preheated using a 2.5 kW elec trical battery of heating elements before reaching the isothermal reaction zone. EFR was equipped with a specially designed bio oil spraying feeder, with the aim to obtain a very constant mass flowrate spray [13]. The feeder consisted of a 1 m long and 14 mm o.d. probe cooled with water at 30!C. At its extremity a stainless steel nozzle was integrated, which allowed uniform dis tribution with fine atomisation. The microscopic observation of droplets impacted on a surface indicates a size ranging between 20
l
m and 400l
m. However, the majority of the droplets were much smaller and not measurable.The oil was fed with a syringe which is pushed automatically. The expected mass flowrate of 0.3 g min 1was too low for direct
spraying. Therefore, a 3.5 NL min 1N
2flowrate was used to entrain
oil in the feeding probe and to ensure a thin spray of the oil. The spray of droplets was dispersed on the section of a 75 mm i.d. alu mina reactor swept by 15 NL min 1of N
2atmosphere. At 1760 mm
downstream of the injection point, gases and solid residue were sampled by a hot oil cooled probe. The sampling flowrate is mea sured accurately using a mass flow meter. The total gas flowrate at the exit of the reactor is calculated based upon the N2flowrate fed
to the reactor and upon the produced gas species concentrations that are measured. A mass balance was used to calculate the total flowrate for each gas species. Gas and solid residue were separated using a settling box and a filter, both heated to avoid water con densation. The water and potential remaining tars were first con densed in a heat exchanger, and non condensable gases were forwarded to a micro chromatograph analyser (
l
GC) to quantify H2, CO, CO2, CH4, C2H2, C2H4, C2H6, C3H8and C6H6.2.2. Feedstock
The feedstock used for all experiments was a bio oil produced by fast pyrolysis of softwood on an industrial scale fluidized bed unit (Dynamotive, West Lorne, Ontario) and provided by CIRAD, France. Its physico chemical properties have been measured (see
Table 1). The water content of the bio oil measured by Karl Fischer method (ASTM E203) is around 26 wt.% which is in agreement with the average values reported in the literature. It can be noticed that the solid particles content is rather high (2.3 wt.%) while the ash content remains low (around 0.06 wt.%). This confirms that the so lid particles mainly consist of high carbon content char particles. These particles were entrained during bio oil production by the gas stream to the bio oils condensers. Ultimate analysis and LHV of the bio oil are very similar to those of wood. From the ultimate
analysis, the chemical formula of the bio oil can be established as CH1.18O0.48.0.4 H2O.
After the production, the bio oil was stored at 5!C in a fridge. Before experiments, it was filtered on a 30
l
m sieve to eliminate larger solid particles which represented less than 0.01 %.wt of the oil.2.3. Method for char/gas/tar yields measurement and interpretation The yields of char/gas/tar products are interpreted in the fol lowing manner. At first, the water contained by bio oil vaporizes together with light volatile matters. As the temperature of bio oil continues to increase, pyrolysis occurs, leading to the release of so called primary volatile matters and to the formation of char. Pri mary volatile matters may undergo a complex series of cracking reactions giving rise to non condensable gases as well as secondary and eventually tertiary volatile matters and re polymerization in side the sample which leading to formation of solid carbon.
At high furnace temperature (above 1000!C), the gas species can also undergo reforming reactions, as steam is present in the gas, leading to much more non condensable gases (including H2)
generated. The progress of the cracking and reforming reactions is influenced by the temperature of the gas phase, and the vapor residence time which was estimated to several seconds both in the HTR and in the EFR as detailed further.
Finally the collected products are: the solid residue, or char;
permanent gases. The major gas species classically identified during pyrolysis are H2, CO, CO2, C2H2,C2H4;
tars: the condensable volatile organic compounds;
water which is originating both from the water initially present in bio oil and from the pyrolysis reaction.
Thereafter the term ‘‘condensate’’ stands for the mix of tars and water. No condensation system is set up. Therefore, the condensate yield is calculated as the complement to 100 wt.% of the yields in gas and solid residue.
3. Results and discussions
3.1. Preliminary runs of bio oil pyrolysis at two final reactor temperature
Two reactor temperatures were tested in order to evaluate the effect of the final pyrolysis temperature on devolatilization process affecting the yield of gas, condensate and residual solid:
Moderate temperatures at 550!C;
High temperature 1000!C to approach the severe conditions of gasification.
The yields of final products are listed inFig. 3. With tempera ture increasing from 550 to 1000!C, the total gas yield increased sharply from 12.2 to 43.0 wt.%, while condensate (tar + water) de creased from 73.2 to 47.5 wt.%. Meanwhile, varying temperature shows a great influence on the gas composition.Fig. 4shows that the main gas products are H2, CO and CO2, CH4and some C2hydro Table 1
Ultimate analysis and several characteristics of bio-oil derived from hardwood fast pyrolysis.
Ultimate analysis (wt.%) H2O Ash Solids LHV Kinematic viscosity
C H O N (wt.%) (wt.%) (wt.%) (MJ kg1) at 20!C (mm2s1)
carbons (C2H2, C2H4and C2H6). Among them, the H2and CO con
tent increased significantly from 0.056 to 1.65 wt.% and from 5.9 to 23.9 wt.% respectively as temperature increased from 550 to 1000!C. Yields of CH4also increased from 1.2 to 5.0 wt.% whilst
that of CO2increased from 4.2 to 10.8 wt.%. The yields of C2H2,
C2H4and C2H6are relatively small. The specie C2H6appears only
at 550!C while C2H2appears only at 1000!C. The thermal cracking
of gas phase hydrocarbons at high temperature might explain the variation of gas product composition observed.
Finally, with increasing temperature from 550 to 1000!C, the char yield decreased significantly from 14.5 to 9.4 wt.%. However changing the reactor temperature implies a change of both the heat flux density imposed to bio oil (and hence its heating rate) but also the final temperature reached by the char produced. Therefore the later trend observed might be due to two reasons:
the char formed at 550!C contains residual volatile matters which are released when the temperature increases to 1000!C; increasing the heating rate results in the decrease of the char yield. This is actually in good agreement with what is usually observed in the literature from pyrolysis of biomass[14 16]. To check the first assumption, a char first prepared at 550!C was submitted to a second heating step at 1000!C. During this sec ond step at 1000!C, the mass of char did not change, which ex cluded the first assumption, and highlighted actually the effect of heating rate. In order to confirm this trend, additional experiments were carried out separating the effect of these two parameters. This is studied in details in the following section.
3.2. Effect of heating rate and final temperature on the product yields The temperature profiles obtained in the HTR are illustrated in
Fig. 5. A calculation of the highest heating rate is then made taking into account only the linear part of curves. Details of the calculated heating rates and products yields obtained from experiments are given inTable 3. The temperature profiles curves show that the heating rate ranges from 2 to 14!C s 1at the final pyrolysis tem
perature of 550!C, and from 2 to 100 !C s 1at the final pyrolysis
temperature of 1000!C. The response time of temperature mea surement system was characterized by introducing the thermo couple alone and the thermocouple placed in the refractory wool without bio oil sample introduced together inside the reactor in 0.03 min. The results are also plotted inFig. 5. At 1000!C we can notice that the response of the thermocouple and refractory wool does not exceed 100!C s 1. This means that the actual heating rate
for the sample introduced in 0.03 min may be still higher than 100!C s 1. This is further illustrated onFig. 6.
In order to highlight the effect of heating rate and final temper ature on the yields of char, they were plotted inFig. 6 with the heating rate as the x scale, using a log scale. The low heating rate experiments, gave higher yields of char. Char yield than decreased significantly: from 14.4 wt.% down to 10.5 wt.% when heating rate increased from 2 to 14!C s 1at the final temperature of 550!C,
and from 11.5 to 3.8 wt.% when heating rate was increased from 2 to 100!C s 1at the final temperature of 1000!C.
In order to increase still the heating rate and reach the flash pyrolysis conditions, we have performed additional experiments in the EFR. This process allows achieving very high heating rate. In deed it is shown that when a particle or droplet is transported by a cold spraying gas, its heating rate is controlled by mixing of the cold gas with the hot gas in the reactor. CFD modeling was used and derived this order of magnitude. Heating rate estimated at 2000!C s 1 [17]. In these conditions, the char yield measured is Fig. 3. Product yield of bio-oil pyrolysis in HTR – effect of temperature.
Fig. 4. Gas yield of bio-oil pyrolysis in HTR – effect of temperature.
Fig. 5. Temperature evolution of the sample during bio-oil pyrolysis in HTR at different heating rates and two final temperatures. (a) 550!C, (b) 1000 !C.
Table 2
Composition of ashes (from combustion of wood) [wt.%, dry ashes].
Ca K Mn Mg P Ni Na Al
very low: <1 wt.%. As can be seen inFig. 6the char yield obtained with EFR is in rather good agreement with the values obtained in HTR and extrapolated to high heating rates. This result is in agree ment with the work carried out by van Rossum et al.[12]. They found that small droplets (undergoing high heating rate) are much
quicker evaporated and give much less char compared to larger droplets (undergoing low heating rate).
Globally from all the data collected, the char yield depends very much on the heating rate, and less on the final temperature, con firming the observation from section 3 1. These results give important information for understanding the pathways occurring during gasification of bio oil in reactors such as EFR: the amount of char formed by pyrolysis and submitted to subsequent steam gasification reactions will be very low whereas the main reactions will occur in the gas phase (reforming, partial oxidation, etc.). Con sidering that solid gasification is rate limiting, this might be an advantage of using bio oil instead of biomass as feedstock for EFR gasification.
Fig. 7shows the effect of heating rate on the product yields at two final pyrolysis temperatures. There is no apparent impact of the heating rate but a drastic influence of the temperature on the total gas yield which remains at about 13 14 wt.% and 40 43 wt.% at 550!C and 1000 !C, respectively.
On the other hand, we can notice that the total condensate yield increased when the heating rate increased and when the final tem perature decreased. A maximum value of 76 wt.% is obtained at 14!C s 1and a final temperature of 550!C, which is about 5 wt.%
higher than that obtained at 2!C s 1. In the same manner, at
1000!C the total condensate yield increased with the heating rate, up to 53.4 wt.% at 100!C s 1. This value was about 6 wt.% higher
than that of 2!C s 1.
All these trends can be summarized and explained as follows. Pyrolysis inside the sample: The volatile matters yield increases with the heating rate of bio oil, to the detriment of the char yield as reported earlier. The primary volatiles may undergo secondary reactions through two competitive pathways[18,19]:
re polymerizing to form char;
cracking to form lighter volatiles which implies less tar re polymerization.
The re polymerization pathway is probably favored by lower heating rates. Indeed, low heating rates lead to longer volatiles res idence times inside the sample, and favor secondary reactions of re polymerization to form solid residue. These conditions are known to favor the formation of secondary char from biomass pyrolysis experiments[18]and apparently, this could be extended to the case of bio oil pyrolysis.
Gas phase reactions outside the sample: Once the volatiles have escaped from the sample, they can undergo additional secondary gas phase cracking reactions as previously presented. The conver sion rate of this reaction highly increases with the gas temperature, leading to higher gas yields to the detriment of condensates. This result is in agreement with number of pyrolysis works carried out on biomass[19].
Table 3
Product yield of bio-oil pyrolysis at different temperatures and heating rates.
t(min)a Heating rate (!C s 1) Solid (wt.%) Total gas (wt.%) Condensate (wt.%)
Pyrolysis at 550!C 16 2 14.4 14.1 71.4 8 5 12.4 13.7 73.8 4 10 11.4 13.3 75.2 0.03 14 10.5 13.3 76.0 Flash >2000 1.2 13.6 85.1 Pyrolysis at 1000!C 16 2 11.5 41.6 46.8 8 5 10.4 41.7 47.8 4 14 8.6 40.9 52.2 0.03 100 3.8 43.8 53.4 Flash >2000 0.9 40.3 58.7
aDuration of sample introduction in the reactor.
Fig. 6. Char yield obtained from pyrolysis of bio-oil at two final temperatures: 550!C and 1000 !C – effect of heating rate.
Fig. 7. Product yield obtained from bio-oil pyrolysis at two final temperatures. (a) 550!C, (b) 1000 !C – effect of heating rate.
Let as notice that due to the procedure described, higher heat ing rate leads to lower residence time of tars in the hot zone be cause the bio oil sample is introduced more rapidly to the centre of the heated zone. The estimate of the gas residence time in the HTR was calculated, from their release at the sample position (which varies with time according to the duration of sample intro duction) to the exit of the reactor. It varies from 8 to 16 s at 550!C and from 5 to 10 s at 1000!C.
3.3. Effect of ash content
Crude bio oil containing 0.05 wt.% of minerals and crude bio oil with 3 wt.% of added ash were pyrolysed to highlight effect of min erals on pyrolysis process. The added ash are prepared by burning crushed beech wood (particle size of 300 400
l
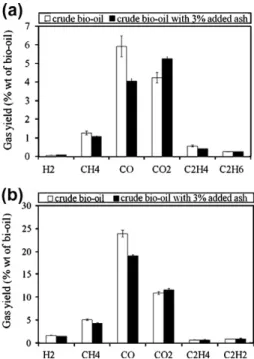
m) in a furnace equipped with 3 drawers at 600!C. The choice of this temperature is designed to perform a ‘‘mild’’ heat treatment in order to preserve the properties of minerals present in biomass and keep the same properties as in the case of the production of bio oil by pyrolysis of wood. The wood is distributed in the drawers on a thin layer of 1.5 cm thickness to ensure good heat transfer and air diffusion. Air was fed to the reactor at low flow rate, 30 NL h 1, to avoid ignition and high temperature rapid combustion of wood. The analysis of the elements most cited in literature was performed on the ashes resulting from this combustion, by ICP OES (Inductively Cou pled Plasma optical emission spectrometry). The results of the main elements are presented in Table 2. Logically for biomass ash Ca, K, Mg and Mn are present in high concentrations. Products yields obtained in experiments are listed inFig. 8. The results are expressed as a percentage of products on an added ash free basis. At 550!C, we can notice that when the amount of ash is increased in bio oil, the char yield increased significantly from 14.5 to 18.5 wt.% and both gas and tar yields reduced. The total gas yield decreased from 12.2 to 11.1 wt.% and tar decreased from 73.3 to 70.4 wt .% as can be seen inFig. 8a.
Meanwhile, increasing the amount of ash in bio oil shows a great influence on gas product components as indicated inFig. 9. Among them, CO2 content increased from 4.2 to 5.2 wt. while
wt.% CO content decreased significantly, from 5.9 to 4.0 wt.%. Also
a slight decrease of other gases is observed in particular CH4and
C2H4. These phenomena can probably be explained by the catalytic
effect of ash, which can favor polymerization reactions. These reac tions lead to the formation of larger quantity of solid residue and result in decrease of the amount of gas. The same conclusions are also valid for the case of pyrolysis at 1000!C (Figs. 8b and9b).
4. Conclusions
Experiments of pyrolysis have been carried out on bio oil at dif ferent heating rates and different final temperatures. Two different devices have been used in order to cover a wide range of heating rates.
The yields of gas/condensate/char were determined after pyro lysis. They were 12/73/14 wt.% at 550!C with gas residence time of 8 s, and 43/47/9 wt.% at 1000!C with gas residence time of 5 s. The composition of the obtained gas was established at the two final temperatures.
The heating rate of bio oil has little impact on the gas yield, but plays a major role on the char yield. This later decreases from 11 wt.% with a heating rate of 2!C s 1down to 1 wt.% only for flash
heating rate of 2000!C s 1at final temperature of 1000!C. At very
high heating rate the char yield depends less on the final temper ature. These results show that for an EFR type gasification process the quantity of formed char is very small, but will require either complete gasification or removal from the gas produced by the gasifier.
Additional pyrolysis runs performed on wood bio oil added with 3 wt.% of ash gave some interesting results:
(i) Ash increased the yield of solid products greatly and decreased the yield of gaseous products. Liquid yield undergoes no dramatic change. Ash seems to favor polymerization reactions leading to the formation of char.
(ii) Ash clearly affects the gas composition. When ash is added CH4and CO yields decrease, while CO2yield increases.
Fig. 8. Product yield of bio-oil pyrolysis at two final temperatures. (a) 550!C, (b)
1000!C – effect of ash content. Fig. 9. Gas yield of bio-oil pyrolysis at two final temperatures. (a) 550!C, (b) 1000!C – effect of ash content.
Acknowledgements
The authors gratefully acknowledge the financial support from Ener Bio Program of Foundation Tuck France, and express their gratitude to Mr. Bernard AUDUC technician in Ecole des Mines d’Albi Carmaux for his assistance and contribution to device design and operation.
References
[1] Goyal HB, Diptendu S, Saxena RC. Bio-fuels from thermochemical conversion of renewable resources: a review. Renew Sust Energy Rev 2008;12:504–17. [2] Wornat M J, Porter BG, Yang NYC. Single droplet combustion of biomass
pyrolysis oils. Energy Fuel 1994;8:1131–42.
[3] Shaddix CR, Huey SP. Combustion characteristics of fast pyrolysis oils derived from hybrid poplar. In: Bridgwater AV, editor. Developments in thermochemical biomass conversion. London: Blackie Academic & Professional; 1997. p. 465–80.
[4] Calabria R, Chiariello F, Massoli P. Combustion fundamentals of pyrolysis oil based fuels. Exp Therm Fluid Sci 2007;31:413–20 [ISSN 0894–1777]. [5] Ba T, Chaala A, Pérez MG, Rodrigue D, Roy C. Colloidal properties of bio-oils
obtained by vacuum pyrolysis of softwood bark. Characterization of water soluble and water-insoluble fractions.. Energy Fuel 2004;18:704–12. [6] Ba T, Chaala A, Pérez MG, Roy C. Colloidal properties of bio-oils obtained by
vacuum pyrolysis of softwood bark. Storage stability. Energy Fuel 2004;18:188–201.
[7] Branca C, Di Blasi C. Multistep mechanism for the devolatilization of biomass fast pyrolysis oils. Ind Eng Chem Res 2006;45:5891–9.
[8] Branca C, Di Blasi C, Elefante R. Devolatilization of conventional pyrolysis oils generated from biomass and cellulose. Energy Fuels 2006;20:2253–61. [9] Branca C, Di Blasi C, Russo C. Devolatilization in the temperature range 300–
600 K of liquids derived from wood pyrolysis and gasification. Fuel 2005;84:37–45.
[10] Branca C, Di Blasi C, Elefante R. Devolatilization and heterogeneous combustion of wood fast pyrolysis oils. Ind Eng Chem Res 2005;44:799–810. [11] Hallett WLH, Clark NAA. Model for the evaporation of biomass pyrolysis oil
droplets. Fuel 2006;85:532–44.
[12] Van Rossum G, Güell BM, Balegedde Ramachandran RP, Seshan K, Lefferts L, Van Swaaij WPM. Evaporation of pyrolysis oil: Product distribution and residue char analysis. AIChE Journal 2010;56:2200–10.
[13] Chhiti Y, Salvador S, Commandre JM, Broust F, Couhert C. Wood bio-oil non catalytic gasification: influence of temperature, dilution by an alcohol and ash content. Energy Fuels 2011;25:345–51.
[14] Mani T, Murugan P, Abedi J, Mahinpey N. Pyrolysis of wheat straw in a thermogravimetric analyzer: effect of particle size and heating rate on devolatilization and estimation of global kinetics. Chem Eng Res Des 2010;88:952–8.
[15] Ayllo9n M, Aznar M, Sánchez JL, Gea G, Arauzo J. Influence of temperature and heating rate on the fixed bed pyrolysis of meat and bone meal. Chem Eng J 2006;121:85–96.
[16] Haykiri-Acma H, Yaman S, Kucukbayrak S. Effect of heating rate on the pyrolysis yields of rapeseed. Renew Energy 2006;31:803–10.
[17] Van de Steene L, Salvador S, Charnay G. Controlling powdered fuel combustion at low temperature in a new entrained flow reactor. Combust Sci Technol 2000;159:255–79.
[18] Zaror CA, Hutchings IS, Pyle DL, Stiles HN, Kandiyoti R. Secondary char formation in the catalytic pyrolysis of biomass. Fuel 1985;64:990–4. [19] Seebauer V, Petek J, Staudinger G. Effects of particle size, heating rate and
pressure on measurement of pyrolysis kinetics by thermogravimetric analysis. Fuel 1997;76:1277–82.