HAL Id: hal-02932072
https://hal.archives-ouvertes.fr/hal-02932072
Submitted on 7 Sep 2020
HAL is a multi-disciplinary open access
archive for the deposit and dissemination of
sci-entific research documents, whether they are
pub-lished or not. The documents may come from
teaching and research institutions in France or
abroad, or from public or private research centers.
L’archive ouverte pluridisciplinaire HAL, est
destinée au dépôt et à la diffusion de documents
scientifiques de niveau recherche, publiés ou non,
émanant des établissements d’enseignement et de
recherche français ou étrangers, des laboratoires
publics ou privés.
Dark chocolates organoleptic differences: a
PTR-ToF-MS success story
Zoé Deuscher, Isabelle Andriot, Etienne Sémon, Sylvie Cordelle, Pascal
Schlich, Marie Repoux, Jean-Michel Roger, Renaud Boulanger, Hélène
Labouré, Jean-Luc Le Quéré
To cite this version:
Zoé Deuscher, Isabelle Andriot, Etienne Sémon, Sylvie Cordelle, Pascal Schlich, et al.. Dark chocolates
organoleptic differences: a PTR-ToF-MS success story. The 8th International Conference on Proton
Transfer Reaction Mass Spectrometry and its Applications, Feb 2019, Innsbruck, Austria. pp.83-86.
�hal-02932072�
Dark chocolates organoleptic differences: a PTR-ToF-MS
success story
Zoé Deuscher1,5, Isabelle Andriot1,2, Etienne Sémon1,2,Sylvie Cordelle1,2, Pascal Schlich1,2, Marie Repoux3, Jean-Michel Roger4, Renaud Boulanger5, Hélène Labouré1 and
Jean-Luc Le Quéré1
1
Centre des Sciences du Goût et de l’Alimentation (CSGA), AgroSup Dijon, CNRS, INRA, University of Bourgogne Franche-Comté, Dijon, France, [email protected]
2
ChemoSens Platform, CSGA, Dijon, France
3
Valrhona, Tain-l’Hermitage, France
4
UMR ITAP, IRSTEA, Montpellier, France
5 UMR QUALISUD, CIRAD, Montpellier, France
Abstract
Aroma of dark chocolate depends on process and cocoa origin and variety. Repeated sensory analyses of standardized chocolates produced from various cocoa beans batches using a standard fabrication process allowed classifying them into four sensory categories. These categories were confirmed in a PTR-ToF-MS analysis of the volatilome of 206 chocolate samples through supervised multivariate data analyses (PLS-DA). Variable selection using dedicated methods pinpointed some volatile compounds important for the discrimination of the chocolates. Moreover, the nosespace of a subset of chocolates was measured by twelve assessors using PTR-ToF-MS with simultaneous determination of their sensory temporal profile (Temporal Dominance of Sensations methodology, TDS) to better explain the sensory categorization at a perception level. The two sets of data were analysed conjointly by defining an index of abundance of each detected aroma compound while a given attribute was dominant: the Abundance While Dominance (AWD) index. Through correspondence analyses (CA) of these AWD indices some relationships between certain aroma compounds and the sensory attributes expected to be related to them were found.
Introduction
Based on a quantitative descriptive analysis (QDA) conducted by an internal trained panel rating 36 flavour attributes, it has been possible to categorize into four distinct sensory poles dark chocolates of diverse cocoa origins and cultivars, but manufactured using the same standard process at pilot level at an industrial plant. This categorization of ‘standard’ dark chocolates into the four sensory poles is the basis of a quality control procedure for defining the ultimate use of dried fermented cocoa beans batches upon reception at the factory. Therefore, the main objective of this study was to investigate the potentiality of PTR-MS to predict these aroma-based sensory categories. For this, the headspace of 206 dark chocolate samples representative of the four sensory poles was analysed using a PTR-ToF-MS in direct introduction mode and the resulting VOCs MS-based fingerprints submitted to multivariate data analyses. Moreover, a subset of 8 representative chocolates was submitted to a nosespace analysis using the PTR-ToF-MS
instrument with simultaneous sensory temporal profiles determination using TDS in the aim to better explain the chocolates sensory categorization at a molecular and perception level.
Experimental Methods
All the experiments were conducted with a PTR-ToF-MS instrument (PTR-ToF 8000, Ionicon Analytik GmbH, Innsbruck, Austria) with H3O+ as reagent ion. The drift-tube parameters were fixed as follows: Pdrift 2.3 mbar, Tdrift 80°C, Udrift 480 V resulting in an E/N value of 111 Td (1 Td
= 10-17 V.cm2). Mass spectra were acquired at a scan speed of 0.5 s (headspace) or 0.1 s (nosespace) for the mass range m/z 0-250.
Chocolates samples
Chocolate samples (n = 206), produced in an industrial pilot plant using the same ‘standard’ transformation process with the same mass of cocoa from different origins and varieties, of sugar, of soy lecithin and of vanillin were retained for this study as being representative of four sensory categories, named ‘sensory poles’, previously determined on a QDA basis systematically conducted on ‘standard’ chocolates. For the headspace study 52 chocolates were evaluated to belong to the sensory pole 1, 47 to pole 2, 55 to pole 3, and 52 to the pole 4. For nosespace, 8 samples were selected from the 206 (2 representative ones per sensory pole).
Data collection and analysis
The chocolates volatilomes (in triplicates) were collected at 36.2°C using an experimental setup that allowed analysing sequentially the background zero air, the sample and the mass calibrant according to [1]. The data converted into concentration (ppbV) were expressed in areas under the curve (AUCs) calculated for an analysis window of 120 s starting from the moment when the sample headspace entered the instrument. After background subtraction and elimination of source ions, water clusters, compounds isotopologues and peaks below their LOQ, the final data matrix contained 143 ions and it was used for supervised (PLS-DA) multivariate data analyses (MATLAB packages) [1].
For each of the selected 8 samples, simultaneous nosespace and TDS data were recorded in triplicates by 12 assessors using a nosepiece device according to [2]. The two sets of data were analysed conjointly by defining an index of abundance of each detected aroma compound (35 were measured with a significant S/N ratio) while a given attribute was dominant: the Abundance While Dominance (AWD) index [2]. The resulting AWD contingency tables were used for correspondence analyses (CA) conducted for each chocolate sample (Statistica software).
Results and discussion
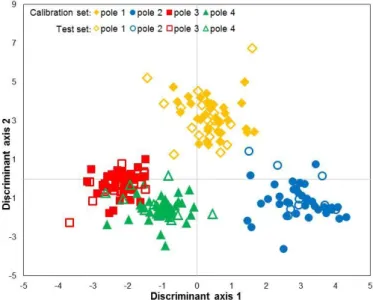
In order to evaluate the possibility to predict the chocolate sensory poles on the basis of the PTR-ToF-MS data, a supervised classification model (PLS-DA) was employed. Specifically, the retained method consisted of i) regressing the categorical response Y (the 4 poles to be predicted) on X (206 samples, 143 ions) by using PLS, ii) applying a discrimination approach (LDA) on PLS-predicted scores and iii) classifying new samples (test samples) using the previously chosen discrimination model [1]. The first two dimensions of the PLS-DA score plot evidenced a good discrimination between the four sensory poles (Figure 1). Along the discriminant axis 1, the poles 1 and 2 were well discriminated from each other, as well as from poles 3 and 4 whose scores presented a partial but moderate overlap. However, samples from poles 3 and 4 were well separated along the discriminant axis 3 (not shown). Moreover, in each pole the calibration and the test sets were very close with test scores found in good accordance with calibration scores (no bias, no spreading) showing a good performance of the prediction model. Furthermore, the
confusion matrix of the test set generated by the LDA (Table 1) confirmed the quality of the prediction model since nearly 97 % of the test samples were correctly assigned in the sensory poles.
Figure 1: Score plot (discriminant axes 1 vs 2) of the PLS-DA conducted on the matrices X (206 samples, 143 ions) and Y (the 4 poles to be predicted). The calibration set included 146 samples and the test set 62 samples.
Only two samples were not correctly predicted: one belonging to pole 2 was predicted in pole 1 and one sample belonging to pole 3 was assigned to pole 4 (Table 1).
Table 1: Confusion matrix on the test set generated by the PLS-DA. Real classes 1 2 3 4 Predicted classes 1 18 1 0 0 2 0 11 0 0 3 0 0 18 0 4 0 0 1 13
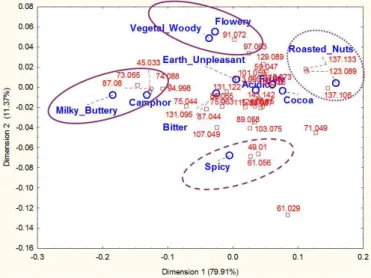
To better explain the sensory categorization at a perception level, a combined nosespace-sensory evaluation study was undertaken. The dynamics of perception have been considered only scarcely in comparison to nosespace measured simultaneously by on-line mass spectrometry. TDS is able to dynamically capture multidimensionality of perception. The obtained TDS curves clearly differentiated the chocolates that were regrouped by sensory categories as revealed by a principal component analysis (PCA). Computation of the AWD indices at individual level allowed to statistically assess the differences between the products over subjects and replicates and assessed statistically the relationships between the two sets of data. Through correspondence analyses (CA)
some relationships between certain aroma compounds and the sensory attributes expected to be related to them were found (see Figure 2 for an example). For instance, the Roasted_Nuts and Cocoa descriptors were found in good correspondence with the ions m/z 137.106 and m/z 123.089 attributed to substituted pyrazines (Figure 2).
Figure 2: Correspondence analysis of AWD scores of one chocolate sample (35 ions, 11 descriptors). 2 = 6736, df = 340, p < 0.0001
Conclusion
PTR-ToF-MS analyses of the volatilome of dark chocolates have been used successfully for classification of samples that were previously assessed by sensory evaluation in four distinct categories. A classification model has been constructed that presented excellent prediction capability, and discriminant ions have been characterized through dedicated selection methods. Pairing nosespace with Temporal Dominance of Sensations evaluation of dark chocolates categorized in four sensory groups provided meaningful data that could be analysed at individual level thanks to the AWD indices. Descriptive multivariate analyses of these AWD indices gave interesting clues on the relationships between the aroma compounds released in mouth and their expected perceived sensory attributes.
References
[1] Z. Deuscher, I. Andriot, E. Sémon, M. Repoux, S. Preys, J.-M. Roger, R. Boulanger, H. Labouré and J.-L. Le Quéré. Volatile compounds profiling by using Proton Transfer Reaction – Time of Flight – Mass Spectrometry (PTR-ToF-MS). The case study of dark chocolates organoleptic differences. J. Mass Spectrom., doi:10.1002/jms.4317, (2018).
[2] P. Schlich, A. Thomas, M. Visalli, D. Labarre, E. Sémon and J.-L. Le Quéré. Collecting and analysing in vivo aroma release and perception by pairing nosespace PTR-ToF-MS and Temporal Dominance of Sensations. in Flavour Science: Proceedings of the XIV Weurman Flavour Research Symposium (Eds.: A. J. Taylor, D. S. Mottram), Context Products Ltd., Leicestershire (UK), pp. 327-332, (2015).