Publisher’s version / Version de l'éditeur:
Proceedings of the 15th IBPSA Conference, August 7-9, 2017, San Francisco,
CA, USA, pp. 394-402, 2017-08-09
READ THESE TERMS AND CONDITIONS CAREFULLY BEFORE USING THIS WEBSITE. https://nrc-publications.canada.ca/eng/copyright
Vous avez des questions? Nous pouvons vous aider. Pour communiquer directement avec un auteur, consultez la première page de la revue dans laquelle son article a été publié afin de trouver ses coordonnées. Si vous n’arrivez pas à les repérer, communiquez avec nous à [email protected].
Questions? Contact the NRC Publications Archive team at
[email protected]. If you wish to email the authors directly, please see the first page of the publication for their contact information.
NRC Publications Archive
Archives des publications du CNRC
This publication could be one of several versions: author’s original, accepted manuscript or the publisher’s version. / La version de cette publication peut être l’une des suivantes : la version prépublication de l’auteur, la version acceptée du manuscrit ou la version de l’éditeur.
Access and use of this website and the material on it are subject to the Terms and Conditions set forth at
The effect of zone level occupancy characteristics on adaptive controls
Gunay, Burak; O'Brien, William; Beausoleil-Morrison, Ian; Shen, Weiming;
Newsham, Guy; Macdonald, Iain
https://publications-cnrc.canada.ca/fra/droits
L’accès à ce site Web et l’utilisation de son contenu sont assujettis aux conditions présentées dans le site LISEZ CES CONDITIONS ATTENTIVEMENT AVANT D’UTILISER CE SITE WEB.
NRC Publications Record / Notice d'Archives des publications de CNRC:
https://nrc-publications.canada.ca/eng/view/object/?id=22bb315d-0b4e-427e-80a5-b1f1444289ab https://publications-cnrc.canada.ca/fra/voir/objet/?id=22bb315d-0b4e-427e-80a5-b1f1444289abThe effect of zone level occupancy characteristics on adaptive controls
H. Burak Gunay1,2, William O’Brien2, Ian Beausoleil-Morrison3, Weiming Shen2, Guy Newsham2, Iain Macdonald2 1Civil and Environmental Engineering, Carleton University, Ottawa, Canada
2Construction Portfolio, National Research Council, Ottawa, Canada 2Mechanical and Aerospace Engineering, Carleton University, Ottawa, Canada
Abstract
The objective of this paper is to examine the energy and comfort impact of the HVAC equipment granularity in offices through building performance simulation. To this end, the occupancy data gathered from 37 private offices in Ottawa, Canada were analysed. For each occupant, four parameters that play an important role over the HVAC operation were extracted. These parameters are the earliest expected arrival time, the latest expected departure time, the latest expected arrival time, and the longest expected duration of intermediate vacancy. Through random sampling from the 37 occupants, hypothetical zones with varying numbers of occupants were created, and EnergyPlus simulations were conducted. Results indicate that the earliest expected arrival time in one-person zones is on average two hours later than it is in twelve-person zones. Similarly, the latest expected departure time in one-person zones is on average two hours earlier than it is in twelve-person zones. Heating and cooling energy use with adaptive occupancy-based temperature setback scheduling in one-person zones is estimated to be 20% less than it is in twelve-person zones.
Keywords: Occupancy; HVAC; Energy use; Adaptive controls
Introduction
More than 25% of North American workforce reports having the ability to change their arrival and departure times for work (McMenamin 2007; Zeytinoglu et al. 2009). As a result, personal preferences and habits translate into diverse zone level occupancy profiles. Some occupants prefer to arrive as early as 5 am and others as late as 12 pm (Kelly et al. 2011) and occupancy may even extend to weekends and holidays (Sun et al. 2014). Mahdavi et al. (2008) monitored 48 offices in different types of buildings: a university building, a large office complex, and a government building. In all office types, it was found that the workstations were unoccupied at least half of the time, and the occupancy differed significantly from one office space to another. Similar observations were reported in other studies (Wang et al. 2005; Davis III and Nutter 2010; Gunay 2016; Gunay et al. 2016).
Inter-occupant diversity in occupants’ presence patterns plays an important role on zone temperature setback and air-handling unit (AHU) on-off scheduling decisions, and thus on energy use and comfort. Operators tend to
avoid complaints, control technicians tend to program conservatively long operating hours (Gunay et al. 2015). As a result, a significant portion of the energy use in commercial buildings is dedicated to conditioning unoccupied spaces (Masoso and Grobler 2010; Gunay 2016).
In several studies, opportunities to learn from recurring occupancy patterns using various sensor networks and adapt heating, ventilation, and air-conditioning (HVAC) equipment schedules accordingly were investigated (i.e., auto-scheduling, adaptive controls) (Agarwal et al. 2010; Yang and Gerber 2014; Yang and Becerik-Gerber 2014; D’Oca and Hong 2015; Gunay et al. 2015; Gunay 2016). These studies demonstrated that substantial energy savings can be achieved by applying localized comfort conditions based on individual occupancy schedules, particularly in intermittently used spaces. However, as the number of workers using the offices in a thermal zone increase, the probability that the zone remains occupied for longer periods will increase. Optimal zone temperature setback and AHU on-off scheduling decisions become dependent on the granularity of primary and secondary HVAC equipment. This calls the potential of occupancy-learning adaptive controls in multi-occupant spaces into question.
The objective of this paper is to better understand the energy and comfort impact of HVAC equipment granularity in office buildings. To this end, the occupancy data gathered from 37 private office spaces were analysed. Hypothetical zones at varying numbers of occupants were created by randomly sampling from this occupant population. Consequently, each of these zones attained different occupancy characteristics relevant to HVAC controls (e.g., earliest expected arrival and latest expected departure times). EnergyPlus simulations were conducted for each of these random occupancy and corresponding HVAC equipment scheduling scenarios. The energy-savings potential of the occupancy-learning adaptive controls was reported at varying zone sizes. HVAC equipment granularity recommendations were developed for the design of new office buildings.
Analyses of the occupancy data
The dataset includes motion detector measurements from 37 private office spaces from two different academic office buildings in Ottawa, Canada. The data were collected for one year in 13 of the offices and for nine months in 24 of the offices. Of these offices, ten were
used by full-time staff with administrative duties. The rest were full-time faculty members. Note that the faculty members had flexible work schedules interrupted with irregular absences as they were also engaged in work outside their offices (e.g., meetings, conferences, teaching, and work from home). The administrative staff had relatively more rigid work schedules.
Each of the 37 offices had a commercial thermostat integrated to the same building automation system (BAS). Each thermostat contained a passive-infrared (PIR) motion sensor (5 m range and 100° horizontal and 80° vertical coverage). The PIR motion sensors’ movement detections were collected per event basis and stored in a commercial BAS archiver. The occupancy data records in each room were generated from the movement detections using the adaptive time delay algorithm (Nagy et al. 2015). The principle behind the adaptive time delay algorithm to generate occupancy data records from PIR motion sensors was introduced in Nagy et al. (2015); and its appropriateness was verified against a ground-truth occupancy data record Gunay et al. (2016). Although it is likely that there were brief periods with more than one occupant in these offices (e.g., meetings), the primary users of these offices were assumed to be present at all times where at least one occupant was detected. Therefore, the occupancy data records from these 37 private offices were assumed to represent 37 different individuals. Note that visits shorter than 30 min between 12 am and 4 am were attributed to the cleaning staff, and corresponding data were discarded from the data records.
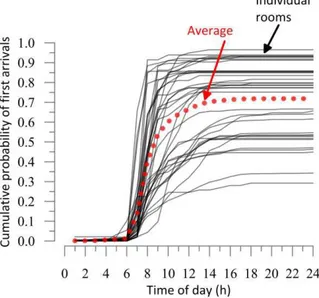
Figure 1: Cumulative probability of observing a first arrival on a weekday for the 37 occupants. The likelihoods at midnight do
not reach one because of the absent weekdays.
Time of the first arrival and last departure events for each occupied weekday were extracted from individual occupancy data records. Figure 1 presents the cumulative likelihood of observing a first arrival on a weekday. For all of the occupants, the probability of observing the first arrival on a weekday before 6 am was
negligible. The probability of observing a first arrival on a weekday was between 0.30 and 0.95 (on average 0.70). In other words, the ratios of absent weekdays were between 0.05 and 0.70 (on average 0.30) (see Figure 2). For most occupants the last departures exhibit a bimodal behaviour Figure 3. The occupants tend to depart either earlier than 12 pm or later than 4 pm. On average, 90% of the last departures took place before 7 pm. However, this value ranged from 4 pm to 8 pm for different individuals. It is worth mentioning that the temperature setback schedule in the buildings from which the occupancy data were gathered ranges from 10 pm to 6 am. This underlines the potential to reduce HVAC equipment operation hours substantially upon high fidelity occupancy data information.
Figure 2: Ratio of absent weekdays for the 37 occupants.
Figure 3: Cumulative probability of observing a last departure on a weekday for the 37 occupants.
Figure 4: The probability that an intermediate vacancy period lasts longer than a given period (e.g., lifetime of a break).
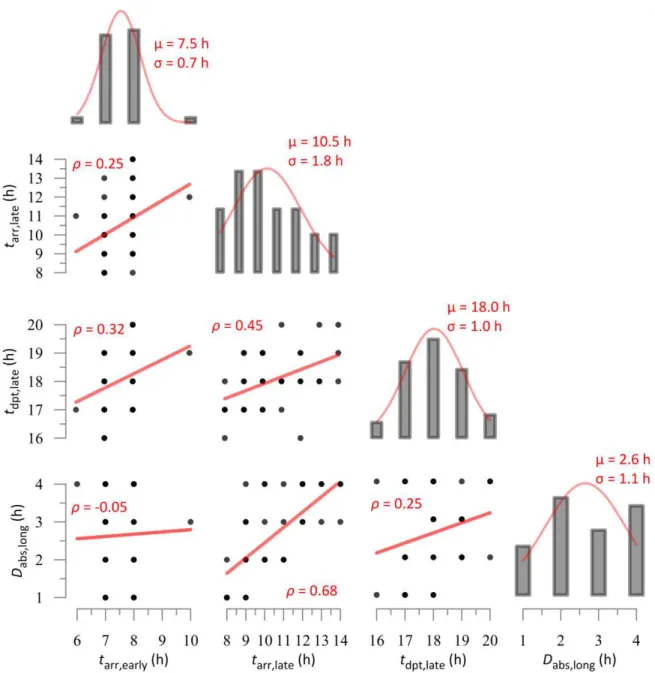
Figure 5: The relationship among the occupancy parameters of different individuals: earliest expected arrival time (tarr,early), latest
expected arrival time (tarr,late), latest expected departure time (tdpt,late), and longest expected duration of intermediate break (Dabs,long). The Pearson correlation coefficients (ρ) are annotated on the scatter plots, and the mean (μ) and standard deviation (σ) of the
parameters are annotated on the histogram plots.
Figure 4 presents 37 survival plots predicting the lifetime of an intermediate vacancy (break) period for the monitored occupants. Results indicate that on average 90% of the intermediate breaks last shorter than 2 h. From one occupant to another, this value varied between 1 and 4 h.
Adaptive occupancy-learning controls
Modern energy standards and codes (e.g., NRC 2015; ASHRAE 2016) encourage the use of occupancy sensors in new construction office buildings. As a result, real-time zone level occupancy information is available in the control network databases of many buildings. By using the real-time zone-level occupancy information, the adaptive occupancy-learning control (Gunay 2016) puts forward four key occupancy parameters with utmost
importance for HVAC equipment scheduling: the earliest expected arrival time (tarr,early), latest expected arrival time (tarr,late), latest expected departure time (tdpt,late), and the longest expected duration of intermediate absence (Dabs,long).
On weekdays, it applies temperature setback under four different conditions: (1) if current time is earlier than
tarr,early, (2) if current time exceeds tarr,late and the occupant has not arrived yet, (3) if current time exceeds tdpt,late, and (4) if the zone is vacated for longer than Dabs,long. In this study, an expected occupancy event (arrival, departure, breaks) is defined as an event with over 90% chance of occurrence. For example, if tdpt,late is 6 pm, it means that there is less than 10% chance to observe a departure after 6 pm. Similarly, if D is 3 h, it means that there
is less than 10% chance to observe an intermediate break longer than 3 h.
Each of the 37 occupants of the current study had a unique set of these four parameters. Figure 5 presents the correlation of individuals’ occupancy characteristics in terms of these four parameters. The positive correlation between tarr,early and tdpt,late indicates that those who arrive early tend to depart early. It appears that the earliest arrival habits exhibit no relationship with the choices of duration of intermediate breaks. Somewhat surprisingly, those who have late arrival habits tend to take longer intermediate breaks. Note that the relationships between these parameters play an important role on the overall zone occupancy characteristics. For example, if an individual with early arrival habits tends to depart earlier than others do, his placement in a zone will likely affect the optimal start of the HVAC equipment. However, if an individual with early arrival habits tends to depart later than others do, his placement in a zone will likely affect both optimal start and stop times of the HVAC equipment.
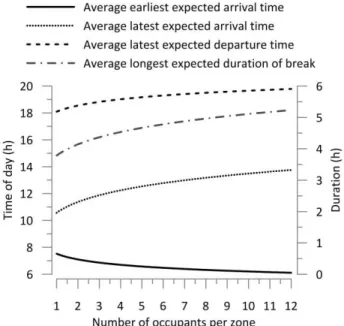
In many of the existing commercial buildings, multiple occupants share a terminal HVAC unit. In multi-occupant spaces, as the number of multi-occupants assigned per zone increases, the probability that a zone remains occupied for longer periods increases because those who have the earliest and latest arrival/departure habits will determine the overall zone occupancy characteristics. Figure 6 presents the influence of the number of zones available per occupant in terms of the four occupancy parameters (tarr,early, tarr,late, tdpt,late, Dabs,long). The results shown in Figure 6 were calculated by randomly selecting from the 37 occupants in groups of 12 to 1 – representing one zone per twelve occupants to one zone for each occupant. For each zone size, random sampling was repeated 250 times. This number was determined after ensuring that the sample populations attain repeatable characteristics. Meaning that when 250 groups of 12 individuals are formed by sampling from the parent 37 occupants ( 7), each time the process is repeated the mean and the variance of the four occupancy parameters remain relatively unchanged. Figure 6 present only the mean of these parameters. The results indicate that zone sizing substantially affects the occupancy characteristics. For example, on average, the earliest expected arrival time in a twelve-person zone is about two hours earlier than a one-person zone. Similarly, the latest expected departure time in a twelve-person zone appears to be two hours later than it is in zones comprising of private spaces. Consequently, the energy-savings potential of adaptive controls is expected to diminish in multi-occupant spaces as the uniqueness of the occupancy characteristics diminish.
Estimating energy-savings potential
To estimate the influence of zone sizing on the energy-savings potential of adaptive controls, EnergyPlus simulations were conducted. The EnergyPlus model represents 12 adjacent 3x3 m private office spaces with
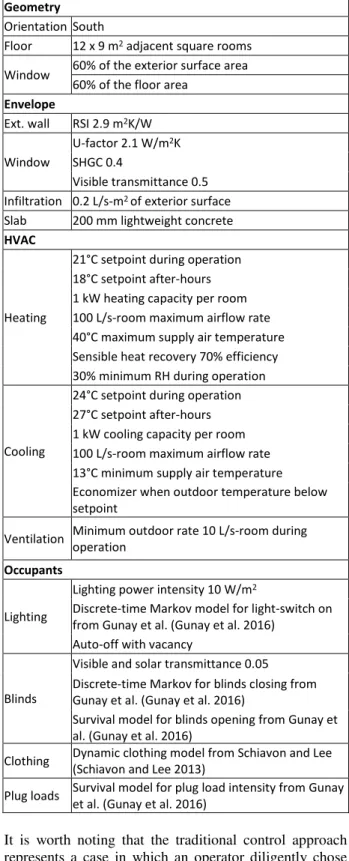
south-facing exterior windows and walls in Ottawa, Canada. Each of these offices was assumed to be used by a single occupant. The physical properties of the envelope and windows were selected in compliance with ASHRAE 90.1 (2016) for climate zone 6 (see Table 1). In line with the National Energy Code of Canada (NRC 2015), infiltration rates were assumed constant at a rate of 0.2 L/s-m2 (normalized with the exterior surface area). The heating and cooling were assumed to be provided by an ideal air-based HVAC system with practical limits applied to its capacity, airflow rate and supply air temperatures (see Table 1).
Figure 6: Impact of the number of thermal zones available per person on the five occupancy parameters.
Heating was modelled to be available from November to April, and cooling was assumed available for rest of the year. When the outdoor air temperature is advantageous for cooling, the supply airflow rate was increased to a maximum of 100 L/s-m2 per room (i.e., economizer cycle). For ventilation purposes, outdoor air was introduced at a rate of 10 L/s to each private room during scheduled operating hours. Sensible heat recovery at 70% efficiency was assumed to preheat the outdoor air, when needed. The relative humidity was maintained at a minimum of 30% (ASHRAE 2015). During the simulations, a standard weather year for Ottawa (CWEC 2015) was used. The simulation timestep size was 15 min.
Lighting power intensity was assumed 10 W/m2 (ASHRAE 2016). Occupants were modelled to be responsible for light switch-on and blinds use actions (see Figure 7). Stochastic behaviour models predicting these actions were previously developed by using the data gathered from a subset of the 37 occupants of this study (Gunay 2016; Gunay et al. 2016). At each occupied timestep, occupants decide whether to turn on their lights or not (see Figure 7.a), and the lights are set to switch off automatically during vacancy periods. Once every two timesteps, occupants decide whether or
not to close their blinds (see Figure 7.b). Once blinds are deployed, the survival model shown in Figure 7.c is used to predict the duration the blinds in a room remains closed. For simplicity, the blinds were permitted in two states only: open or closed. The plug-in office equipment usage in each room was modelled as shown in Figure 7.d. The plug loads during vacancy periods were selected as a function of the duration of absence. As a result, the plug loads during the intermediate breaks were similar to those during the occupied hours than after-hours and weekends. Note that each occupant is assigned to a unique set of behaviour models permitting him or her to undertake behaviours at different instances. As such, the blinds, lighting, and plug loads in each office were controlled in a unique manner. The occupant models were implemented by using the Energy Management System (EMS) application of EnergyPlus. Details about the data and methodologies used in developing and implementing these occupant behaviour models can be found elsewhere (Gunay 2016; Gunay et al. 2016; Gunay et al. 2016). Occupants’ clothing insulation levels were predicted using Schiavon and Lee (Schiavon and Lee 2013)’s model. The clothing level predictions were employed in thermal comfort calculations using Fanger (1970)’s model.
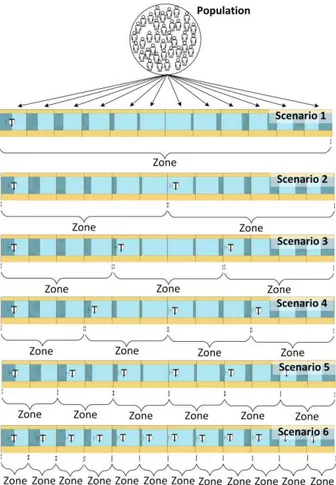
The EnergyPlus model was simulated to investigate the energy impact of thermal zoning on adaptive occupancy-learning controls and traditional controls. Six different thermal zoning scenarios were investigated: (1) heating and cooling in the twelve rooms were controlled through a single thermostat (one-zone model), (2) six adjacent rooms share a thermostat (two-zone model), (3) four adjacent rooms share a thermostat (three-zone model), (4) three adjacent rooms share a thermostat (four-zone model), (5) two adjacent rooms share a thermostat (six-zone model), and (6) each room has a separate thermostat controlling the terminal HVAC equipment. Figure 8 presents these six test scenarios. In each run case, 12 of the annual occupancy time-series data from the 37 occupants were randomly selected and assigned to one of the 12 rooms. Given the randomness inherent in this selection process, the simulations were repeated 250 times for each scenario. As mentioned earlier, this number was determined after a sensitivity study.
Recall that the adaptive control scenarios were designed to apply temperature setback during weekdays under four different conditions: (1) before the earliest expected arrival time in the zone (tarr,early), (2) after the latest expected departure time in the zone (tdpt,late), (3) on unoccupied days after the latest expected arrival time (tarr,late), (4) on occupied days after a break longer than the longest expected duration of intermediate vacancy (Dabs,long). As discussed earlier, the occupancy parameters (tarr,early,tdpt,late, tarr,late,Dabs,long) defining these setback conditions vary depending on the zone size (see Figure 6). During the weekends, the temperature setback was applied to all of the zones by default.
The six test scenarios were also studied by using a traditional weekday temperature setback approach. With
this control approach, the setbacks were applied before 6 am and after 8 pm on weekdays and on all weekends. These values were selected by looking at the earliest arrival and the latest departure habits of the 37 occupants of this study (Figure 6). In this traditional control approach, the temperature setback was also applied during the weekends.
Table 1: Characteristics of the EnergyPlus model.
Geometry
Orientation South
Floor 12 x 9 m2 adjacent square rooms
Window 60% of the exterior surface area 60% of the floor area
Envelope
Ext. wall RSI 2.9 m2K/W
Window
U-factor 2.1 W/m2K
SHGC 0.4
Visible transmittance 0.5 Infiltration 0.2 L/s-m2 of exterior surface
Slab 200 mm lightweight concrete
HVAC
Heating
21°C setpoint during operation 18°C setpoint after-hours 1 kW heating capacity per room 100 L/s-room maximum airflow rate 40°C maximum supply air temperature Sensible heat recovery 70% efficiency 30% minimum RH during operation
Cooling
24°C setpoint during operation 27°C setpoint after-hours 1 kW cooling capacity per room 100 L/s-room maximum airflow rate 13°C minimum supply air temperature Economizer when outdoor temperature below setpoint
Ventilation Minimum outdoor rate 10 L/s-room during operation
Occupants
Lighting
Lighting power intensity 10 W/m2
Discrete-time Markov model for light-switch on from Gunay et al. (Gunay et al. 2016)
Auto-off with vacancy
Blinds
Visible and solar transmittance 0.05 Discrete-time Markov for blinds closing from Gunay et al. (Gunay et al. 2016)
Survival model for blinds opening from Gunay et al. (Gunay et al. 2016)
Clothing Dynamic clothing model from Schiavon and Lee (Schiavon and Lee 2013)
Plug loads Survival model for plug load intensity from Gunay et al. (Gunay et al. 2016)
It is worth noting that the traditional control approach represents a case in which an operator diligently chose an operating schedule after analysing the occupancy
access to high-resolution occupancy information. And, consequently, they tend make more conservative decisions while selecting the operating hours. For example, the buildings from which the occupancy data were collected were scheduled to operate from 6 am to 10 pm including weekends and holidays.
Figure 7: Occupant behaviour models predicting the likelihood of (a) a light switch-on action in the next 15 min (Gunay et al. 2016), (b) a blinds closing action in the next 30 min (Gunay et al. 2016), (c) the survival probability of a blinds state over a time window (Gunay et al. 2016), and (d) plug load intensity
(Gunay et al. 2016).
Figure 8: Test scenarios for the EnergyPlus simulations. Scenarios represent a range of one thermal zone for twelve
private offices to one zone for each of the twelve private offices.
In brief, 3000 simulations were run for the six test scenarios with the adaptive and the traditional control approaches. To accommodate the large number of simulations needed in this study, through a scripting language the EnergyPlus IDF files were modified and executed automatically. Specifically, the parts automatically modified in the IDF files correspond to the EMS programs representing the control algorithms and the occupancy schedule files. Similar to the occupant behaviour models, the control algorithms were added to the EMS application of EnergyPlus. They were set to actuate the schedule objects controlling the temperature setpoints of the HVAC systems. These automatic interventions to the model were manually inspected by checking the models against a previous version of themselves after making changes in a subroutine to ensure that only intended changes actually resulted and by leaving internal dummy variables inside each if-then-else statement to analyse their response during the simulation.
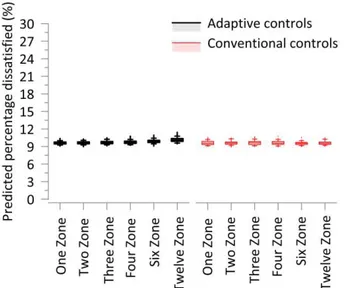
Before comparing the energy use intensity results of different zone sizes and control approaches, we computed the comfort metric predicted percentage dissatisfied (PDD) based on Fanger (1970)’s thermal comfort model. The results shown in Figure 9 indicate that the average PPD values during the occupied hours were about 10%. Meaning that the six zone sizing
scenarios and the control approaches appeared to achieve similar levels of comfort. The PPD values were observed to increase during the seasonal switchover to cooling and heating periods. In addition, a few occupants’ occasional weekend visits to their offices resulted in with higher PPD values. One of the main reasons why all test scenarios with the adaptive controls were able to achieve an acceptable thermal comfort performance (according to ASHRAE Standard 55 (2013)) is that occupancy parameters (tarr,early,tdpt,late, tarr,late,Dabs,long) were selected in accordance with the number and the characteristics of occupants using the zone. For the test scenarios with the traditional controls, the operating hours (6 am to 8 pm on weekdays) were also selected to meet the occupancy characteristics of the 37 occupants. In addition, all rooms had identical geometry, construction, and material properties. In reality, for practical reasons, HVAC engineers may create thermal zones encompassing rooms with different orientations and window-to-wall ratios. In these cases, discomfort issues can be exacerbated due to zone sizing. However, our objective was to create control scenarios that can achieve similar levels of comfort, so that their energy performance can be compared.
Figure 10 presents the heating and cooling energy use intensity with the six thermal zoning scenarios. Results indicate that thermal zoning significantly influences the energy-savings potential of adaptive controls. HVAC energy-savings by adaptive controls were estimated to be 27%, when each office is controlled by a unique set of terminal equipment. The savings potential reduces to 15, 13, 11, 9, and 7%, when the number of zones available per occupant reduces to ⁄ , ⁄ , ⁄ , 6⁄ and ⁄ , respectively. In addition, increasing the number of zones available per occupant reduces the variance (spread) of the energy outcomes with the adaptive occupancy-learning controls.
Figure 9: Predicted percentage of dissatisfied using Fanger’s comfort model. The x-axis labels indicate the number of zones
available for 12 occupants.
Figure 10: Effect of thermal zoning on the adaptive occupancy-learning controls and conventional controls. The median energy use intensity results are annotated on the figure. The
x-axis labels indicate the number of zones available for 12 occupants.
Because the HVAC operating schedules with the traditional control approach did not vary with the changing occupancy characteristics (from 6 am to 8 pm for all test scenarios), the energy use intensity did not change depending on the zone size. These results confirm that occupancy-learning adaptive control is most appropriate for cases in which terminal HVAC equipment is highly granular. However, it can still be an effective energy-saving strategy for many existing buildings with varying zone sizes. It is worth noting that adaptive occupancy-learning controls merely rely on the arrival and departure detections of an occupancy sensor. Recurring arrival and departure timing patterns can easily be learned inside a zone controller (Gunay 2016) or offline using archived occupancy data. Therefore, its implementation would only require a single type of sensor – and no capital cost in buildings with occupancy sensors. Because commercial occupancy sensors are motion detectors relying on occupants’ movements, they are prone to error when occupants are immobile (Newsham et al. 2015; Gunay et al. 2016). However, note that the adaptive controls primarily learn from the first arrival and last departure times, during which detectable movements are inevitably generated.
Unresolved issues
This study was conducted using the occupancy data gathered from two university buildings. Most occupants had flexible work schedules. The representativeness of the parent population limits the generalizability of the results of this study. Readers should be cautious in extending the results to other contexts.
The methodology employed in this paper assumes that people who share a thermal zone have independent schedules from each other. However, in reality, it is likely to see people with similar jobs and schedules to share a thermal zone.
In this study, it was assumed that operating schedules traditionally do not change with the number of zones available per occupant. However, in reality, it is likely
that occupancy patterns can implicitly influence an operator’s decision-making for both zone and system level HVAC equipment scheduling. They may be more inclined to schedule equipment for longer hours in bulkier zones – due to increased likelihood of occupancy. This raises another question on whether or not the energy codes and standards should credit buildings that can provide localized comfort conditions. Future research should investigate the relationship between the HVAC granularity and a building’s energy and comfort performance with large-scale field data. In addition, HVAC granularity affects the labour and capital cost. This was not studied in this paper.
Previous research pointed out that controllability of indoor climate plays a vital role in achieving individual comfort expectations (Gunay et al. 2013). Humphreys and Nicol (1998) observed that the same room temperature can be perceived more acceptable, if it is chosen – rather than being imposed. It was found that individual control of the indoor temperature improves productivity (Preller et al. 1990; Leaman and Bordass 1999) and employee satisfaction (Fountain et al. 1996; Leaman and Bordass 2000). Wyon (2000) identified that ±3°C of individual control over the default temperature settings substantially improves occupant satisfaction. By using the Fanger’s comfort theory, we neglected the benefits of highly granular HVAC zoning on the behavioural adaptation.
In our EnergyPlus model, we employed stochastic occupant behaviour models to simulate the lighting, blinds, and plug-in equipment use. These models were previously developed by using the data gathered from a subset of the 37 occupants of this study. Although these models were developed using the state-of-the-art occupant behaviour modelling methodologies, their use may have caused nebulous impacts on the results of this paper. In particular, the models ignored the inter-occupant diversity in behaviour patterns (Haldi 2013). In an effort to assess the sensitivity of the simulation results to the occupant models, the simulations were repeated with the lighting and plug load schedules prescribed by the Canadian Energy Code for Buildings (NRC 2015). And, it was found that the conclusions drawn about adaptive controls and HVAC zone granularity remain unaffected. In addition, future work is planned to study the sensitivity of the simulation results at varying occupant model resolutions. The readers should be cautious while extending these results to other contexts.
Conclusions
The occupancy data from 37 private office spaces were investigated. For each occupant, four parameters that play an important role over the HVAC operation were extracted. These parameters are the earliest expected arrival time, the latest expected arrival time, the latest expected departure time, and the longest expected duration of absence. Inter-occupant diversity of these parameters was analysed.
The influence of the number of zones available per occupant on the four occupancy parameters was investigated. It was found that the earliest expected arrival time in twelve-person zones is on average two hours earlier than it is in one-person zones. Similarly, the latest expected departure time in twelve-person zones is on average two hours later than it is in one-person zones. EnergyPlus simulations were conducted to analyse the energy impact of such zone sizing decisions. Two different control approaches were assessed: (1) the adaptive controls and (2) the traditional controls. The adaptive control is a control approach in which temperature setback schedules are tailored to the four occupancy parameters. The traditional control is a control approach in which a fixed temperature setback schedule is applied for all run cases. The simulation results indicate that the HVAC energy-savings potential of the adaptive control approach depends heavily on the number of zones available per person. Energy-savings potential was estimated to be 27% with one-person zones, whereas it was 7% with twelve-office zones. Note that adaptive occupancy-learning controls merely rely on the arrival and departure detections of an occupancy sensor. Therefore, its implementation would only require a single type of sensor – and no capital cost in buildings with occupancy sensors. Therefore, adaptive occupancy-learning controls appear to be a low-cost and non-invasive way to reduce the HVAC energy use in many office buildings with different zone sizes.
Acknowledgements
This research is supported by a research funding provided by the Natural Sciences and Engineering Research Council (NSERC) of Canada and Delta Controls.
References
Agarwal, Y., B. Balaji, R. Gupta, J. Lyles, M. Wei and T. Weng (2010). Occupancy-driven energy management for smart building automation.
Proceedings of the 2nd ACM Workshop on Embedded Sensing Systems for Energy-Efficiency in Building, ACM.
ASHRAE (2013). Standard 55-2013 -- Thermal Environmental Conditions for Human Occupancy,
ASHRAE.
ASHRAE (2015). Handbook of Fundamentals. Atlanta,
ASHRAE.
ASHRAE (2016). Standard 90.1: Energy Standard for Buildings Except Low-Rise Residential Buildings. Atlanta, ASHRAE.
CWEC (2015). Canadian Weather Year for Energy Calculation. E. Canada. Ottawa.
D’Oca, S. and T. Hong (2015). "Occupancy schedules learning process through a data mining framework."
Energy and Buildings 88(0): 395-408.
Davis III, J. A. and D. W. Nutter (2010). "Occupancy diversity factors for common university building types." Energy and Buildings 42(9): 1543-1551.
Fanger, P. O. (1970). Thermal comfort. Analysis and applications in environmental engineering. Denmark, Krieger.
Fanger, P. O. (1970). "Thermal comfort. Analysis and applications in environmental engineering."
Thermal comfort. Analysis and applications in environmental engineering.
Fountain, M., G. Brager and R. de Dear (1996). "Expectations of indoor climate control." Energy
and Buildings 24(3): 179-182.
Gunay, H. B. (2016). Improving energy efficiency in office buildings through adaptive control of the indoor climate. PhD, Carleton University.
Gunay, H. B., A. Fuller, W. O’Brien and I. Beausoleil-Morrison (2016). Detecting occupants' presence in office spaces: a case study eSim 2016. J. Blake. Hamilton, IBPSA Canada.
Gunay, H. B., W. O'Brien and I. Beausoleil-Morrison (2013). "A critical review of observation studies, modeling, and simulation of adaptive occupant behaviors in offices." Building and Environment 70: 31-47.
Gunay, H. B., W. O'Brien and I. Beausoleil-Morrison (2015). "Development of an occupancy learning algorithm for terminal heating and cooling units."
Building and Environment 93, Part 2: 71-85.
Gunay, H. B., W. O'Brien, I. Beausoleil-Morrison and S. Gilani (2016). "Development and implementation of an adaptive lighting and blinds control algorithm."
Building and Environment.
Gunay, H. B., W. O’Brien and I. Beausoleil-Morrison (2016). "Control-oriented inverse modeling of the thermal characteristics in an office." Science and
Technology for the Built Environment: 1-20.
Gunay, H. B., W. O’Brien, I. Beausoleil-Morrison and S. Gilani (2016). "Modeling plug-in equipment load patterns in private office spaces." Energy and
Buildings 121: 234-249.
Haldi, F. (2013). A probabilistic model to predict building occupants’ diversity towards their interactions with the building envelope. Proceedings
of the international IBPSA conference, Chambery, France.
Humphreys, M. A. and J. F. Nicol (1998). "Understanding the adaptive approach to thermal comfort." Ashrae Transactions 104: 991.
Kelly, E. L., P. Moen and E. Tranby (2011). "Changing workplaces to reduce work-family conflict schedule control in a white-collar organization." American
Sociological Review 76(2): 265-290.
Leaman, A. and B. Bordass (1999). "Productivity in buildings: the ‘killer’variables." Building Research
& Information 27(1): 4-19.
Leaman, A. and B. Bordass (2000). "Keeping occupants ‘satisfied’." Energy and Environmental Management: 23-27.
Mahdavi, A., A. Mohammadi, E. Kabir and L. Lambeva (2008). "Occupants' operation of lighting and shading systems in office buildings." Journal of
Building Performance Simulation 1(1): 57-65.
Masoso, O. T. and L. J. Grobler (2010). "The dark side of occupants’ behaviour on building energy use."
Energy and Buildings 42(2): 173-177.
McMenamin, T. M. (2007). "Time to work: recent trends in shift work and flexible schedules, A." Monthly
Lab. Rev. 130: 3.
Nagy, Z., F. Y. Yong, M. Frei and A. Schlueter (2015). "Occupant centered lighting control for comfort and energy efficient building operation." Energy and
Buildings 94: 100-108.
Newsham, G. R., H. Xue, J. J. Valdes, E. Scarlett, C. Arsenault, G. J. Burns, S. Kruithof and W. Shen (2015). Factors affecting the performance of ceiling-based PIR occupancy sensors in offices.
Proceedings of the Illuminating Engineering Society of North America (IESNA) Annual Conference.
NRC (2015). National Energy Code of Canada for Buildings, National Research Council Canada. Preller, L., T. Zweers, B. Brunekreef and J. Boleij
(1990). "Sick leave due to work-related health complaints among office workers in The Netherlands."
Schiavon, S. and K. H. Lee (2013). "Dynamic predictive clothing insulation models based on outdoor air and indoor operative temperatures." Building and
Environment 59: 250-260.
Sun, K., D. Yan, T. Hong and S. Guo (2014). "Stochastic modeling of overtime occupancy and its application in building energy simulation and calibration."
Building and Environment 79(0): 1-12.
Wang, D., C. C. Federspiel and F. Rubinstein (2005). "Modeling occupancy in single person offices."
Energy and Buildings 37(2): 121-126.
Wyon, D. P. (2000). Enhancing productivity while reducing energy use in buildings. Proceedings of the
E-Vision 2000 Conference.
Yang, Z. and B. Becerik-Gerber (2014). "The coupled effects of personalized occupancy profile based HVAC schedules and room reassignment on building energy use." Energy and Buildings 78: 113-122.
Yang, Z. and B. Becerik-Gerber (2014). "Modeling personalized occupancy profiles for representing long term patterns by using ambient context."
Building and Environment 78(0): 23-35.
Zeytinoglu, I. U., G. B. Cooke and S. L. Mann (2009). "Flexibility: Whose choice is it anyway?" Relations