HAL Id: tel-03163063
https://tel.archives-ouvertes.fr/tel-03163063
Submitted on 9 Mar 2021HAL is a multi-disciplinary open access archive for the deposit and dissemination of sci-entific research documents, whether they are pub-lished or not. The documents may come from teaching and research institutions in France or abroad, or from public or private research centers.
L’archive ouverte pluridisciplinaire HAL, est destinée au dépôt et à la diffusion de documents scientifiques de niveau recherche, publiés ou non, émanant des établissements d’enseignement et de recherche français ou étrangers, des laboratoires publics ou privés.
Spatial organization of electric charges and discharge
kinetics of nanofibers elaborated by electrospinning :
application to the elaboration of 3D structured
nanofibrous materials
Meng Liang
To cite this version:
Meng Liang. Spatial organization of electric charges and discharge kinetics of nanofibers elaborated by electrospinning : application to the elaboration of 3D structured nanofibrous materials. Physics [physics]. Université de Strasbourg, 2020. English. �NNT : 2020STRAE002�. �tel-03163063�
UNIVERSITÉ DE STRASBOURG
ÉCOLE DOCTORALE DE PHYSIQUE ET CHIMIE PHYSIQUE
Institut de Chimie et Procédés pour l’Énergie, l’Environnement et la
Santé
(ICPEES – UMR 7515)
THÈSE
présentée par :
Meng LIANG
soutenue le : 9 mars 2020
pour obtenir le grade de :
Docteur de l’Université de Strasbourg
Discipline/ Spécialité : Physique et chimie-physique
Spatial organization of electric charges
and discharge kinetics of nanofibers
elaborated by electrospinning:
application to the elaboration of 3D
structured nanofibrous materials
THÈSE dirigée par :M. SCHLATTER Guy Professeur des Universités, Université de Strasbourg RAPPORTEURS :
M. BOSSARD Frédéric Professeur des Universités, Université de Grenoble M. DASCALESCU Lucian Professeur des Universités, Université de Poitiers
AUTRES MEMBRES DU JURY :
Mme DRENCKHAN Wiebke Directrice de Recherche au CNRS, ICS-UPR22 Strasbourg
Organisation spatiale des charges
électriques et cinétique de décharge des
nanofibres élaborées par electrospinning:
Application à l’élaboration de matériaux
nanofibreux structurés en 3D
Spatial organization of electric charges and
discharge kinetics of nanofibers elaborated by
electrospinning: application to the elaboration of 3D
structured nanofibrous materials
Meng LIANG
Contents
Résumé de la thèse ... 11
General introduction ... 21
Chapter 1 State of the art: accumulation and dissipation of electric charges during electrospinning - application to the fabrication of 3D structured nanofibrous scaffolds 27 1.1 The processes of electrospinning and electrospraying ... 29
1.1.1 Electrospinning ... 29
1.1.2 Electrospraying ... 35
1.2 Electric current produced during electrospinning ... 40
1.3 Surface potential on a fibrous mat: in-situ charging during electrospinning and charge release ... 45
1.3.1 In-situ charging by electrospinning - development of the surface potential 45 1.3.2 Charge release and surface potential decay of charged fibrous mats ... 48
1.3.3 Surface potential decay of fibrous mat charged by corona effect ... 49
1.3.4 Surface potential decay of fibrous mat charged by in-situ electrospinning . 51 1.4 The role of surface potential on the building of structured scaffolds and applications of 3D structured scaffolds ... 52
1.4.1 1D aligned fibers ... 53
1.4.2 An electrostatic template for the fabrication of 2D fibrous structures ... 55
1.4.3 3D fibrous structures ... 60
1.4.4 The case of nanofiber self-assembling during electrospinning ... 63
1.4.5 Recent applications of structured fibrous structures ... 66
1.5 Conclusion ... 70
Chapter 2 Direct measurement of the surface charge density on an electrospun fiber and on an individual electrosprayed particle: effects of processing parameters ... 87
2.1 Introduction ... 89
2.2 Materials and methods ... 91
2.3 A method allowing the measurement of the charges carried by the jet ... 95
2.4 Effect of processing parameters on the linear and surface charge densities in the case of PLA electrospinning... 101
2.4.1 Effect of the polymer concentration in the solution ... 101
2.4.2 Effect of the solution conductivity: addition of a salt TEBAC ... 106
2.4.3 Effect of the applied voltage ... 109 5
2.4.4 Effect of ambient humidity ... 113
2.4.5 Effect of the feeding rate ... 117
2.5 Effect of the nature of the processed polymer on the linear and surface charge densities ... 121
2.6 Charge density carried by individual electrosprayed particles ... 123
2.7 Conclusion ... 125
Chapter 3 In-situ charging during simple electrospinning and surface potential decay: modeling and experimental study ... 133
3.1 Introduction ... 135
3.2 Materials and methods ... 137
3.3 In-situ charging during electrospinning ... 141
3.3.1 Evolution of the mat surface potential during electrospinning: a model ... 141
3.3.2 Effect of processing parameters on the current and surface potential ... 145
3.4 Decay of the surface potential of the mat after stopping the fiber production – mechanism of residual charges dissipation... 153
3.4.1 Surface potential decay: a model ... 153
3.4.2 Effect of processing parameters on the surface potential ... 155
3.5 Study during electrospinning of PEO ... 159
3.6 Discussion and conclusion ... 162
Chapter 4 Surface potential of suspended electrospun fibers: application for the building of 3D structured scaffolds by coupling electrospinning and electrospraying . 169 4.1 Introduction ... 171
4.2 Charges accumulation and dissipation on electrospun fibers suspended over a single gap: experiments and modeling ... 175
4.2.1 Materials and methods ... 177
4.2.2 Evolution of the surface potential over PLA and PEO suspended fibers over a single gap during electrospinning ... 182
4.2.3 Surface potential generated by suspended fibers over a single gap: a model 184 4.2.4 Surface potential of suspended fibers made of various polymers ... 191
4.2.5 Effect of the gap size on the surface potential ... 193
4.2.6 Effect of the duration of electrospinning on the kinetic of the surface potential decay of suspended PLA and PEO fibers ... 197
4.2.7 Conclusion ... 202
4.3 Application for the building of 3D structured scaffolds by electrospinning/electrospraying on patterned collectors ... 203
4.3.1 Introduction ... 205
4.3.2 Fabrication of bilayer samples on a striated collector ... 205
4.3.2.1 Materials and methods ... 206
4.3.2.2 Effect of processing time on the variation of surface potential of suspended PLA and PEO fibers ... 208
4.3.3 Fabrication of multilayer 3D samples on grid collectors ... 214
4.3.3.1 Materials and methods ... 214
4.4 Conclusion ... 233
General conclusion ... 239
PCL polycaprolactone
PEO polyethylene oxide
PVP poly(vinylpyrrolidone)
PLA polylactic acid
PGA polyglycolic acid
PLGA poly(lactic-co-glycolic acid)
PS polystyrene
DMF dimethylformamide
DW deionized water
HA hyaluronic acid
RH relative humidity
PVDF–TrFE Poly (vinylidene fluoride–co–
trifluoroethylene)
PET poly(ethylene terephthalate)
SEM scanning electron microscope
TSC using thermally stimulated current
PBT poly(butylene terephthalate)
PVA polyvinyl alcohol
PMMA polymethyl methacrylate
TEBAC benzyltriethylammonium chloride
DCM dichloromethane
DMAC dimethylacetamide
Résumé de la thèse
Introduction, contexteL'electrospinning est un procédé permettant l’élaboration de matériaux nanofibreux sous l’action d’un champ électrostatique intense. Lors du procédé, une solution de polymère en régime semi-dilué enchevêtrée est acheminée vers une aiguille métallique soumise à un potentiel électrique élevé. Lorsque le champ électrique entre l’aiguille et une contre-électrode métallique reliée à la masse électrique, appelée collecteur, est suffisamment intense (i.e. de l’ordre de 1 kV/cm), un jet de la solution est éjecté violement en direction du collecteur. Lors du trajet entre l’aiguille et le collecteur, le jet est soumis à des instabilités électro-hydro-dynamiques résultant à des mouvements de fouets qui favorisent l’évaporation du solvant et la réduction du diamètre. Après un temps de vol de quelques ms, il se dépose ainsi sur le collecteur une nanofibre de polymère solide sous la forme d’une membrane non tissée. Par ailleurs, en baissant la concentration du polymère dans la solution mise en œuvre, le jet est assujetti à des ruptures conduisant finalement à un dépôt de microparticules : le procédé est alors appelé electrospraying. Au moment de la mise en contact avec le collecteur, la nanofibre chargée électriquement, se décharge graduellement. La cinétique de décharge électrique mais aussi la façon dont sont réparties les charges à la surface du matériau au cours du procédé conditionnent l’organisation et la structuration 3D finale de la membrane.
Le travail de cette thèse a consisté à mesurer les charges électriques portées par la nanofibre dans le cas de l’electrospinning et par les microparticules dans le cas de l’electrospraying. Puis, nous nous sommes intéressés à la répartition des charges électriques sur la membrane au cours de sa fabrication par electrospinning mais aussi à la cinétique de décharge une fois la nanofibre déposée. Cette étude a ensuite été appliquée pour élaborer, par electrospinning/electrospraying, des scaffolds nanofibreux avec une structure 3D contrôlée.
1. Mesure de la densité de charges électriques sur une nanofibre déposée par electrospinning et sur des particules produites par electrospraying
L’electrospinning est une méthode simple et rapide de production de nanofibres sous champ électrique qui a été largement utilisée dans divers domaines. Il a été rapporté que les charges sur les fibres jouent un rôle important pour contrôler la morphologie des fibres ainsi
produites. Les charges électriques jouent aussi un rôle important lorsque l’on souhaite fabriquer des membranes avec une structure 3D contrôlée comme par exemple des membranes poreuses avec une taille de pores contrôlée. Enfin, la fabrication d’une membrane chargée électriquement forme un électret poreux qui trouve des applications dans le domaine de la filtration. C'est pourquoi, la mesure précise de la densité de charges portées par une nanofibre est une question importante. Traditionnellement, la densité de charge est obtenue par la mesure du courant électrique induit lors du dépôt de la nanofibre chargée. Toutefois, cette méthode ne permet pas d’évaluer la part des charges électriques qui restent à la surface de la nanofibre après son dépôt. Seules les charges évacuées vers la masse électriques sont quantifiée. Nous avons donc proposé une nouvelle méthode consistant à mesurer l’ensemble des charges portées par la nanofibre juste avant sa mise en contact avec le collecteur. Pour ce faire, un condensateur a été fixé entre un collecteur rotatif et la masse électrique afin de bloquer la dissipation des charges portées par la nanofibre vers la masse. Le potentiel de surface induit par les fibres déposées a été mesuré à l’aide d’un voltmètre électrostatique sans contact. Après avoir évalué la longueur de nanofibre déposée par unité de temps (cad la vitesse de formation des fibres Vf) par imagerie MEB d’échantillons prélevés à différents instants de production, la densité de charge linéique a pu finalement être déterminée. La méthode a également été appliquée pour obtenir la densité de charges de surface des microparticules pulvérisées par electrospraying.
L’effet des paramètres de procédés sur la densité de charge linéique a été étudié tout particulièrement dans le cas de l’élaboration d’une nanofibre de poly(acide lactique) (PLA). Les résultats ont montré que la densité de charge diminue lorsque l’on augmente la concentration de PLA dans la solution mise en œuvre. L'augmentation de la conductivité de la solution, quant à elle, augmente considérablement la densité de charge. L’augmentation de la tension appliquée à l’aiguille d’electrospinning entraîne une augmentation de la vitesse de
formation Vf et par conséquent induit une diminution de la densité de charge linéique. Enfin,
une augmentation de l’humidité relative de l’air ambiant conduit à l'augmentation de la densité de charge linéique. En ce qui concerne les microparticules produites par electrospraying, le polymère choisi a été le poly(ε-caprolactone) (PCL). Deux PCL ont été étudiés : l’un, ayant une masse molaire de 14 kg/mol permettant la production à haut débit de
particules de petit diamètre (entre 1 et 3 μm) et l’autre, ayant une masse molaire de 80 kg/mol
permettant de produire à plus faible débit des particules de gros diamètre (entre 10 et 25 μm). Ainsi, la densité de charge de surface a pu être mesurée en fonction du diamètre des
particules. Il a été montré que la densité de charges de surface est plus élevée pour les particules produites avec le PCL de 80 kg/mol ce qui s’explique par un ratio surface/volume des particules plus faible que pour celles produites avec le PCL de 14 kg/mol.
2. Accumulation et dissipation des charges résiduelles portées par un scaffold fibreux pendant et après sa fabrication par electrospinning
Comme mentionné précédemment, la densité de charges portée par la nanofibre dépend du procédé et du diamètre de cette dernière. Au cours de la fabrication d’un scaffold fibreux, une partie des charges sont évacuées vers la masse du collecteur alors qu’une autre partie reste accumulée dans la membrane. La manière dont sont libérées et accumulées les charges électriques au sein de la membrane influence la structure de la membrane (porosité et taille des pores principalement) mais aussi l’efficacité de production. Enfin, la capacité qu’a un scaffold fibreux à maintenir dans le temps les charges électriques est une propriété importante lorsqu’on souhaite l’utiliser comme filtre à électret. Ainsi, nous avons étudié l'accumulation et la cinétique de dissipation du potentiel de surface induit par les charges lors du procédé d’electrospinning simple (i.e. avec un collecteur cylindrique lisse) pour deux types de polymères : le PLA et le poly(oxyde d’éthylène) (PEO).
Un montage expérimental original a été développé. Il a consisté à mesurer, en continu pendant l’electrospinning, le courant électrique induit par les charges électriques se dissipant vers la masse, d’une part, et le potentiel à la surface de la membrane résultant de l’accumulation des charges, d’autre part. Les résultats montrent que les fibres de PEO dissipent très rapidement leurs charges électriques : toutes les charges portées par le jet d’electrospinning sont évacuées quasi-instantanément. En ce qui concerne les fibres de PLA, des portions de fibres restent chargées, provoquant une augmentation continue du potentiel de surface dont la cinétique a été étudiée en fonction des paramètres de procédé.
Un modèle a été proposé dans le cadre de cette thèse afin de caractériser la cinétique de formation du potentiel de surface. Grâce au modèle, il a été montré que la mesure du potentiel de surface pendant l’electrospinning est caractérisée par un temps caractéristique τ qui peut être mis en relation avec les caractéristiques électriques aux différentes échelles : (i) le pore, (ii) la couche élémentaire ayant la surface de la membrane et l'épaisseur d'un pore et (iii) l'ensemble de la membrane en cours de construction. Il a été démontré qu'une loi d'échelle permet de prédire l’évolution du diamètre de la fibre en fonction de τ. L'étude de la
décroissance du potentiel de surface après l'arrêt de l'électrospinning a montré l’existence de trois mécanismes de dissipation des charges. Une dissipation aux temps courts de l’ordre de quelques secondes se produit sur la surface supérieure de la membrane, puis une dissipation des charges aux temps moyens de l’ordre de plusieurs dizaines de secondes a été attribuée à la dissipation des au sein des pores de la membrane. Enfin, un mécanisme de dissipation aux temps longs de plusieurs centaines ou milliers de secondes a été attribué à la dissipation des charges piégées au cœur des fibres. La persistance des charges résiduelles, grâce en particulier, au ralentissement des mécanismes de dissipation aux temps moyens et longs les deuxième et troisième étapes, est importante pour la construction de membranes à structure contrôlée. Enfin, dans cette partie, il a été montré pour la première fois que la mesure du potentiel de surface, grâce à l'utilisation d'un voltmètre électrostatique, est une méthode simple donnant des informations précises sur la membrane à l'échelle locale du diamètre des pores et des fibres. Une telle méthode devrait permettre de détecter les variations de la morphologie poreuse des membranes au moment même de leur fabrication. De plus, en combinaison avec la mesure du courant, c'est une méthode efficace et complémentaire pour obtenir un suivi en ligne du procédé d’electrospinning.
a) b)
Figure 1: Loi d’échelle établie grâce à la corrélation des mesures expérimentales avec le
modèle proposé. a) loi d’échelle entre la capacité moyenne des pores et le diamètre moyen des fibres. b) Loi d’échelle entre le diamètre moyen des fibres et le ratio entre le temps
caractéristique τ et la dérivée temporelle du potentiel de surface.
3. Potentiel de surface de fibres suspendues: application à la construction de scaffolds 3D structurés par electrospinning/electrospinning
Le procédé d’electrospinning conduit naturellement à la fabrication de scaffolds 3D avec une organisation pseudo-aléatoire des nanofibres. Bien que ce type de scaffolds montrent un très
grand intérêt pour les applications biomédicales telle que l’ingénierie tissulaire, il serait très intéressant de pouvoir contrôler l’organisation fibreuse afin de mimer la structuration 3D de certains tissus comme par exemple le myocarde qui présente une structure hiérarchique avec des cellules fibreuses alignées noyées dans des structures 3D en nid d'abeilles formés par des fibres de collagène ondulés. Par ailleurs, l’electrospinning résulte à la fabrication de scaffolds fibreux avec une faible taille moyenne des pores de l’ordre de quelques microns qui ne permet pas d’assurer une colonisation cellulaire efficace.
Des travaux antérieurs effectués à l’ICPEES ont pourtant montré qu'en utilisant de manière synergique les procédés d’electrospinning et d’electrospraying avec un collecteur formé de protubérances dont la topographie est contrôlée, il est possible de construire des composites dont la structure peut être contrôlée en 2D et même en 3D. Il a été démontré que l’organisation 2D et 3D des nanofibres est régie par la distribution des charges électriques accumulées à la surface du matériau lors de sa fabrication par dépôt alterné de nanofibres par electrospinning et de microparticules par electrospraying. Cette distribution contrôlée de charges électriques, appelée « template électrostatique », est composée d’une part, de zones répulsives dues aux portions de fibres suspendues chargées entre les protubérances du collecteur et, d’autre part, de zones attractives dues aux segments de fibres en contact direct avec les protubérances. Lorsque le « template électrostatique » est bien formé, les microparticules chargées se déposent sélectivement et uniquement sur les zones attractives maintenant ainsi le contact électrique avec les protubérances du collecteur et permettant même lorsque la quantité de microparticules est suffisante de construire de nouvelles protubérances localisées juste au-dessus de celles du collecteur permettant ainsi de redessiner sa topographie. La fabrication de scaffolds structurés en 3D peut alors être assurée par des dépôts successifs et alternés de nanofibres et de microparticules.
a) b)
Figure 2 : a) Montage permettant la mesure du potentiel de surface au-dessus des segments
de fibres suspendus au-dessus d’un de largeur ajustable. b) Evolution du potentiel de surface et de longueur de segments de nanofibre de PLA suspendus au-dessus du gap.
a. Analyse du potentiel de surface et cinétique de décharge de fibres suspendues
Les charges portées par les portions de fibres suspendues jouent le rôle principal pour l’élaboration des scaffolds 3D structurés. L’étude de la formation du « template électrostatique » et de la cinétique de sa décharge est donc primordiale pour mieux comprendre les phénomènes mis en jeu et de pouvoir in fine assurer un meilleur contrôle de la structuration 3D des scaffolds et ce, sur des épaisseurs encore plus importantes. Nous avons donc étudié le « template électrostatique » pour l’electrospinning du PLA en solution dans un système diméthyle formamide/dichlorométhane (DMF/DCM), d’une part, et du PEO en solution dans l’eau. Un collecteur cylindrique a été spécialement fabriqué pour l’étude (Fig. 1a), il a permis la mesure en continu de l’évolution du potentiel à la surface de fibres suspendues au-dessus d’un gap simple localisé sur une circonférence du collecteur et de largeur ajustable entre 0 et 10 mm.
Nous avons montré que l’évolution du potentiel de surface au cours du dépôt par electrospinning se décompose en trois phases (Fig. 1b). Dans les premiers instants, pendant environ une dizaine de secondes, le potentiel augmente quasi-proportionnellement avec le temps. Ce comportement s’explique par l’augmentation proportionnelle du nombre de segments de fibres suspendus, mesuré par observations MEB, au-dessus du gap (Fig. 1b). Il est à noter aussi que les segments sont parallèles entre eux et perpendiculaire au gap ce qui est dû aux forces d’interactions électrostatiques. La quantité de charges étant proportionnelle à la densité de charge linéique le long de la nanofibre, il s’en suit une augmentation du potentiel de surface. Dans une deuxième phase, on observe de manière étonnante une diminution du potentiel de surface. Les images MEB montrent des défauts de parallélisme
des segments de fibres et résultent à la formation de « circuits fibreux fermés » (Fig. 2a) interconnectés aux points de contact fibre-fibre. Ces circuits présentent une distribution de
charges hétérogène et peuvent être caractérisé par un circuit RloopCloop formé d’une résistance
et d’un condensateur en parallèle. L’association des circuits RloopCloop forme une membrane
fine suspendue uniformément chargée au-dessus du gap et qui elle aussi peut être modélisée par un circuit électrique équivalent caractérisé par un temps caractéristique de décharge τ = R(t)Cgap (Fig. 2a). Le temps τ diminue probablement avec la taille du « circuit fibreux fermé ». Il apparaît que le temps caractéristique τ résulte d’une part des propriétés d’interconnexion et de résistivité des nanofibres caractérisées par la résistance R(t) et de la capacité Cgap qui elle, est fonction de la géométrie du gap. Alors que Cgap est constant, la résistance R(t), quant à elle, diminue au cours du temps à cause de la densification des réseaux fibreux améliorant ainsi l’interconnexion des fibres et donc la décharge de la membrane suspendue. Ainsi, la diminution du potentiel de surface pendant la deuxième phase est expliquée par la décharge des segments suspendus attribués à la décharge des « circuits fibreux fermés » par la circulation des charges localisée à la surface des fibres. Lors de la troisième phase, l’apport des charges par la fibre en cours de dépôt est parfaitement compensé par la dissipation des charges. Dans cette troisième et dernière phase, des charges sont à la fois apportées par de nouveaux segments de fibre alors que d’autres charges sont dissipées d’autant plus efficacement que la taille des « circuits fibreux fermés » diminue jusqu’à une valeur limite de l’ordre de quelques μm expliquant ainsi la quasi-stabilité du potentiel de surface. L’évolution du potentiel de surface généré au-dessus des fibres suspendues a ensuite été étudiée en fonction de la taille du gap et de différents paramètres de procédé. Par ailleurs, le potentiel de surface généré dans le cas des fibres de PEO est bien plus faible que pour les fibres de PLA. Ceci est probablement dû à une conductivité plus élevée des fibres de PEO à cause de la présence probable d’eau résiduelle favorisant la dissipation des charges.
La cinétique de décharge du tapis fibreux suspendus au-dessus du gap a ensuite été étudiée à
partir de l’instant tspin pour lequel le potentiel à l’aiguille d’electrospinning est mis à la masse
correspondant ainsi à l’arrêt de production de fibres (Fig. 2b). A partir de l’instant tspin,
aucune nouvelle charge électrique n’est apportée et la morphologie du tapis fibreux ne change plus. Dans les deux cas, pour le PLA et pour le PEO, une cinétique de décharge du potentiel ω à la surface du tapis fibreux a pu être modélisée par deux temps de relaxation, un temps court τs et un temps long τl environ 10 fois plus élevé que le temps court :
𝑉(𝑡) = 𝐴𝑠𝑒−� 𝑡−𝑡𝑠𝑝𝑖𝑛
𝜏𝑠 �+ 𝐴𝑙𝑒−�
𝑡−𝑡𝑠𝑝𝑖𝑛
𝜏𝑙 �
Il a été observé qu’une augmentation de la durée de production tspin se traduit par une
augmentation du temps court τs et une diminution du temps long τl (Fig. 2c). Ce
comportement opposé pourrait s’expliquer par l’origine physique des deux phénomènes de relaxation : le temps court τs, pourrait être attribué à la recombinaison de charges avec des ions présents dans l’air alors que le temps long τl pourrait être attribué à la décharge des «
circuits fibreux fermés». En effet, aux temps de production tspin court, le nombre de segments
de fibres du tapis fibreux localisés au-dessus du gap est faible, réduisant ainsi le nombre de charges en contact avec les ions libres de l’air. Par ailleurs, lorsque tspin augmente, la taille des « circuits fibreux fermés» (Fig. 2a) diminue conduisant alors à la diminution de leur temps caractéristique RC dont la valeur moyenne pourrait correspondre au temps de relaxation τl. En conclusion, le « template électrostatique » induit par les segments suspendus de nanofibres est beaucoup plus stable pour des dépôts faiblement denses en fibres et donc pour des temps de production tspin courts.
a) b) c)
Figure 3 : a) Image MEB de segments de nanofibres suspendus. En blanc un « circuits
fibreux fermés » et dessous le circuit électrique équivalent. b) Evolution du potentiel de surface en fonction du temps avant et après tspin et pour différentes valeurs de tspin dans le cas
de l’electrospinning de PEO. c) Evolution des temps de relaxation court τs et long τl et du rapport As/Al en fonction de tspin dans le cas de l’electrospinning de PEO.
b. Electrospraying de particules par « dépôt assisté par template électrostatique » DATE
L’effet de «template électrostatique » a ensuite été appliqué pour guider le dépôt de microparticules par electrospraying. Pour ce faire, un collecteur cylindrique présentant des stries parallèles en circonférence et espacées de 500 microns a été spécialement fabriqué. Cette géométrie a permis d’extrapoler les analyses effectuées avec le collecteur cylindrique à simple gap ajustable. Dans une première étape, des nanofibres de PLA ou de PEO ont été déposées sur le collecteur pour différents temps de production tspin. Puis, dans une deuxième
étape, le « dépôt assisté par template électrostatique » (DATE) de microparticules de PCL a été effectué pour différentes durées tspray. Les expériences ont montré l’amélioration de la
qualité du contrôle du DATE avec la diminution du temps d’electrospinning tspin. En effet, il
s’agit de la situation pour laquelle le « template électrostatique » est plus stable pendant la production de microparticules par electrospraying.
c. Structures 3D élaborées par DATE.
Des scaffolds composites ont été élaborés par electrospinning de PLA et electrospraying de PCL en utilisant des collecteurs structurés afin d’obtenir des structures 3D multicouches via la stratégie DATE par dépôt successif de bicouches nanofibres-microparticules. L’organisation de chaque bicouche ainsi que le potentiel de surface ont été étudiés et discutés tout au long du procédé d’élaboration et en fonction de la durée et de l’arrangement des séquences des dépôts (Fig. 4 and 5).
Figure 4 : Principe de l’expérience permettant de produire des membranes par le procédé
DATE et de mesure online du potentiel de surface.
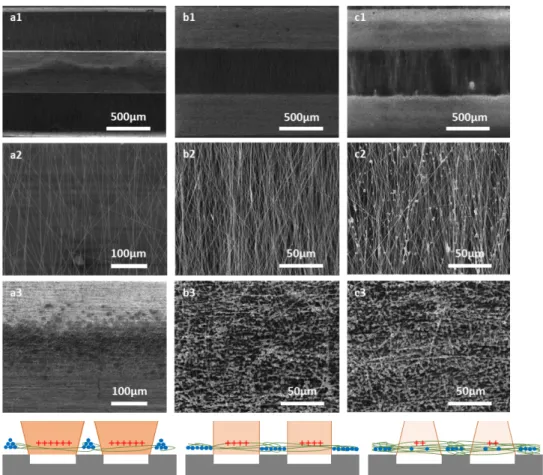
Figure 5 : Bicouches formés par une couche de nanofibres recouverte d’une couche de
microparticules obtenus pour différents temps d’electrospinning tspin = 15s (a1, a2, a3), 3min
(b1, b2, b3) et 5min (c1, c2, c3). a1, b1 et c1 montrent des images MEB des nanofibres et microparticules localisés au-dessus d’un gap et d’un mur d’une strie. a2, b2 et c2 montrent le
bicouche au-dessus d’un gap et a3, b3 et c3 au-dessus d’un mur d’une strie. Les dessins dessous schématisent l’organisation des particules.
General introduction
General context:
After two decades of development, electrospinning, as a powerful technique to produce nanofibers with a diameter in the range from tens of nanometer to micrometers, has gained a great attention to produce fibrous membranes applied in wound healing, drug delivery, tissue engineering, air filtration, sensor, etc [1]–[5]. Now, some products have been developed at industrial scale in several fields. Although electrospinning is well-known to produce non-woven mats, it has been discovered that the deposition of the nanofiber can be controlled in order to obtain structured scaffolds with specific patterns paving the way for novel applications and specifically in tissue engineering in order to mimic the structures and biological functions of the extracellular matrix and enhance the cell immigration and proliferation providing a route for researchers to develop new products for the treatment of patients and for the society to save a huge economic burden. For example, for only cardiovascular patients, the total health care was estimated at $108 billion in 2012 [6]. Besides the high value in tissue engineering, fibrous mats with high specific surface area and small pores can filtrate the impurities efficiently, it was reported that PM 2.5 causes around 3.2 million deaths in 2010 which becomes the major threaten to the survival of human beings [7], thus electropsun scaffolds facilitates modern people to manage the challenges from the air pollution.
During the production of fibrous mats, fibers can be transformed into particles by simply decreasing polymer chain entanglements, the process is called electrospraying and already widely used in drug delivery. Moreover, former researches developed in our group demonstrated that by combining the processes of electrospraying and electrospinning, 3D structured composite mats can be obtained and furthermore with enhanced thickness. It was shown that the successfull fabrication of a structured nanofibrous mat relies on the control of the charges carried by the nanofibers during their deposition.
Thus, the main goal of this PhD is to understand the effect of electric charges on the morphology of the resulting material and on the building of structured scaffolds generated by coupling fibers and particles. A precisely selective deposition of particles is obtained resulting from falling particles undergoing an efficient electrostatic template effect controlled by the surface potential remaining on the fibers. Hence, studying the surface potential of electrospun fibers to understand the formation mechanism of electrostatic template effect is necessary for better controlling the building of thick composite scaffolds with spatial structures.
Methodology:
In this study, PLA and PEO are chosen as the basic polymer materials to generate electrospun fibers. For electrospraying, PCL having either a molar mass of 14 kg/mol or 80 kg/mol are used to prepare particles in different sizes. When nanofibers are electrospun on a patterned collector made of protuberances, a surface potential can be generated by the fiber strands suspended between the protuberances. The resulting electrostatic template is thus able to modify the trajectory of particles allowing their deposition on selective areas. In order to study the interaction between fibers and particles, the amount of charges brought by jets, the accumulation and dissipation of charges remaining on fibrous mats and suspended fibers are deeply studied. Finally, 3D structured scaffolds are generated by the alternate deposition of electrospun PLA fibers and electrosprayed PCL particles on patterned collectors.
Fig. 1 The different steps of the PhD: A) Charges induced by a single electrospun jet: measurement and impact of processing parameters. B) Charge accumulation and dissipation in a fibrous mat produced on a flat collector: characterization and relationship with the porous
morphology of the mat. C) Surface potential formation and decay on suspended fibers: a model experiment. D) Preparation of structured scaffolds by coupling electrospun fibers and
electrosprayed particles on patterned collectors (D)
The goals of this PhD were to investigate, at both nanofiber and mat length scales, the relationships between the charges carried by the deposited nanofibers and the morphology of the produced mat. The several stages of this PhD are presented in Fig. 1.
Chapter 1 presents a state of the art in the topic of the PhD. Electrospinning and electrospraying will be introduced briefly then, the latest studies dealing with the measurement and the characterization of the electrical charges carried by the nanofibers and the resulting surface potential of the produced mat will be presented. In chapter 2, we focused at the nanofiber lengthscale. The charge density of PLA fibers is precisely studied by a novel approach which also provides more details on the effects of various processing conditions (polymer concentration, applied voltage, conductivity, ambient humidity and flow rate) on the rate of charge accumulation and the formation velocity of fibers. The amount of charges carried by PEO, PEO/Alginate fibers and PCL particles is measured as well.
Chapter 3deals with the measurement of charges and surface potential during electrospinning of PLA fibers deposited on a flat and grounded collector. The effect of polymer concentrations, applied voltages and ambient humidity on the mat surface potential is studied. Furthermore, a model is proposed to get more insight into the formation and the decay kinetic of the surface potential and its relationship with the porous structure of the produced mat.
In order to understand how the surface potential is generated on suspended fibers, a
specific collector with an adjustable gap in size was designed (the 1st section of chapter 4).
Here, PLA and PEO are electrospun onto the single gap to examine the effect of of the type of the processed polymer on the storage of surface potential. Additionally, the intensity of the surface potential on suspended fibers is studied as a function of the gap size and the processing time. A model is also developed in order to understand the mechanisms of the formation kinetic of the surface potential generated by suspended fibers.
Finally, the combination of electrospun fibers and electrosprayed particles deposited
on patterned collectors is studied in the 2nd section of chapter 4. First, PCL particles are
electrosprayed on either PLA or PEO electrospun fibers deposited on a striated collector. Such regular collector geometry allows to extend the results obtained in the previous section. Then, a grid collector with smaller gaps and grooves than the striated collector is used to improve the efficiency to produce 3D multilayer samples. The results indicate that the selective deposition of PCL particles is constant after preparing few layers of PLA fibers and
PCL particles alternately. Thus, multilayer samples with spatial structures, combining PLA fibers and PCL particles, are eventually obtained.
[1] A. Podgórski, A. Bałazy, and L. Gradoń, “Application of nanofibers to improve the
filtration efficiency of the most penetrating aerosol particles in fibrous filters,” Chemical
Engineering Science, vol. 61, no. 20, pp. 6804–6815, Oct. 2006, doi:
10.1016/j.ces.2006.07.022.
[2] H. Liu, J. Kameoka, D. A. Czaplewski, and H. G. Craighead, “Polymeric Nanowire
Chemical Sensor,” Nano Letters, vol. 4, no. 4, pp. 671–675, Apr. 2004, doi: 10.1021/nl049826f.
[3] A. Melaiye et al., “Silver(I)−Imidazole Cyclophane gem -Diol Complexes
Encapsulated by Electrospun Tecophilic Nanofibers: Formation of Nanosilver Particles and Antimicrobial Activity,” Journal of the American Chemical Society, vol. 127, no. 7, pp. 2285–2291, Feb. 2005, doi: 10.1021/ja040226s.
[4] H. Yoshimoto, Y. M. Shin, H. Terai, and J. P. Vacanti, “A biodegradable nanofiber
scaffold by electrospinning and its potential for bone tissue engineering,” Biomaterials, vol. 24, no. 12, pp. 2077–2082, May 2003, doi: 10.1016/S0142-9612(02)00635-X.
[5] L. Chen, L. Bromberg, T. A. Hatton, and G. C. Rutledge, “Catalytic hydrolysis of
p-nitrophenyl acetate by electrospun polyacrylamidoxime nanofibers,” Polymer, vol. 48, no. 16, pp. 4675–4682, Jul. 2007, doi: 10.1016/j.polymer.2007.05.084.
[6] C. Cook, G. Cole, P. Asaria, R. Jabbour, and D. P. Francis, “The annual global
economic burden of heart failure,” International Journal of Cardiology, vol. 171, no. 3, pp. 368–376, Feb. 2014, doi: 10.1016/j.ijcard.2013.12.028.
[7] J. S. Apte, J. D. Marshall, A. J. Cohen, and M. Brauer, “Addressing Global Mortality
from Ambient PM 2.5,” Environ. Sci. Technol., vol. 49, no. 13, pp. 8057–8066, Jul. 2015, doi:
10.1021/acs.est.5b01236.
Chapter 1 State of the art: accumulation and
dissipation of electric charges during
electrospinning - application to the
fabrication of 3D structured nanofibrous
scaffolds
This chapter presents a state of the art. First, the processes of electrospinning and electrospraying, allowing the fabrication of nanofibrous scaffolds and microparticles respectively, will be presented. Then, we will study more deeply how the surface potential develops on the top surface of the scaffolds during its production by electrospinning. In the third part, we will show how the surface potential decreases with time. Such property is of prime importance for electret applications and also for the fabrication of 3D structured fibrous constructs thanks to the help of electrostatic interactions which will be studied in the final part.
1.1 The processes of electrospinning and electrospraying
1.1.1 Electrospinning
Electrospinning is a process allowing the fabrication of nanofibers by subjecting a polymer solution to a high electric field. The original idea of electrospinning dates back to early twenty century [1]–[4]. Based on its simplicity, versatility and low cost, electrospinning already becomes one of the most representative and efficient approach generating nano-structured materials in the past decades [5]. Until now, it is not only available to prepare nanofibers with a wide range of raw materials in terms of natural polymers [6], synthetic polymers [7], polymer blends [8] as well as organic and inorganic complexes [9]. The controllability of the morphology and the diameter of fibers can be tuned to control the mechanical properties, the porosity and the surface-to-volume ratio of the resulting electrospun nanofibrous mats. Due to its numerous advantages, electrospinning has been applied in various fields including filters [10]–[12], sensors [13], [14], drug delivery [15]– [17], tissue engineering [18]–[20], catalysts [21]–[23], and energy conversion [24], [25].
Fig. 1.1 (A) Illustration of the setup of electrospinning. (B) Scanning electron micrograph displaying the nanofiber morphology of an electrospun non-woven mat
Reprinted with the permission from [26]
Electrospinning uses a high electric field to form nanofibers from a polymer solution [27], [28]. As shown in Fig. 1.1, the typical setup is made of three main parts: (i) a voltage power supply, (ii) an emitter electrode connected to a high voltage from which the polymer solution is ejected and (iii) a collector connected to the ground. In the process of electrospinning, a syringe delivering the polymer solution is pushed by a syringe pump to dispense the liquid to the emitter, generally a stainless needle. When the voltage is applied at the needle, electrical charges accumulate at the surface of the droplets exiting the needle. If the voltage is enough high, it deforms in the shape of a cone called the Taylor cone. When the electric force overcomes the surface tension of the droplet, a jet of the polymer solution is propelled from the apex of the Taylor cone towards the collector. Before hitting the collector, the charged jet experiences whipping movements favoring the decrease of the fiber diameter and the solvent evaporation. In the end, a solidified fiber is randomly deposited on the collector in the form of a non-woven mat also called scaffold or membrane.
The polymer chain entanglements in the processed solution play an important role to form a continuous jet under the action of the electric field. The density of chain entanglements is a function of the polymer molar mass and its concentration in the solution, it can be characterized by the viscosity of the solution[29]. The viscoelastic force increases as well to counterbalance the stretching force allowing to the jet to not split into offspring particles [30]. If the viscosity decreases to a certain level, the jet breaks into particles and the process is called electrospraying [31]. As shown in Fig. 1.2, Lavielle et al. studied the relationship between the fiber diameter and the product of the polymer concentration C in the
solution with the molar mass, represented by the intrinsic viscosity [ƞ] [32]. Similarly, to
[ƞ]C, the ratio C/C*
can be used, where C* represents the critical chain-overlap concentration
[33]. When [ƞ]C is located in the domain 4, the viscosity of the solution is too high and the
jet cannot be efficiently stretched avoiding the formation of the Taylor cone and thus, avoiding electrospinning. When decreasing the concentration to domain 3, an ideal balance between the electric force and the surface tension of the droplet allows the efficient production of an electrospun jet resulting in the production of uniform fibers (Fig. 1.2c). It is shown that the diameter of fibers decreases with the decrease of the polymer concentration. If the concentration is decreased in the domain 2, beaded fibers are formed (Fig. 1.2b) due to hydrodynamic instabilities caused by the forces acting at the surface of the jet which favor the decease the jet surface area. Finally, when the concentration is still decreased in domain 1, only electrosprayed particles are collected (Fig. 1.2a). Because of the low polymer concentration in the solution, chain entanglements are not sufficient to avoid the breaking of the jet resulting in the deposition of microparticles [34]. The process of electrospraying [35] will be presented more precisely later.
Fig. 1.2 SEM images of electrosprayed PCL particles (a), beaded PCL fibers (b), electrospun
PCL fibers (c) and variation of fibers average diameter with [ƞ]C (d): 1: electrospraying, 2:
beaded electrospun fibers, 3: bead-free electrospun fibers and zone 4: no electrospinning Reprinted with the permission from [32]
Besides the intrinsic viscosity and surface tension, the main factors affecting the morphology of the fibers include the conductivity of the solution, the applied voltage, the polymer solution flow rate, the needle-to-collector distance and the ambient humidity and temperature.
Regarding the study of the effect of the parameters on the fiber morphology, studies have shown that the conductivity affects significantly the fibers diameter. When, thanks to high conductivity, the electrospun jet has the capability to transport a large amount of charges, the jet undergoes a stronger stretching force under the electric field resulting in the decrease of the fiber diameter. However, some articles reported the inverse situation showing that the
fiber diameter can increase with the amount of salt added within the solution [36], [37]. Supaphol et al. analyzed that the jet containing more salts experienced simultaneously an increasing strength in the electrostatic and Coulombic repulsion forces. Whereas the former factor speeds up the flowing rate enlarging the diameter, the latter force enhances the repulsive power stretching the jets [38]. Additionally, changing the type of salt (in terms of compositions and molar mass) in the solution induces different effects on the fiber diameter which might be attributed to various physical-chemical interactions [37].
The applied voltage has to reach a critical value to overcome the surface tension of the droplet in order to eject the jet from the tip of the Taylor cone, leading to the deposition of a continuous fiber. In most cases, the increase of the voltage, inducing the amount of charge density carried by the jet, leads to the decrease of the fiber diameter [39]. However, some articles reported the inverse tendency. Indeed, the enlargement of charge density due to a higher applied voltage results in larger whipping movements experienced by the electrospun jet. Thus, in the same time, the jet is subjected to an increase of the elongation force (favoring the decrease of the diameter) as well as an increase of the rate of solvent evaporation (favoring the increase of the diameter). Thus, some reports found that by increasing the voltage, the faster evaporation avoids the efficient stretching resulting in fibers with larger diameter [40], [41].
For a given set of parameters, a polymer solution system has its own lowest critical flow rate to maintain the generation of continuous jets. Actually, a flow rate which is too low contributes to a rapid solvent evaporation resulting in less fusion formed in the fiber-fiber contact domains and furthermore few beads can appear on the fibrous mesh [42]. The increase of flow rate leads to the increase of the diameter of fibers. Furthermore, when the flow rate is high, the insufficient evaporation of solvents happens resulting in the fusion of the fiber-fiber contact domains in the mat, flat ribbons instead of cylindrical fibers might be produced [42], [43]. Such morphology has an important impact on the final mechanical properties of the mat.
The influence of ambient humidity on the morphology of fibers depends mainly on the polymer-solvent hydrophily or hydrophobicity and the solvent volatility. In the process of electrospinning, a hydrophilic jet can absorb the water molecules of air causing a plasticizing effect. Thus, a slow solidification occurs leading to the efficient jet stretching for a longer time resulting in the generation of thinner fibers. Pelipenko et al. investigated the effect of relative humidity on the morphology of fibers prepared from hydrophilic polymers, such as
PEO and PVA fibers, showing the decrease of the fiber diameter with the increase of the ambient humidity [44]. Other studies reported the same phenomenon [45]–[47]. In the case of hydrophobic polymers, an opposite trend is observed. Indeed, in the case of high humidity, a growing number of water molecules around the jets facilitate the electrostatic discharge and also the precipitation of the polymer resulting in weaker whipping movements and a less deformable jet. Therefore, thick fibers are fabricated after increasing the relative humidity [48]–[52].
The temperature experienced during the process of electrospinning plays also an important role on the final fibrous morphology. Indeed, the viscosity of the polymer solution decreases with increasing the temperature due to higher polymer chain mobility. Thus, a jet of lower viscosity is more deformable and consequently more stretched under the Columbic force: thinner fibers are produced [40], [46], [53]–[55]. De Vrieze et al. found that there are two opposing effects when the temperature is modified. Indeed, although increasing the temperature reduces the viscosity, it also favors the solvent evaporation which has an opposite effect on the final fiber diameter. Such phenomenon was shown for the electrospinning of poly(vinylpyrrolidone) (PVP) for which smaller diameters were measured for the lowest air temperatures. This effect was attributed to the weak volatilization rate extending the period for jet to solidify. The jet is consequently elongated in a longer length leading to thinner produced fibers [46]. Bipul et al. also observed that for non-hydrosoluble polymers low temperatures, as also high air humidity, facilitate the appearance of surface irregularities due to phase separation [51].
The emitter-to-collector distance affects the average electric field between the emitter and the collector. However, such effect is negligible. The main property which is mainly affects by the emitter-to-collector distance is the time of jet flight allowing more or less time for the solvent to evaporate. Indeed, the morphology of fibers can change remarkably as a function of the emitter-to-collector distance. Ki et al. proved that there is a minimum distance allowing enough time for the solvent to evaporate efficiently otherwise a liquid film is formed at the surface of the collector. At intermediate emitter-to-collector distance the presence of residual solvent leads to the fusion of fibers at their contact points modifying the overall mechanical properties of the mat. [56]. Doshi et al. observed that the amount of fibers generated on the collector drops down remarkably when the needle-to-collector are too large [57].
1.1.2 Electrospraying
As mentioned previously, the morphology can be varied from regular nanofibers to microparticles by simply decreasing the density of polymer chain entanglements in the processed solution. In this case, the process is named electrospraying. Nowadays, a wide range of polymers can be used for the fabrication of electroprayed particles, including PLA, PCL, PGA, PLGA, PS,…[58]–[62]. Such fabricated microparticles are of great interest for various biomedical and drug encapsulation applications [63], [64].
Bock et al. shows the effect of the polymer concentration and viscosity on the morphology of the produced electrosprayed particles (see also Fig. 1.2) [33], [65]. They
found that there is a critical chain overlap concentration Cov for which the particles can be
produced by electrospraying and that the particle morphology is related to Cov [33]. Figure
1.3 shows that no overlap occurs among the polymer chains when the concentration C is
smaller than Cov, it is called the dilute regime, the droplets are deposited into the form of film
or flat particles. By increasing the concentration to the semi-dilute unentangled regime, some portions of polymer chains are entangled leading to the deposition of irregular and fused particles on the collector as shown in Fig. 1.3b. By increasing even more the concentration over the critical value Cent, the state of the polymer solution system enters from semi-dilute unentangled regime to semi-dilute entangled regime, for which isolated and solid particles with spherical morphology are obtained. When the concentration is larger than 3Cov, the chain entanglement is too high and beaded fibers are obtained: particles are interconnected by a network of thin nanofibers as shown in Fig. 1.3d.
Fig. 1.3 Left side: physical representation of entanglement regimes achieved in different polymer concentrations. Right side: SEM images of corresponding PCL particles Reprinted
with the permission from [33] 36
The morphology of the particles is mostly affected by the rate of solvent evaporation. An efficient and homogeneous evaporation leads to the fabrication of isolated round microparticles. When evaporation is incomplete, particles are flat. Furthermore, when the solidification occurs very rapidly at the surface of the particle during its flight, the solid surface shrinks leading to the deposition of rough particles [66]–[68].
Fig. 1.4 Variation of particle morphology with increasing Pe Reprinted with the permission from [69]
Yao et al. [69] correlated the morphology of electrosprayed particles with a modified Peclet number (Pe). As shown below, Pe reflects the relation between the shrinking rate of the droplet surface and the polymer diffusion coefficient in the droplets, which represents the solvent volatilization rate and polymer diffusion rate, respectively.
𝑃𝑒 =
𝑟𝑑.𝑑𝑟𝑑𝑑𝑡
𝐷𝐴𝐵 (1.1)
𝑑𝑟𝑑⁄ is the shrinking rate of droplets, rd𝑑𝑡 is the diameter of the droplet and DAB represents
the diffusion rate of the polymer in the droplets.
When Pe has a large value meaning that the diffusion rate is slow, the generation of a solidified surface can happen quickly resulting from the rapid solvent evaporation on the surface of droplets. The hysteretic evaporation of solvent inside the droplets leads to a solvent-rich domain which causes a hollow structure in the particles after the complete solvent evaporation. Depending on the thickness and the mechanical strength of the shell of particles, portions of particles may perform a concave or fragmented morphology.
By increasing the diffusion rate, polymers can move rapidly from the core region to the surface where fast solvent evaporation occurs, thus no hollow sphere is generated. However, the rate of diffusion is still large enough to remove all solvent-rich domains in the droplets, as a result, porous and corrugated topography appears on the surface of particles.
By increasing even more the diffusion rate to reach a critical value, the polymer fills homogeneously all the volume of the electrosprayed droplets evenly and instantly before the evaporation of solvent happening from the surface, thus dry particles with smooth surface are formed in the end.
Fig. 1.5 Diverse morphologies of PLGA particles Reprinted with the permission from [70]
Besides the effects of solvent volatilization and polymer diffusion, Almeria et al. analyzed the effects of chain entanglements and Coulomb fission during the process of electrospraying on the morphology of PLGA particles [70]. When the charge density of particles reaches the Rayleigh limit [71], the electric force induced by Coulomb fission overcomes the surface tension of droplets resulting to the disintegration of the droplets into small offsprings. As shown in Fig. 1.5, particles interconnected with very thin nanofibers are generated when entanglements between the polymer chains occur before reaching the Rayleigh limit (Fig. 1.5c). In contrast, the disruption of droplets occurs when the intensity of
Coulomb fission was enough large. Depending on the solvent evaporation rate, spherical morphology are obtained (Fig. 1.5a) whereas for rapid solvent evaporation, if the solidification and the fission progresses simultaneously, it results in particles with irregular morphologies, such as elongated particles (Fig. 1.5b).
Other researchers used a water bath to collect the generated electrosprayed particles with controlled porous structures. Such process allowed also to functionalize and encapsulate a drug for drug delivery and release applications [72], [73]. When non-water soluble polymers are electrosprayed in a water bath, it was shown that the presence of water around the particles leads to phase separation and solvents exchange, resulting in the formation of pores at the particle surface which affects the drug release properties.
1.2 Electric current produced during electrospinning
After applying the voltage on the electrospinning emitter, charges of same sign than the emitter’s polarity move to the surface of the droplet exiting the emitter resulting to a high surface charge density. If the surface charge density is high enough, the hemispherical droplet deforms into the Taylor cone. Once the electric force overcomes the surface tension, the ejection of a jet occurs at the apex of the cone, removing the excess of charges on the drop. Thus, the resulting electrospun jet carried a high amount of charges and after its flight and solvent evaporation, a charged solid nanofiber is deposited on the collector. When the collector is a conducting metal, the charges can be released in an efficient manner towards the ground [74].
As mentioned previously, the initial charges in the droplet of the polymer solution are distributed on the surface of the droplet resulting in the formation of the Taylor cone by a stretching force. The droplet is undergoing a capillary pressure originated from the surface
tension, ∆𝑃𝑐 = 2𝜎/(𝐷/2), as well as a pressure originated from the Coulombic electrical
pressure, ∆𝑃𝑒 = −𝑒2/(32𝜋2𝜀0(𝐷/2)4. The electric pressure dominates the capillary pressure
for a small droplet. Thus, taking into account both equation, a droplet of a given diameter D
can withstand a maximum charge per unit mass which is given by ∆𝑃𝑐 + ∆𝑃𝑒 = 0 [75] :
𝑒 𝑀= �
288𝜀0𝜎
𝜌2𝐷3 (1.2)
Where σ is the surface tension, ε0 is the vacuum permittivity, e is the total charge
carried by the droplet and M is the mass of the droplet and 𝜌 its density. In this condition,
there is no consideration about any external interference. Eq. 1.2, called the Rayleigh criterion, shows that the maximum charge amount decreases with the increase of the size of the droplet [75]. Here, Eq. 1.2 does not take into account the evaporation which occurs at the saturation pressure. Moreover, the conductivity and the viscosity of the solution play also a role in the shape of the Taylor cone but with a less significant manner.
The amount of charges carried by the electrospun jet can be estimated by the measurement of the current during the process. By installing a resistor between the collector and the ground, the measurement of the difference of potential through the resistor allows to
calculate the electrospinning current thanks to the Ohm’s law (Fig. 1.6 a). The volume charge
density ρ and surface charge density q are calculated by the following equations:
𝜌 =𝑄𝐼 (1.3)
𝑞 =𝜌𝑑4 (1.4)
Where I represent the current, Q is the flow rate, d is the diameter of the jet at the tip of Taylor cone, q is the surface charge density.
Fig. 1.6 (a) Measurable process parameters; (b) Effect of applied voltage on jet current. The curve shows the power-law fitting the experimental data. The fitted equation and R2 value
are shown
Reprinted with the permission from [76], [77]
Fig. 1.6 b presents, during the process of electrospinning a polyacrylonitrile solution, a power-law dependence between the electric current and the voltage with an exponent of 2.62. This behavior was attributed to a growing amount of charges injected into the solution or melt from the increasing voltage. Thus, the jets formed under the highest voltage transports an increased amount of charges. A similar exponents of 2.7 to 3 was measured in other reports [78], [79]. However, Shin et al. obtained a linear relation between the current and the applied voltage in the condition of lower flow rates [80].
Fig. 1.7 (a) Schematic of the modified setup for the measurement of the currents passing R1 and R2, respectively. The collector plate is divided into two parts A1 and A2, which are separated from each other by a thin insulator film. Current on the plates is determined using the voltage drops across 1 MΩ resistors (R1 and R2) measured by multimeters (M1 and M2);
(b) fluorescent clusters of electrosprayed traces of solvent seen on the glass slide Reprinted with the permission from [81]
Some reports have shown in some cases that there might be two types of currents composing the total current during electrospinning. As shown in Fig. 1.7a, the main current is formed by the flowing jets deposited on A1, which varies with the electric field. Another type of current recorded on A2 is due to the generation of electrosprayed solvent droplets from the surface of the jet (Fig. 1.7 b), which is independent of the electric field, but related with the flow rate and the conductivity of the polymer solution. The origin of a current due to electrosprayed droplets might be attributed to the uneven distribution of polymers in the solution. Thus solvent-rich domains lead to the emission of droplets out of the jet during the whipping movements [81]. Yarin et al. found that the stability of the surface of the jet can change with the modification of the electric field, resulting in secondary jets emitted from the surface of the main jet [82]. Furthermore, the redistribution of charges on the jet resulting from the whipping movements is a factor to account for the formation of secondary jets [83].
Fig. 1.8 SEM images of eletrospun 0.75% (w/v) HA nanofibers at different volume ratio of DMF to deionized water (DW): (a) DMF/DW= 0:1, (b) DMF/DW= 0.25:1, (c) DMF/DW= 0.5:1, (d) DMF/DW= 1:1; Conductivity and surface tension of 0.75% (w/v) HA solutions with different solvent. 0:1, 0.25:1, 0.5:1, and 1:1 represent the volume ratio of DMF to DW
Reprinted with the permission from [84]
It has been widely accepted that the solvent properties affect the electrospinnability of the polymer solution and control the morphology of the deposited fiber. Among these properties, the nature of the solvent affects the amounts of charges carried by the jet. As shown in Fig. 1.8, the increase of the amount of DMF in the DMF/DW solvent mixture leads to the decrease of the surface tension as well as the solution conductivity which balance both forces responsible to the formation of the Taylor and thus the generation of the electrospun jet. When the conductivity of the polymer solution decreases gradually it results in fewer charges carried by the jet. Thus, the intensity of the electric force imposed on the jet is weaker favoring the enlargement of the diameter of the jet. Therefore, the diameter of fibers increases with the increasing DMF content [84]. Other researchers report similar results about the modification of the mixing ratio of solvents on the electrospinnability of the polymer solution and thus, on the morphology of the fibers [85], [86].
Fig. 1.9 Impact of RH on measurable parameters for 12 wt% PVP/ ethanol solutions. (a) Jet diameter and current versus RH. Diamonds: current (I), squares: jet diameter (djet)
Reprinted with the permission from [76]
Fig. 1.9 shows the correlation of the electric current and the jet diameter with the ambient humidity during electrospinning of PVP in solution in ethanol, a hygroscopic polymer mixture. It is shown that, in this case, the electric current decreases gradually with the increase of the ambient humidity, while the humidity increases the jet diameter. At high humidity, the high amount of water molecules leads to the significant weakening of the surface charge density carried by the jet which was attributed to the polarization of water molecules: the charges located at the jet surface are neutralized by the surrounded water molecules resulting in the decrease of the current. Furthermore, at high humidity, the electrospun jet is thus subjected to low whipping movements (which are favored by the repulsive charges carried by the jet) resulting in the increase of the fiber diameter [87], [88]. For hydrophobic polymer-solvent mixtures the situation may be different.
In conclusion, the high electric field allows the production of charges at the surface of the droplet exiting the emitter and leading to the formation of the jet. The charges are transported by the flying jet. Depending on the processing conditions, a fraction of the total amount of charges produced at the emitter are lost along the jet by various phenomena (corona discharge, charge removal by humidity, solvent evaporation and secondary solvent electrospraying) while the rest of charges is deposited when the fiber enters in contact with the collector resulting in the electrospinning current flowing towards the ground (Fig. 1.10) [29].
Fig. 1.10 Schematic diagram of a typical electrospinning experiment showing all the mechanisms of charge transports. Reprinted with the permission from [29]
1.3 Surface potential on a fibrous mat: in-situ charging during
electrospinning and charge release
1.3.1 In-situ charging by electrospinning - development of the surface potential
As discussed in the former section, the charges are produced thanks to the high imposed electric field. The charges are then transported by the electrospun jet and in the end, when the solidified fiber hits the metallic collector, the charges are released towards the ground. The resulting continuous transfer of charges to the ground is thus responsible of an electrical current. Actually, the deposited fibers, which are in most cases dielectric materials, can maintain residual charges over a long period of time that can produce an external electric field oppositely to the electric field imposed by the power supply. For long times of deposition, charges accumulate in the deposited fibrous mat leading to the formation of a surface potential limiting the deposition of the incoming electrospun fiber.
The capacity of the charge storage of the fibrous mat is related with the nature and the structure of the fibers and the mat. The inner structure, such as impurities, crystallinities and polymer defects, plays also an important role by offering traps which can remain the charges on the surface or the core of the fibers and the mat. Former studies reported that surface traps might result from additives, impurities and broken polymer chains [29], [89]. The traps are
located at the interface of different phases or crystalline regions. In fact, the existence of traps in the fibers decreases the charge release resulting in a growing number of charges stored on fibrous mats during electrospinning [90].
Fig. 1.11 (a) Schemes of the far-field electrospinning process. (b) Poly (vinylidene fluoride– co–trifluoroethylene) (PVDF–TrFE) is oriented with the direction of the electric field and the local electric field is generated by residual charges. (c) Simulation results of the local electric
field by residual charge with or without electrospun mat Reprinted with the permission from [91]
Regarding the accumulated residual charges on the fibrous mat during electrospinning, Choi et al. [91] have shown that a local electric field between the nanofibers and the electrode develops during the processing time. This effect is due to the fact that dielectric fibers are deposited on the collector and form an insulating porous layer limiting the charge release towards the ground (Fig. 1.11). The residual charges generate thus a local electric field related with the intensity of the volume charge density and the thickness of the fibrous mesh. The equation is presented as followed:
𝐸 =𝜀𝜌𝑡
𝑟𝜀0 (1.5)
Where 𝜌 is the volume charge density, t is the thickness of fibrous mesh, 𝜀𝑟 is the
relative permittivity of the studied PVDF–TrFE polymer and 𝜀0 is the permittivity of vacuum.
It indicates that the strength of the local electric field enhances with the increase of the thickness of the fibrous mat. However, such too simplistic model does not take into account the fact that the mat is a composite porous material made of polymer and air. Furthermore,


![Fig. 1.12 Thermally stimulated relaxation spectra of PBT near melting Reprinted with the permission from [90]](https://thumb-eu.123doks.com/thumbv2/123doknet/14285853.492091/48.892.271.623.200.498/fig-thermally-stimulated-relaxation-spectra-melting-reprinted-permission.webp)


