HAL Id: hal-02495627
https://hal.archives-ouvertes.fr/hal-02495627
Submitted on 27 May 2020
HAL is a multi-disciplinary open access archive for the deposit and dissemination of sci-entific research documents, whether they are pub-lished or not. The documents may come from teaching and research institutions in France or abroad, or from public or private research centers.
L’archive ouverte pluridisciplinaire HAL, est destinée au dépôt et à la diffusion de documents scientifiques de niveau recherche, publiés ou non, émanant des établissements d’enseignement et de recherche français ou étrangers, des laboratoires publics ou privés.
Distributed under a Creative Commons Attribution| 4.0 International License
methane emission in Holstein dairy cows
Yuliaxis Ramayo-caldas, Laura Zingaretti, Milka Popova, Jordi Estellé,
Aurelien Bernard, Nicolas Pons, Pau Bellot, Nuria Mach, Andrea Rau, Hugo
Roume, et al.
To cite this version:
Yuliaxis Ramayo-caldas, Laura Zingaretti, Milka Popova, Jordi Estellé, Aurelien Bernard, et al.. Iden-tification of rumen microbial biomarkers linked to methane emission in Holstein dairy cows. Journal of Animal Breeding and Genetics, Wiley, 2019, 137 (1), pp.49-59. �10.1111/jbg.12427�. �hal-02495627�
J Anim Breed Genet. 2019;00:1–11. wileyonlinelibrary.com/journal/jbg
|
1 O R I G I N A L A R T I C L EIdentification of rumen microbial biomarkers linked to methane
emission in Holstein dairy cows
Yuliaxis Ramayo‐Caldas
1,2|
Laura Zingaretti
3|
Milka Popova
4|
Jordi Estellé
1|
Aurelien Bernard
4|
Nicolas Pons
5|
Pau Bellot
3|
Núria Mach
1|
Andrea Rau
1|
Hugo Roume
5|
Miguel Perez‐Enciso
3|
Philippe Faverdin
6|
Nadège Edouard
6|
Dusko Ehrlich
5|
Diego P. Morgavi
4|
Gilles Renand
1This is an open access article under the terms of the Creative Commons Attribution License, which permits use, distribution and reproduction in any medium, provided the original work is properly cited.
© 2019 The Authors. Journal of Animal Breeding and Genetics published by Blackwell Verlag GmbH 1UMR 1313 GABI, INRA, AgroParisTech,
Université Paris‐Saclay, Jouy‐en‐Josas, France
2Animal Breeding and Genetics
Program, IRTA Torre Marimon, Caldes de Montbui, Spain
3Department of Animal Genetics,
CRAG, UAB, Bellaterra, Spain
4VetAgro Sup, UMR 1213
Herbivores, INRA, Université Clermont Auvergne, Saint‐Genès‐Champanelle, France
5INRA METAGENOPOLIS Unit, Jouy‐en‐
Josas, France
6UMR 1348 PEGASE, INRA, Agrocampus‐
Ouest, Saint‐Gilles, France
Correspondence
Yuliaxis Ramayo‐Caldas and Gilles Renand, UMR 1313 GABI, INRA, AgroParisTech, Université Paris‐Saclay, Jouy‐en‐Josas, France.
Emails: yuliaxis.ramayo@irta.cat (Y. R.‐C.) and gilles.renand@inra.fr (G. R.)
Funding information
APIS‐GENE
Abstract
Mitigation of greenhouse gas emissions is relevant for reducing the environmental impact of ruminant production. In this study, the rumen microbiome from Holstein cows was characterized through a combination of 16S rRNA gene and shotgun metagenomic sequencing. Methane production (CH4) and dry matter intake (DMI) were individually measured over 4–6 weeks to calculate the CH4 yield (CH4y = CH4/ DMI) per cow. We implemented a combination of clustering, multivariate and mixed model analyses to identify a set of operational taxonomic unit (OTU) jointly associ-ated with CH4y and the structure of ruminal microbial communities. Three ruminotype clusters (R1, R2 and R3) were identified, and R2 was associated with higher CH4y. The taxonomic composition on R2 had lower abundance of Succinivibrionaceae and
Methanosphaera, and higher abundance of Ruminococcaceae, Christensenellaceae
and Lachnospiraceae. Metagenomic data confirmed the lower abundance of Succinivibrionaceae and Methanosphaera in R2 and identified genera (Fibrobacter and unclassified Bacteroidales) not highlighted by metataxonomic analysis. In addi-tion, the functional metagenomic analysis revealed that samples classified in cluster R2 were overrepresented by genes coding for KEGG modules associated with meth-anogenesis, including a significant relative abundance of the methyl‐coenzyme M reductase enzyme. Based on the cluster assignment, we applied a sparse partial least‐ squares discriminant analysis at the taxonomic and functional levels. In addition, we implemented a sPLS regression model using the phenotypic variation of CH4y. By combining these two approaches, we identified 86 discriminant bacterial OTUs, notably including families linked to CH4 emission such as Succinivibrionaceae, Ruminococcaceae, Christensenellaceae, Lachnospiraceae and Rikenellaceae. These selected OTUs explained 24% of the CH4y phenotypic variance, whereas the host ge-nome contribution was ~14%. In summary, we identified rumen microbial biomark-ers associated with the methane production of dairy cows; these biomarkbiomark-ers could be
1
|
INTRODUCTION
Cattle have the remarkable ability to digest and transform non‐edible plant cell wall components into high‐quality pro-teins for human consumption. The digestion of feeds entails, however, the production of the greenhouse gas CH4. The possibility to mitigate CH4 emissions while simultaneously improving feed efficiency is highly relevant for the sustain-ability of cattle production systems. Notwithstanding, the mechanisms to achieve it are not yet fully understood (Flay et al., 2019). The contribution of the gastrointestinal micro-biota to feed digestion and enteric CH4 production is well established in ruminants (Delgado et al., 2019; Difford et al., 2018; Huws et al., 2018; Ross, Moate, Marett, Cocks, & Hayes, 2013; Tapio, Snelling, Strozzi, & Wallace, 2017). However, enteric CH4 production is a complex trait de-termined not only by the rumen microbiome (Huws et al., 2018; Ross et al., 2013; Tapio et al., 2017), but also by host genetics (Difford et al., 2018; Ross et al., 2013), and envi-ronmental factors (Gerber et al., 2013; Martin, Morgavi, & Doreau, 2009; McAllister, Cheng, Okine, & Mathison, 1996). Exploring the abundance and composition of mi-crobial communities in the gastrointestinal tract of cattle in relation to the host genome is of great interest for quantify-ing animal variability in feed digestibility and enteric CH4 emission (Huws et al., 2018; Leahy et al., 2013; Li et al., 2019). Several studies in ruminants have explored the re-lationship of the rumen microbiota composition with feed efficiency and CH4 emission (Delgado et al., 2019; Jami, White, & Mizrahi, 2014; Jewell, McCormick, Odt, Weimer, & Suen, 2015; Li et al., 2019; Myer, Smith, Wells, Kuehn, & Freetly, 2015; Wallace et al., 2015). Pioneering rumen‐engi-neering studies have suggested that microbial communities are highly resilient and host‐specific (Cole, 1991; Weimer, 2015). Although these latter properties make it difficult to manipulate the ruminal microbial community, they also en-able the analysis of the covariation of these ecosystems with host performance and jointly selecting both host genome and microbiome variants.
The main goal of this study was to implement an in-tegrative approach using 16S rRNA and shotgun metage-nomic sequencing data to identify microbial biomarkers linked to CH4y emission. In addition, we also explored the role of host genetics on the determinism of this phenotype.
2
|
MATERIALS AND METHODS
2.1
|
Phenotype and host genotype details
The experiment was carried out at the INRA experimental farm in Méjusseaume (Le Rheu, France). Management of experimental animals followed the guidelines for animal research of the French Ministry of Agriculture and other applicable guidelines and regulations for animal experi-mentation in the European Union (European Commission, 2010). Approval number for ethical evaluation was APAFIS:3122‐2015112718172611. Sixty‐five loose‐housed lactating Holstein cows were used in this experiment. They were allocated to three pens equipped with individual troughs and automatic gates detected by radio‐frequency identifica-tion tags attached on the cow ears. Each pen was of simi-lar size (n = 21–23). Parity was equilibrated between pens, with two‐thirds of the cows that were in their first lactation (n = 42). Cows received the same total mixed ration (TMR) throughout the experiment consisting of maize silage (65%), soybean cake (18%) and energy concentrate (8%), composed of corn, wheat, barley, dehydrated beet pulp, dehydrated al-falfa (8%) and minerals (Table S1). The TMR was offered ad libitum and individually weighed every morning. Each morn-ing, refusals from the previous day were weighed. Samples of forages, concentrates and refusals were analysed for dry matter content. Dry matter intake was calculated daily as the difference between offered and refused dry matter weights.
Methane production was measured with two GreenFeed emission monitoring (GEM) systems (C‐Lock Inc.). This sys-tem automatically measures CH4 when animals visit a con-centrate feeder equipped with a head hood and an extractor fan for the capture of breath and eructation gases. The animals are attracted and kept attracted to the feeder with pellets that are distributed in small quantities. In the current experiment, the cows were allowed to visit the GEM a maximum of four times per day, with each visit separated by at least 6 hr. At each visit, cows received six drops of concentrate separated by 30 s for at least 3 min. At each visit, CH4 production rate is calculated, combining the gas concentration (measured with a non‐dispersive infrared analyser) to the airflow in the pipe (measured with a flow meter). An algorithm developed and applied by C‐Lock Inc. calculates the CH4 rate at each visit if the head of the animal is correctly positioned (controlled by a laser beam) for at least 2 min. With two GEM systems and used for targeted methane‐reduction selection programmes in the dairy cattle industry provided they are heritable.
K E Y W O R D S
three batches, the following experimental design was applied: during a first period (6 weeks in January–February 2017), cows in batches B1 (n = 21) and B2 (n = 21) were measured and rumen liquid sampled. During a second period (the next 4 weeks in March 2017), cows in batch B1 were measured again and sampled together with cows in batch B3 (n = 23). The daily dry matter intake (TMR and concentrate in the GEM system) and the per‐visit CH4 emission rate measures were averaged over the testing periods to estimate the indi-vidual dry matter intake (DMI), methane emission rate (CH4) and methane yield (CH4y = CH4/DMI). The traits were ad-justed beforehand for the contemporary group mean in a sim-ple linear model including the batch × period effect:
where y is the trait value vector, b the fixed effect vector of the contemporary group (batch × period) effect and e the re-sidual phenotype.
Rumen fluid (~400 ml) was sampled via oesophageal tubing in the morning before feeding (last week of February for period 1 and last week of March for period 2). The av-erage days in milk (DIM) in period 1 were 148.5 (SD 12.5) and 182.8 (SD 18.6) in period 2. Samples were filtered through a polyester monofilament fabric (250 μm mesh ap-erture), and 2 ml of the filtrate was centrifuged at 20,000 g, 20 min, 4°C. The supernatant was discarded, and the pellet was snap‐frozen in liquid nitrogen and stored at −80°C.
The Illumina BovineSNP50 v.2 BeadChip (Illumina Inc.) was used to genotype the 65 Holstein cows. Quality control was performed to exclude single nucleotide polymorphisms (SNPs) with minor allele frequencies (MAF) <5%, rates of missing genotypes above 10%, as well as those that did not conform to Hardy–Weinberg expectations (threshold set at a
p‐value of .001). We also excluded SNPs that did not map
to the bovine reference genome (ARS‐UCD1.2 assembly) or that were located on the X‐chromosome.
2.2
|
Rumen microbial DNA extraction,
PCR amplification and sequencing
DNA from rumen liquid fraction was extracted with an estab-lished protocol (Yu & Morrison, 2004). Extracted DNA was sent to the University of Illinois Keck Center for Fluidigm sample preparation and Illumina sequencing. Primers target-ing the V3–V5 region (F357 and R926) were used to amplify a region of 570 base pairs of the bacterial 16S rRNA gene. Archaea‐specific primers (349F and 806R) were used to am-plify a 457‐base‐pair 16S rRNA gene fragment. The amplicons were sequenced on one MiSeq flow cell for 251 cycles. The whole‐metagenome shotgun sequence of 30 samples collected from rumen of Holstein cows with low and high CH4y emission and distributed across the three batches were generated using a quantitative metagenomic pipeline (Supporting Information).
2.3
|
Bioinformatics and statistical analysis
Sequences corresponding to the 16S rRNA gene data were analysed on an in‐house Galaxy‐based graphical user inter-face for IM TORNADO (Jeraldo et al., 2014) and mothur (Schloss et al., 2009) for bacteria and archaea, respectively. The workflow included a quality control step to remove se-quences with Phred scores of <33 and trimmed sese-quences based on expected amplicon length, as well as merge paired reads, remove chimera and select OTUs (97% iden-tity). Finally, after removing doubleton OTUs, only those OTUs representing more than 0.001% of the total were re-tained. Taxonomic classification was based on the SILVA v123 database (Quast et al., 2012) for bacteria and RIMDB (Seedorf, Kittelmann, Henderson, & Janssen, 2014) for ar-chaea. As previously mentioned, animals in the study were divided into groups due to experimental constraints (see Phenotype2.1 section). Therefore, to estimate the stability of ruminal bacterial communities, we used the 16S rRNA gene data of 21 cows in batch B1 that were sampled twice in the two successive periods. In a first step, we estimated and contrasted diversity metrics among time points (T1 vs. T2) with veganr package (Jari Oksanen et al., 2018). Alpha‐diversity was evaluated with the Shannon index (Shannon, 1984), and beta‐diversity was assessed using the Whittaker index (Whittaker, 1972). Subsequently, stability between sampling points was estimated using the RV coef-ficient on the two OTU normalized abundance tables. The RV coefficient was calculated between times points as the total co‐inertia (sum of eigenvalues of the product of two cross‐product matrices) divided by the square root of the product of the squared total inertia. A zero RV score indi-cates no similarity, whereas the RV score approaches 1 for increasing co‐structure between two data sets.
The whole‐metagenome data were processed as fol-lows. Gene abundance profiling was performed using the 16.6 million gene integrated reference catalogue of the rumen microbiome (Junhua et al., 2019). First, low‐quality and host contaminant reads (from Bos taurus genome ARS‐ UCD1.2) were removed using AlienTrimmer (Schubert, Lindgreen, & Orlando, 2016) and Bowtie2 (Langmead & Salzberg, 2012), respectively. For a more detailed infor-mation which includes the creation of gene abundance and KEGG orthologous (KO) tables, as well as the assembly of metagenomic species (MGS) clusters, see the supplemen-tary material (Supporting Information).
2.3.1
|
Structure of the ruminal ecosystem
To infer the structure of ruminal bacterial communities, rumi-notype cluster detection was done using the genera abundance (101 genera based on the bacterial data) in each sample, as previously described for human gut enterotypes (Arumugam
et al., 2011). Briefly, sample clusters were detected using the probability distribution distance metric related to Jensen– Shannon divergence and partitioning around medoids. The optimal number of clusters was determined following the Calinski–Harabasz (CH) index (Caliński & Harabasz, 1974), and the statistical consistency of the corresponding partition was evaluated using the Silhouette coefficient (Rousseeuw, 1987). Furthermore, sample stability within each cluster was estimated through a cluster‐wise Jaccard bootstrap analysis (100 repetitions; Hennig, 2007). The association between predicted ruminotype clusters with CH4y was obtained using a least‐squares analysis as implemented in the lsmeans r package. To identify genera with significantly different abundance among the predicted ruminotype cluster groups, a differential abundance (DA) analysis was performed using the zero‐inflated Gaussian mixture model implemented in the metagenomeseq r package (Paulson, Stine, Bravo, & Pop, 2013), using a threshold for adjusted p‐values of 5%. In ad-dition, a presence–absence (PA) test was also performed to identify genera that were unique for each of the identified clusters.
2.3.2
|
Multivariate analysis
To identify a set of OTUs jointly associated with CH4y phenotypic variation and the structure of ruminal bacte-rial communities, a combination of multivariate analyses was performed using sparse partial least‐squares (sPLS) as implemented in the mixomics r package (Rohart, Gautier, Singh, & Lê Cao, 2017). sPLS is a statistical approach em-ployed to identify a small subset of variables that maximize the covariance between two different data sets (for instance, a table of centred log ratio‐transformed OTUs and rumino-type clusters or CH4y values; Lê Cao, González, & Déjean, 2009). In a first step, sPLS discriminant analysis (sPLS‐ DA) was applied based on sample classification accord-ing to ruminotype cluster assignment. The classification
reliability corresponding to the sPLS‐DA model was as-sessed as function of the prediction maximum distance between overall misclassification error rate and balanced error rate (BER) after fivefold cross‐validation repeated 500 times. In addition, sPLS was also performed in regression model to identify OTUs associated with CH4y phenotypic variation. Subsequently, we implemented a conservative approach and retained only those OTUs found in common between the two approaches for downstream analysis. The sPLS‐DA approach using ruminotype‐like sample classifi-cation was also implemented on the metagenomic data at MGS and functional (KEGG) levels.
2.3.3
|
Mixed model
To estimate the proportion of CH4 and the CH4y pheno-typic variance explained by the host (heritability) as well as by the bacterial community (microbiability), the following Bayesian mixed model was implemented using the bglr r package (Pérez & de los Campos, 2014):
where y is the phenotype vector (i.e., CH4y), 1µ is the inter-cept, g ∼ N(0,G𝝈2 g ) and b ∼ N(0,B𝝈2 b ), G is the genomic relationship matrix (GRM) based on 38,872 autosomal SNPs, and 𝝈2g represents the additive genetic variance. B represents
the microbial relationship matrix, calculated based on the Bray–Curtis dissimilarities distance matrix, and ε is the re-sidual term. A second model was employed using the method proposed by Ross et al. (2013) which build the microbial re-lationship matrix based on the variance–covariance matrix from the log‐transformed and standardized OTU table. In both cases, the models were run using a Gibbs sampler with 30,000 iterations and a burn‐in of 2,000 rounds; we used standard flat priors for the intercept.
3
|
RESULTS AND DISCUSSION
3.1
|
Phenotype description
The descriptive statistics of production and CH4 traits are presented in Table 1. Methane emissions were calculated as the average value of all visits throughout the study. With 2.50 visits per day, emission rates per each cow were cal-culated for an average of 105.1 and 69.7 visits for periods 1 and 2, respectively. This large number of visits to GEM system ensured a precise measurement of the animal phe-notype, as it largely exceeds the recommended 20–30 mini-mum visits (Barchia et al., 2017; Manafiazar, Zimmerman, & Basarab, 2016). The variability among cows for methane production (g/day; CV 11%) was higher than previously reported (Ricci, Rooke, Nevison, & Waterhouse, 2013).
y = 1𝝁 + g + b + 𝜺
TABLE 1 Mean and standard deviation of production and methane emission traits
Trait Unit Mean SD CV (%)
Live weight kg 634 49 8
Dry matter intake
(DMI) kg/day 21.2 2.2 10
Milk production kg/day 31.1 4.8 15 Milk efficiency kg/kg DMI 1.47 0.16 11 GreenFeed visits n/day 2.50 0.53 21
Visit duration s 224 16 7
Methane emission
rate g/day 506 56 11
From period 1 to period 2, the repeatability of the methane emission traits was 0.82 and 0.73 for CH4 and CH4y, re-spectively. These values were lower than the repeatability of production traits (0.95–0.97 for DMI, milk production and milk efficiency). Methane production rate was moder-ately correlated with DMI (Pearson's correlation r = .44) and milk production (r = .28) and was poorly correlated with body weight (r = .16).
3.2
|
Link between ruminotype
structure of ruminal bacterial communities and
CH
4y emissions
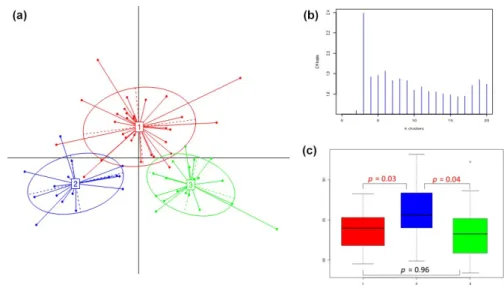
The 16S rRNA gene sequences from 65 rumen liquid frac-tions were analysed. After quality control, bacterial 1,198 OTUs and 1,764 archaeal OTUs were identified (Supporting Information). The relative abundance of bacterial genera in each sample was used for cluster detection as described for human gut enterotypes (Arumugam et al., 2011). This method first performs a sample stratification, followed by the identi-fication of the optimal number of clusters and the statistical consistency of the predicted partition. Cows clustered into three ruminotype clusters (R1, R2 and R3; Figure 1a,b); 30 cows were assigned to R1, 16 to R2 and 19 to R3. In concord-ance with our results, three ruminotype clusters have previ-ously been reported in sheep (Kittelmann et al., 2014), while in dairy cattle (based on a principal coordinate analysis at the OTU level), two clusters were reported by Danielsson et al. (2017). Therefore, we tested sample stability by comparing two (k = 2) or three (k = 3) putative clusters. Cluster‐wise Jaccard bootstrap analysis revealed moderate sample stabil-ity, showing a more stable solution for three (K3: 0.63, 0.64 and 0.63) clusters compared with two (K2: 0.61 and 0.4). In concordance with the aforementioned studies in sheep (Kittelmann et al., 2014) and dairy cattle (Danielsson et al., 2017), we observed a significant association between rumi-notype cluster assignments and CH4y emission (Figure 1c).
Cows that clustered within R2 emitted more CH4y (p < .05) than those clustered in R1 or R3, and no significant differ-ence in CH4y emission was observed between the R1 and R3 clusters (Figure 1c).
We evaluated the taxonomic composition of rumino-type clusters through a combination of presence–absence (PA) and differential abundance (DA) analysis. According to the PA test, the only genera showing significant differ-ences between clusters was Succinivibrionaceae_UCG‐001, which was absent in most cows classified as R2 (high CH4y emission) compared with R1 and R3. Only four cows out of the 16 in R2 had Succinivibrionaceae_UCG‐001, al-beit with a lower abundance compared to the other clusters (Table 2). The DA analysis confirmed the PA test results, as
Succinivibrionaceae_UCG‐001 showed significantly
differ-ent abundance among clusters (Table S2). We note that larger differences in Succinivibrionaceae_UCG‐001 abundance, as well as a greater number of DA genera, were observed be-tween samples classified as R2 and R3 (Table S2). However, no significant difference in Succinivibrionaceae_UCG‐001 relative abundance was observed between R1 and R3 (Table S2). These observations are consistent with previous reports describing members of the Succinivibrionaceae family as-sociated with low CH4 (Danielsson et al., 2017; Kittelmann et al., 2014; Wallace et al., 2015). Furthermore, this is in agreement with the higher CH4y emissions observed in R2. Members of families associated with high CH4 emis-sion, such as Ruminococcaceae, Christensenellaceae and Lachnospiraceae (Kittelmann et al., 2014; Tapio et al., 2017), exhibited DA patterns with higher abundant in R2 compared to R1 and R3 (Table S2). In a similar way, we explored the archaeal taxonomic composition of the ruminotype clusters. According to a DA analysis, significant differences were only detected at the OTU level. Similar to the aforementioned pat-terns at the bacterial level, the largest number of DA OTUs was observed between samples classified as R2 and R3 (Table S3). Of noted, OTU members of Methanosphaera showed
FIGURE 1 Structure of the ruminal bacterial community of lactating Holstein cows displaying natural differences in methane emission. (a) Sample distribution. (b) Calinski–Harabasz (CH) indexes of potential numbers of clusters. (c) Pairwise comparisons of CH4y emission between
ruminotype‐like clusters R1 (red), R2 (blue) and R3 (green)
consistently lower abundance in the R2 cluster (higher CH4 emitters) and were only detected when R2 was compared with R1 or R3. Similar patterns were observed for OTUs classi-fied as Methanobrevibacter ruminantium, which showed lower abundance in R2 compared with R3. Meanwhile, no clear patterns were observed for OTU members of the genera Methanobrevibacter (gottschalkii clade); some OTUs were most abundant in R2, while others showed higher abundance in R1 or R3 (Table S3).
3.3
|
Identification of ruminal OTUs linked
to CH
4y emission and associated with the
structure of the rumen microbiota
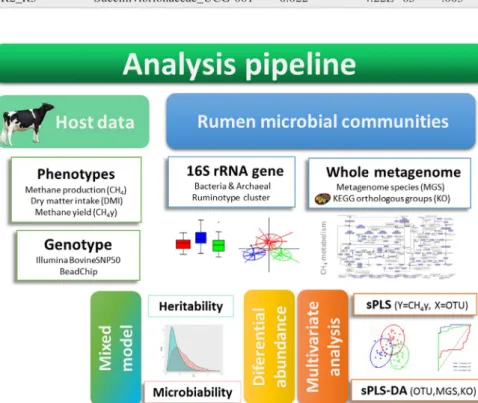
In this study, we used an integrative approach combining multivariate and clustering analyses to identify microbial biomarkers linked to CH4y emission and the structure of the rumen microbiota (Figure 2). We are aware that in compari-son with a predictive model (which would take into account the total microbial variation), ruminotype cluster approaches may have some limitations for biomarker identification (Costea et al., 2018; Knights et al., 2014). However, as pre-viously reported (Danielsson et al., 2017; Kittelmann et al., 2014) and confirmed in this work, the link between the struc-ture of the bacterial ruminal ecosystem and CH4y emission
cannot be neglected. Therefore, to conservatively focus on the primary OTU markers associated with CH4y emissions, we combined the cluster analysis results with those of a pre-dictive model. We applied a two‐pronged strategy using mul-tivariate analysis, including a supervised sPLS‐DA (based on sample cluster classification) and a sPLS regression model that considers the joint covariation of OTU relative abun-dances and CH4y emissions (Figure 2). For the sPLS‐DA, the first and second principal component combined the relative abundances of 231 OTUs (PC1 = 200 and PC2 = 31) and allowed a clear discrimination between samples classified as R2 and R3 (Figure S2 and Table S4). The area under the ROC curve corresponding to both R2 (0.97) and R3 (0.92) showed high values, suggesting a good ability of the model to cor-rectly classify these samples. In addition, the sPLS regression model allowed us to identify features that maximize the covar-iance between OTU relative abundance and CH4y phenotype variation. After tuning parameters (fivefold cross‐validation repeated 500 times), a single component was identified as optimal (PC1 Q2h = 0.12), yielding a final selection of 200
OTUs. We then applied a conservative approach, retaining the 86 OTUs that were common to both sPLS analyses (Table S4). We note that 75.5% (65/86) of them were also identified as DA among ruminotype clusters, where selected OTUs dis-played consistent differential abundance patterns (Table S4).
Comparison Genus Odds ratio p Values
Adj p values (BH)
R1_R2 Succinivibrionaceae_UCG‐001 17.72 5.27E−05 .005 R2_R3 Succinivibrionaceae_UCG‐001 0.022 4.22E−05 .003
TABLE 2 Results from the presence– absence test between ruminotype‐like clusters
FIGURE 2 Analytical framework employed to identify microbial biomarkers of methane emission in lactating Holstein cows
The taxonomic classification of these OTUs included fami-lies reportedly linked to CH4 such as Succinivibrionaceae, Ruminococcaceae, Christensenellaceae, Lachnospiraceae, Gastranaerophilales, Rikenellaceae, Bacteroidales_BS11 and Prevotellaceae (Danielsson et al., 2017; Difford et al., 2018; Kamke et al., 2016; Kittelmann et al., 2014).
3.4
|
Rumen microbiome linked to CH
4y
identified through metagenomics
To gain insight into a more precise taxonomic composition and functional processes that differed between ruminotypes, we generated whole‐metagenome data from 30 samples dis-tributed across the two periods and the three ruminotype clusters. After removing low‐quality and host contaminant reads (Supporting Information), an average of 21.3 million reads per sample was produced. Reads were mapped against the rumen gene reference catalogue (Junhua et al., 2019). A total of 608 MGS were identified by MSPminer (Cervino et al., 2019) and 264 KEGG functional modules were detected by consolidating the gene abundance matrix into KEGG an-notations (Supporting Information). In a first step, the overall structure of the ruminal microbial community was explored using non‐metric multidimensional scaling (nMDS) with Bray–Curtis and binary Jaccard dissimilarities inferred from the metagenomic gene abundance matrix (Figure S3). nMDS plots showed a clear relationship between ruminotypes and nMDS patterns for both dissimilarities. After correction for group and period effects, PERMANOVA tests of signifi-cance also showed a significant association between rumi-notype classification and Bray–Curtis (p < .05) and binary Jaccard (p < .01) dissimilarity matrices. The same approach was followed to explore the relationship between rumen ecosystem and CH4y, with nMDS plots showing a tendency of samples to group according to CH4y values. In this case, the PERMANOVA test corrected by group and period was not significant for Bray–Curtis or binary Jaccard (p = .06) dissimilarities.
The MGS and functional profiles of each sample were explored through sPLS‐DA. Based on MGS, the relative abundance of 150 MGS enabled the discrimination between samples (Table S5 and Figure S4). In agreement with the tax-onomic classification of the 86 selected OTUs, members of the Succinivibrionaceae, Lachnospiraceae, Prevotellaceae, Rikenellaceae and Ruminococcaceae families were among the top discriminant MGS. Moreover, 59.3% (89/150) of the MGS were also identified as DA among ruminotype (Table S6). Similarly, to the aforementioned results at the OTU level, a larger number of DA MGS were observed between samples classified as R2 and R3 (Table S6). Interestingly, shotgun metagenomics shows a lower abundance of a MGS affiliated to Succinivibrionaceae (MGS116, fold changeR3,R2 = 1.87, corrected p‐value = .043) in the R2
ruminotype, a finding that agrees with the results of the 16S rRNA gene data. Members of the Succinivibrionaceae have been previously proposed to be responsible for the lower CH4 emissions in wallaby microbiota (Pope et al., 2011). Moreover Succinivibrionaceae was recently identify among the core of heritable rumen bacteria (Wallace et al., 2019) as well as associated with feed efficiency and levels of pro-pionate in beef cattle (Li et al., 2019). Succinivibrionaceae produce succinate as a main fermentation product (O'Herrin & Kenealy, 1993; Santos & Thompson, 2014), which is converted to propionate by other members of the micro-biota and thus less hydrogen might be available for meth-anogens. Co‐exclusion between Succinivibrionaceae and
Methanobrevibacter has been reported in cattle (McCabe et
al., 2015). The use of metagenome data allows identifying other features not revealed by 16S rRNA gene sequences including unclassified Bacteroidales and Fibrobacteres (Table S6) as well as to confirm the patterns of methano-genic archaea members of the family Methanobacteriaceae observed using the metataxomic approach. This is in agree-ment with the previously reported negative correlation be-tween Methanosphaera spp. and CH4 production in sheep (Kittelmann et al., 2014). The only MGS taxonomy clas-sified as Methanosphaera (MGS512) showed lower abun-dance in samples classified as R2 compared with R1 and R3 (fold changeR1,R2 = 5.92, corrected p‐value = .03; fold changeR3,R2 = 8.56, corrected p‐value = .008).
A functional approach using KEGG modules shows a classification of samples according to ruminotype cluster assignation. The sPLS‐DA analysis revealed 55 modules; however, the model showed a slightly lower accuracy than for OTUs and MGS analyses (Table S7 and Figure S5). Among the discriminant KEGG modules, there were func-tional modules related to CH4y emission, such as methano-genesis (M00567), C4‐dicarboxylic acid cycle, NAD‐malic enzyme type (M00171, M00172) and acetyl‐CoA pathway (M00422), but also with general functions such as glycol-ysis (M00001), gluconeogenesis (M00003), formaldehyde assimilation (M00345) and crassulacean acid metabolism (M00169; Table S7). A detailed examination of KOs in-volved in the methanogenesis pathway (M00567) revealed that six of them were significantly more abundant in sam-ples classified as R2 (Figure S6). Interesting, five of them (K00205, K00672, K00399, K00580 and K03389) includ-ing the methyl‐coenzyme M reductase (which catalyses the rate‐limiting CH4 synthesis (Scheller, Goenrich, Thauer, & Jaun, 2013; Wongnate et al., 2016) have been suggested as biomarkers for CH4 production across diverse cattle breeds (Auffret et al., 2018). Overall, our results show that shotgun metagenomics is able to provide additional insights into the differences observed with 16S rRNA gene data sets, even with smaller sample sizes. Interestingly, specific KEGG pathways and enzymes appear to be associated with CH4 and
had a moderate discriminant ability of whole‐metagenome data using the sPLS‐DA approach.
3.5
|
CH
4emission heritability and
microbiability
A mixed model was implemented to estimate the proportion of CH4 and CH4y phenotypic variance explained by the host cow genome, the whole OTU matrix (n = 1,198) and the 86 selected OTUs (Figure 2). According to the model based on the whole OTU matrix, the host genome explained ~14% of the CH4 and CH4y, whereas the bacterial community ex-plained around ~16% of CH4 production and 18% of CH4y (Table 3). The estimated CH4 heritability and microbiability on the whole OTU model were consistent with recent results in dairy cattle (Difford et al., 2018). Meanwhile, in agree-ment with previous studies (Saborío‐Montero, 2018), differ-ences between the estimated microbiability were observed depending on the method employed to build the microbial relationship matrix (Table 3). We acknowledge that the number of samples in our study may not be large enough to accurately estimate parameters, which limit the robustness of the model. In spite of this limitation, consistent values of CH4 heritability between models were observed (Table 3). These values are also comparable to those of Difford et al. (2018). It is noted that heritability is similar for the two CH4 emission traits but microbiability was always higher when using CH4y. Our results also suggest a slight improvement of CH4y variance component estimation (up to ~24%) after OTU preselection, but no for CH4 alone (Table 3). Further studies with larger sample sizes and standardized analyti-cal pipelines could provide more reliable estimates of the microbiota contribution to this complex CH4 emission trait.
4
|
CONCLUSION
Our results confirm the link between the structure of the ru-minal bacterial community and CH4 emission. We identified 86 OTUs simultaneously linked to CH4y emission and the
ruminal bacterial community structure. OTUs associated with CH4y emission were predominantly hydrogen‐produc-ing bacteria and explained up to 24% of the CH4y pheno-typic variance, whereas the host genome contribution was around 14%. Some discriminant bacterial OTUs identified by metataxonomic were confirmed by whole metagenome. In particular, samples clustered in R2 (high CH4y emis-sion) showed a lower abundance of Succinivibrionaceae and Methanosphaera spp. as well as a higher abundance of genes coding for functional modules and enzymes involved in methanogenesis. Overall, we report a set of microbial bio-markers that have the potential to be employed for charac-terizing high‐emitting cattle for targeted management in the dairy cattle industry.
ACKNOWLEDGEMENTS
Y. Ramayo‐Caldas was funded by the European Union H2020 Research and Innovation programme under Marie Skłodowska‐Curie grant (P‐Sphere) agreement no 6655919. L. Zingareti is recipient of a FPI grant to achieve the PhD research from Ministry of Economy and Science (MINECO, Spain), associated with the “Centro de Excelencia Severo Ochoa 2016–2019” award SEV‐2015‐0533 to CRAG. The authors warmly thank all technical staff at the INRA Méjusseaume farm for providing high‐quality measure-ments. This work was funded by APIS‐GENE and used production data obtained in the Deffilait project cofounded by APIS‐GENE and the Agence Nationale de la Recherche (ANR‐15‐CE20‐0014).
CONFLICT OF INTEREST
The authors declare that there is no conflict of interest.
DATA AVAILABILITY STATEMENT
The data that support the findings of this study are available from APIS‐GENE. Restrictions apply to the availability of these data, which were used under license for this study. Data TABLE 3 Estimated heritability (h2) and microbiability (m2) of methane production (CH
4) and methane yield (CH4y) of lactating Holstein
cows
Trait
Whole OTU table (1,198) 86 selected OTUs (Bray–Curtis distance) 86 selected OTUs (log‐transformed and standardized OTU table)a h2 (SD) m2 (SD) h2 (SD) m2 (SD) h2 (SD) m2 (SD)
CH4 0.144 (0.09) 0.164 (0.10) 0.141 (0.09) 0.192 (0.11) 0.157 (0.09) 0.130 (0.06)
CH4y 0.148 (0.10) 0.181 (0.11) 0.143 (0.09) 0.242 (0.14) 0.163 (0.09) 0.174 (0.08)
aMethod proposed by Ross et al., 2013. Estimated a microbial relationship matrix based on the variance–covariance matrix from the log‐transformed and standardized
are available from the corresponding author with the permis-sion of APIS‐GENE.
ORCID
Yuliaxis Ramayo‐Caldas https://orcid. org/0000-0002-8142-0159
Núria Mach https://orcid.org/0000-0002-8001-6314
Miguel Perez‐Enciso https://orcid. org/0000-0003-3524-995X
REFERENCES
Arumugam, M., Raes, J., Pelletier, E., Le Paslier, D., Yamada, T., Mende, D. R., … Bork, P. (2011). Enterotypes of the human gut microbiome. Nature, 473, 174. https ://doi.org/10.1038/natur e09944 Auffret, M. D., Stewart, R., Dewhurst, R. J., Duthie, C.‐A., Rooke, J.
A., Wallace, R. J., … Roehe, R. (2018). Identification, comparison, and validation of robust rumen microbial biomarkers for methane emissions using diverse bos taurus breeds and basal diets. Frontiers in Microbiology, 8, 2642.
Barchia, I. M., Arthur, P. F., Weber, C., Herd, R. M., Donoghue, K. A., Bird‐Gardiner, T., & Hegarty, R. S. (2017). Optimizing test proce-dures for estimating daily methane and carbon dioxide emissions in cattle using short‐term breath measures. Journal of Animal Science, 95(2), 645–656.
Caliński, T., & Harabasz, J. (1974). A dendrite method for cluster anal-ysis. Communications in Statistics, 3(1), 1–27.
Cervino, A. C. L., Pichaud, M., Plaza Oñate, F., Le Chatelier, E., Gauthier, F., Almeida, M., … Magoulès, F. (2019). MSPminer: abundance‐based reconstitution of microbial pan‐genomes from shotgun metagenomic data. Bioinformatics, 35(9), 1544–1552. https ://doi.org/10.1093/bioin forma tics/bty830
Cole, N. A. (1991). Effects of animal‐to‐animal exchange of ruminal contents on the feed intake and ruminal characteristics of fed and fasted lambs. Journal of Animal Science, 69(4), 1795–1803. https :// doi.org/10.2527/1991.6941795x
Costea, P. I., Hildebrand, F., Arumugam, M., Bäckhed, F., Blaser, M. J., Bushman, F. D., … Bork, P. (2018). Enterotypes in the landscape of gut microbial community composition. Nature Microbiology, 3(1), 8–16. https ://doi.org/10.1038/s41564-017-0072-8
Danielsson, R., Dicksved, J., Sun, L., Gonda, H., Müller, B., Schnürer, A., & Bertilsson, J. (2017). Methane production in dairy cows cor-relates with rumen methanogenic and bacterial community struc-ture. Frontiers in Microbiology, 8, 226. https ://doi.org/10.3389/ fmicb.2017.00226
Delgado, B., Bach, A., Guasch, I., González, C., Elcoso, G., Pryce, J. E., & Gonzalez‐Recio, O. (2019). Whole rumen metagenome sequenc-ing allows classifysequenc-ing and predictsequenc-ing feed efficiency and intake levels in cattle. Scientific Reports, 9(1), 11. https ://doi.org/10.1038/ s41598-018-36673-w
Difford, G. F., Plichta, D. R., Løvendahl, P., Lassen, J., Noel, S. J., Højberg, O., … Sahana, G. (2018). Host genetics and the rumen microbiome jointly associate with methane emissions in dairy cows. PLOS Genetics, 14(10), e1007580. https ://doi.org/10.1371/journ al.pgen.1007580
Flay, H. E., Kuhn‐Sherlock, B., Macdonald, K. A., Camara, M., Lopez‐Villalobos, N., Donaghy, D. J., & Roche, J. R. (2019). Hot topic: Selecting cattle for low residual feed intake did not affect daily methane production but increased methane yield. Journal of Dairy Science, 102(3), 2708–2713. https ://doi.org/10.3168/ jds.2018-15234
Gerber, P. J., Hristov, A. N., Henderson, B., Makkar, H., Oh, J., Lee, C., … Oosting, S. (2013). Technical options for the mitigation of direct methane and nitrous oxide emissions from livestock: A re-view. Animal, 7(s2), 220–234. https ://doi.org/10.1017/S1751 73111 3000876
Hennig, C. (2007). Cluster‐wise assessment of cluster stability. Computational Statistics & Data Analysis, 52(1), 258–271. https :// doi.org/10.1016/j.csda.2006.11.025
Huws, S. A., Creevey, C. J., Oyama, L. B., Mizrahi, I., Denman, S. E., Popova, M., … Morgavi, D. P. (2018). Addressing global ruminant agricultural challenges through understanding the rumen microbi-ome: Past, present, and future. Frontiers in Microbiology, 9, 2161. https ://doi.org/10.3389/fmicb.2018.02161
Jami, E., White, B. A., & Mizrahi, I. (2014). Potential role of the bo-vine rumen microbiome in modulating milk composition and feed efficiency. PLoS ONE, 9(1), e85423. https ://doi.org/10.1371/journ al.pone.0085423
Jari Oksanen, F., Blanchet, G., Friendly, M., Kindt, R., Legendre, P., McGlinn, D., … Wagner, H. (2018). vegan: Community ecology package. R package version 2.5‐3. Retrieved from https ://CRANR-proje ctorg/ packa ge=vegan
Jeraldo, P., Kalari, K., Chen, X., Bhavsar, J., Mangalam, A., White, B., … Chia, N. (2014). IM‐TORNADO: A tool for comparison of 16S reads from paired‐end libraries. PLoS ONE, 9(12), e114804. https :// doi.org/10.1371/journ al.pone.0114804
Jewell, K. A., McCormick, C. A., Odt, C. L., Weimer, P. J., & Suen, G. (2015). Ruminal Bacterial community composition in dairy cows is dynamic over the course of two lactations and correlates with feed efficiency. Applied and Environmental Microbiology, 81(14), 4697. https ://doi.org/10.1128/AEM.00720-15
Junhua, L., Zhong, H., Ramayo‐Caldas, Y., Terrapon, N., Lombard, V., Potocki‐Veronese, G., … Morgavi, D. P. (2019). A catalog of micro-bial genes from the bovine rumen unveils a specialized and diverse biomass‐degrading environment. bioRxiv:272690.
Kamke, J., Kittelmann, S., Soni, P., Li, Y., Tavendale, M., Ganesh, S., … Attwood, G. T. (2016). Rumen metagenome and metatranscriptome analyses of low methane yield sheep reveals a Sharpea‐enriched microbiome characterised by lactic acid formation and utilisation. Microbiome, 4(1), 56. https ://doi.org/10.1186/s40168-016-0201-2 Kittelmann, S., Pinares‐Patiño, C. S., Seedorf, H., Kirk, M. R., Ganesh,
S., McEwan, J. C., & Janssen, P. H. (2014). Two different bacterial community types are linked with the low‐methane emission trait in sheep. PLoS ONE, 9(7), e103171. https ://doi.org/10.1371/journ al.pone.0103171
Knights, D., Ward, T. L., McKinlay, C. E., Miller, H., Gonzalez, A., McDonald, D., & Knight, R. (2014). Rethinking "enterotypes". Cell Host & Microbe, 16(4), 433–437. https ://doi.org/10.1016/j. chom.2014.09.013
Langmead, B., & Salzberg, S. L. (2012). Fast gapped‐read alignment with Bowtie 2. Nature Methods, 9, 357. https ://doi.org/10.1038/ nmeth.1923
Lê Cao, K.‐A., González, I., & Déjean, S. (2009). integrOmics: An R package to unravel relationships between two omics datasets.
Bioinformatics, 25(21), 2855–2856. https ://doi.org/10.1093/bioin forma tics/btp515
Leahy, S. C., Kelly, W. J., Ronimus, R. S., Wedlock, N., Altermann, E., & Attwood, G. T. (2013). Genome sequencing of rumen bacteria and archaea and its application to methane mitigation strategies. Animal, 7(s2), 235–243. https ://doi.org/10.1017/S1751 73111 3000700 Li, F., Li, C., Chen, Y., Liu, J., Zhang, C., Irving, B., … Guan, L. L.
(2019). Host genetics influence the rumen microbiota and heritable rumen microbial features associate with feed efficiency in cattle. Microbiome, 7(1), 92. https ://doi.org/10.1186/s40168-019-0699-1 Manafiazar, G., Zimmerman, S., & Basarab, J. A. (2016). Repeatability
and variability of short‐term spot measurement of methane and car-bon dioxide emissions from beef cattle using GreenFeed emissions monitoring system. Canadian Journal of Animal Science, 97(1), 118–126. https ://doi.org/10.1139/CJAS-2015-0190
Martin, C., Morgavi, D. P., & Doreau, M. (2009). Methane mitigation in ruminants: From microbe to the farm scale. Animal, 4(3), 351–365. https ://doi.org/10.1017/S1751 73110 9990620
McAllister, T. A., Cheng, K. J., Okine, E. K., & Mathison, G. W. (1996). Dietary, environmental and microbiological aspects of methane pro-duction in ruminants. Canadian Journal of Animal Science, 76(2), 231–243. https ://doi.org/10.4141/cjas96-035
McCabe, M. S., Cormican, P., Keogh, K., O’Connor, A., O’Hara, E., Palladino, R. A., … Waters, S. M. (2015). Illumina MiSeq phylo-genetic amplicon sequencing shows a large reduction of an unchar-acterised succinivibrionaceae and an increase of the methanobrevi-bacter gottschalkii clade in feed restricted cattle. PLoS ONE, 10(7), e0133234. https ://doi.org/10.1371/journ al.pone.0133234
Myer, P. R., Smith, T. P. L., Wells, J. E., Kuehn, L. A., & Freetly, H. C. (2015). Rumen microbiome from steers differing in feed effi-ciency. PLoS ONE, 10(6), e0129174. https ://doi.org/10.1371/journ al.pone.0129174
O'Herrin, S. M., & Kenealy, W. R. (1993). Glucose and carbon diox-ide metabolism by Succinivibrio dextrinosolvens. Applied and Environmental Microbiology, 59(3), 748–755.
Paulson, J. N., Stine, O. C., Bravo, H. C., & Pop, M. (2013). Differential abundance analysis for microbial marker‐gene surveys. Nature Methods, 10, 1200. https ://doi.org/10.1038/nmeth.2658
Pérez, P., & de los Campos, G. (2014). Genome‐wide regression and prediction with the BGLR statistical package. Genetics, 198(2), 483–495. https ://doi.org/10.1534/genet ics.114.164442
Pope, P. B., Smith, W., Denman, S. E., Tringe, S. G., Barry, K., Hugenholtz, P., … Morrison, M. (2011). Isolation of Succinivibrionaceae impli-cated in low methane emissions from tammar wallabies. Science, 333(6042), 646. https ://doi.org/10.1126/scien ce.1205760
Quast, C., Pruesse, E., Yilmaz, P., Gerken, J., Schweer, T., Yarza, P., … Glöckner, F. O. (2012). The SILVA ribosomal RNA gene database project: Improved data processing and web‐based tools. Nucleic Acids Research, 41(D1), D590–D596. https ://doi.org/10.1093/nar/ gks1219
Ricci, P., Rooke, J. A., Nevison, I., & Waterhouse, A. (2013). Methane emissions from beef and dairy cattle: Quantifying the effect of phys-iological stage and diet characteristics. Journal of Animal Science, 91(11), 5379–5389. https ://doi.org/10.2527/jas.2013-6544 Rohart, F., Gautier, B., Singh, A., & Lê Cao, K.‐A. (2017). mixOmics:
An R package for ‘omics feature selection and multiple data integra-tion. PLOS Computational Biology, 13(11), e1005752. https ://doi. org/10.1371/journ al.pcbi.1005752
Ross, E. M., Moate, P. J., Marett, L. C., Cocks, B. G., & Hayes, B. J. (2013). Metagenomic predictions: From microbiome to complex health and environmental phenotypes in humans and cattle. PLoS ONE, 8(9), e73056. https ://doi.org/10.1371/journ al.pone.0073056
Rousseeuw, P. J. (1987). Silhouettes: A graphical aid to the in-terpretation and validation of cluster analysis. Journal of Computational and Applied Mathematics, 20, 53–65. https ://doi. org/10.1016/0377-0427(87)90125-7
Saborío‐Montero, A. (2018). Variance components estimation of com-plex traits including microbiota information. Master of Science. Universidad Politecnica de Valencia.
Santos, E. dO., & Thompson, F. (2014). Other major lineages of bac-teria and the archaea. In E. F. D. Eugene Rosenberg, S. Lory, E. Stackebrandt & F. Thompson (Eds.), The prokaryotes (pp. 363– 383). Berlin, Heidelberg, Germany: Springer, Berlin Heidelberg. Scheller, S., Goenrich, M., Thauer, R. K., & Jaun, B. (2013). Methyl‐
coenzyme M reductase from methanogenic archaea: Isotope effects on the formation and anaerobic oxidation of methane. Journal of the American Chemical Society, 135(40), 14975–14984. https ://doi. org/10.1021/ja406 485z
Schloss, P. D., Westcott, S. L., Ryabin, T., Hall, J. R., Hartmann, M., Hollister, E. B., … Weber, C. F. (2009). Introducing mothur: Open‐ Source, platform‐independent, community‐supported software for describing and comparing microbial communities. Applied and Environmental Microbiology, 75(23), 7537. https ://doi.org/10.1128/ AEM.01541-09
Schubert, M., Lindgreen, S., & Orlando, L. (2016). AdapterRemoval v2: Rapid adapter trimming, identification, and read merg-ing. BMC Research Notes, 9, 88–88. https ://doi.org/10.1186/ s13104-016-1900-2
Seedorf, H., Kittelmann, S., Henderson, G., & Janssen, P. H. (2014). RIM‐DB: A taxonomic framework for community structure anal-ysis of methanogenic archaea from the rumen and other intesti-nal environments. PeerJ, 2, e494–e494. https ://doi.org/10.7717/ peerj.494
Shannon, C. (1984). A mathematical theory of communication. Tapio, I., Snelling, T. J., Strozzi, F., & Wallace, R. J. (2017). The
rumi-nal microbiome associated with methane emissions from ruminant livestock. Journal of Animal Science and Biotechnology, 8, 7–7. https ://doi.org/10.1186/s40104-017-0141-0
Wallace, R. J., Rooke, J. A., McKain, N., Duthie, C.‐A., Hyslop, J. J., Ross, D. W., … Roehe, R. (2015). The rumen microbial metagenome associated with high methane production in cattle. BMC Genomics, 16(1), 839. https ://doi.org/10.1186/s12864-015-2032-0
Wallace, R. J., Sasson, G., Garnsworthy, P. C., Tapio, I., Gregson, E., Bani, P., … Mizrahi, I. (2019). A heritable subset of the core rumen microbiome dictates dairy cow productivity and emissions. Science Advances, 5(7), eaav8391. https ://doi.org/10.1126/sciadv.aav8391 Weimer, P. J. (2015). Redundancy, resilience, and host specificity of the
ruminal microbiota: Implications for engineering improved ruminal fermentations. Frontiers in Microbiology, 6, 296.
Whittaker, R. H. (1972). Evolution and measurement of species diver-sity. Taxon, 21(2/3), 213–251. https ://doi.org/10.2307/1218190 Wongnate, T., Sliwa, D., Ginovska, B., Smith, D., Wolf, M. W., Lehnert,
N., … Ragsdale, S. W. (2016). The radical mechanism of biologi-cal methane synthesis by methyl‐coenzyme M reductase. Science, 352(6288), 953. https ://doi.org/10.1126/scien ce.aaf0616
Yu, Z., & Morrison, M. (2004). Improved extraction of PCR‐quality community DNA from digesta and fecal samples. BioTechniques, 36(5), 808–812. https ://doi.org/10.2144/04365 ST04
SUPPORTING INFORMATION
Additional supporting information may be found online in the Supporting Information section at the end of the article.
How to cite this article: Ramayo‐Caldas Y,
Zingaretti L, Popova M, et al. Identification of rumen microbial biomarkers linked to methane emission in Holstein dairy cows. J Anim Breed Genet. 2019;00:1– 11. https ://doi.org/10.1111/jbg.12427