HAL Id: hal-00605450
https://hal.archives-ouvertes.fr/hal-00605450
Submitted on 1 Jul 2011
HAL is a multi-disciplinary open access
archive for the deposit and dissemination of
sci-entific research documents, whether they are
pub-lished or not. The documents may come from
teaching and research institutions in France or
abroad, or from public or private research centers.
L’archive ouverte pluridisciplinaire HAL, est
destinée au dépôt et à la diffusion de documents
scientifiques de niveau recherche, publiés ou non,
émanant des établissements d’enseignement et de
recherche français ou étrangers, des laboratoires
publics ou privés.
Ongoing EEG Phase as a Trial-by-Trial Predictor of
Perceptual and Attentional Variability.
Rufin Vanrullen, Niko A Busch, Jan Drewes, Julien Dubois
To cite this version:
Rufin Vanrullen, Niko A Busch, Jan Drewes, Julien Dubois. Ongoing EEG Phase as a Trial-by-Trial
Predictor of Perceptual and Attentional Variability.. Frontiers in Psychology, Frontiers, 2011, 2, pp.60.
�10.3389/fpsyg.2011.00060�. �hal-00605450�
flow of electrically charged ions in and out of the cell bodies. Altogether, these processes induce large variations in local and long-distance electrical voltages at different temporal scales that can be considered as signatures of neuronal communication. These signatures are picked up by experimenters, for example using depth electrodes recording the extra-cellular potential and the local field potential (LFP), or using surface electrodes recording the electro-encephalogram (EEG).
The net effect of spikes and synaptic transmission at the level of neuronal populations often takes the form of an oscilla-tion of the electric potential, in which the extra-cellular voltage increases and decreases at regular intervals. The responsiveness of single neurons to the same input intensity (i.e., the same number of spikes received) can vary greatly depending on the neurons’ present state (i.e., their membrane potential) as well as on whether the extra-cellular voltage oscillation is in its lower or higher stage. This influence of spontaneous oscillatory phase on neuronal processing has long been recognized in vitro (Calvin and Stevens, 1967; Levitan et al., 1968; Stern et al., 1997) but it is only recently that the potential effects of oscillatory phase on sen-sory processing have started to be investigated in vivo. For exam-ple, Fries et al. (2001) reported that the phase of pre- stimulus gamma (40–70 Hz) oscillations in cat visual cortex determined the latency of subsequent neuronal firing. Montemurro et al. (2008) found that the precise phase of an ongoing delta (1–4 Hz) oscillation at which neurons in primary visual cortex fired car-ried information about the visual stimulus that could not be extracted based on firing rate alone. In fact, the firing phase within each gamma oscillatory cycle is a reliable indicator of neuronal activation (Vinck et al., 2010a). These results support previously published theories proposing that the phase of spike
IntroductIon
Run a computer program twice with the same inputs: chances are, you should get the same output twice. As any experimenter knows, it is not so with the human brain. This unreliable device persistently fails to provide a consistent outcome: reaction times (RTs) vary by a factor of two or more, perception sometimes gets distorted and sometimes does not occur at all – even though the external world has been carefully controlled and equated, trial after trial. This variability gets in the way of any serious scientific measurement, and therefore scientists have dubbed it “noise” and found ways to discount it, generally by considering the mean response over several hundreds of trials as the true standard of brain function. Oftentimes, however, one comes across a signal in the brain that tells a lot about the subject’s perception on a given trial, or that can explain hitherto unexplained differences between individual trials. Such signals are the focus of the Special Topic to which this article belongs. More specifically, in this review we will consider situations in which the phase of ongoing brain oscillations (i.e., whether the oscillation is currently at its peak, its trough, or any particular point in between), even before any stimulus is actually presented to the subject, can inform us about their subsequent perception. Beyond the obvious implication that the brain has little to do with modern computers, these recent findings reveal much about its processing strategies.
oscIllatory phase Influences neural responses
Neurons in the brain communicate by sending electrical pulses or “spikes,” which create electric potential differences at synapses and cell bodies. In turn, these voltage differences are responsible for the opening and closing of membrane channels and the subsequent
Ongoing EEG phase as a trial-by-trial predictor of perceptual
and attentional variability
R. VanRullen1,2*, N. A. Busch3,4, J. Drewes1,2 and Julien Dubois1,2,5
1 Université de Toulouse, Centre de Recherche Cerveau et Cognition, Université Paul Sabatier, Toulouse, France 2 Centre National de la Recherche Scientifique, UMR 5549, Faculté de Médecine de Rangueil, Toulouse, France 3 Institute of Medical Psychology, Charité–Universitätsmedizin Berlin, Berlin, Germany
4 Berlin School of Mind and Brain, Humboldt Universität, Berlin, Germany 5 Division of Biology, California Institute of Technology, Pasadena, CA, USA
Even in well-controlled laboratory environments, apparently identical repetitions of an experimental trial can give rise to highly variable perceptual outcomes and behavioral responses. This variability is generally discarded as a reflection of intrinsic noise in neuronal systems. However, part of this variability may be accounted for by trial-by-trial fluctuations of the phase of ongoing oscillations at the moment of stimulus presentation. For example, the phase of an electro-encephalogram (EEG) oscillation reflecting the rapid waxing and waning of sustained attention can predict the perception of a subsequent visual stimulus at threshold. Similar ongoing periodicities account for a portion of the trial-by-trial variability of visual reaction times. We review the available experimental evidence linking ongoing EEG phase to perceptual and attentional variability, and the corresponding methodology. We propose future tests of this relation, and discuss the theoretical implications for understanding the neuronal dynamics of sensory perception.
Keywords: EEG, oscillation, phase, pre-stimulus, spontaneous, ongoing, perception, attention
Edited by:
Guillaume A. Rousselet, University of Glasgow, UK
Reviewed by:
Peter Lakatos, Hungarian Academy of Sciences, Hungary
Gregor Thut, University of Glasgow, UK
*Correspondence:
R. VanRullen, Université de Toulouse, Centre de Recherche Cerveau et Cognition, Université Paul Sabatier, 31062 Toulouse, France.
firing relative to an ongoing oscillatory signal could constitute a meaningful neural coding scheme (VanRullen et al., 2005a; Fries et al., 2007).
The same relation that exists between oscillatory phase at the moment a neuron receives its inputs, and this neuron’s responsive-ness to those inputs, can also be observed over larger-scale neuro-nal populations comprising entire brain areas. Indeed, past studies have also reported an influence of pre-stimulus EEG phase on the magnitude of various subsequent event-related potential (ERP) components – which represent a sensory system’s response to its visual or auditory inputs (Jansen and Brandt, 1991; Brandt, 1997; Kruglikov and Schiff, 2003). Because neuronal firing ultimately gen-erates subjective perception, and because ERPs are often regarded as external markers of this perception, the literature reviewed so far seems to point, albeit indirectly, to a possible relation between ongoing oscillatory phase and sensory perception. The direct meas-urement of this relation will be the topic of this review.
Our focusing on oscillatory phase does not imply, of course, that the amplitude of ongoing oscillations has no impact on perception. For one thing, the phase of an oscillatory signal can only be reli-ably computed when this signal has significant power. This is not only true in a mathematical sense, but also at the biophysical level: if membrane potential fluctuations were not synchronous over a reasonably large population of neurons, any influence of phase existing for individual neurons would average out at the popula-tion level. Furthermore, it is well accepted now that oscillatory power in various frequency bands bears significant relations to sensory perception and attention (Klimesch, 1999; Tallon-Baudry and Bertrand, 1999; Engel and Singer, 2001; Varela et al., 2001; Ergenoglu et al., 2004; Hanslmayr et al., 2005, 2007; Thut et al., 2006; van Dijk et al., 2008). Our motivation for concentrating on ongoing oscillatory phase is, simply, that this variable has been largely overlooked, at least until recent years. Similarly, we will restrict this review to cases of truly spontaneous oscillatory activity, even though numerous recent studies in human and non-human primates have reported an entrainment of the phase of brain oscil-lations to rhythmic stimulus presentation sequences, accompanied by periodic modulations of perception, attention, and RTs (Large and Jones, 1999; Lakatos et al., 2008; Schroeder and Lakatos, 2009; Mathewson et al., 2010).
Measuring the influence of ongoing oscillatory phase on per-ception cannot be performed using conventional methods, but requires single-trial analyses, which – one way or another– relate the variability of spontaneous brain signals to the changes in response variables across trials – rather than discarding this variability by averaging across trials or computing correlations across subjects. Before surveying the recent experimental advances in this area, we shall detail a few of the data analysis methods that have been used to uncover this relation.
Methods for lInkIng ongoIng eeg phase to trIal-by-trIal varIabIlIty
Our general problem can be defined in the following terms (see Figure 1). On each trial, an experimenter records both a tempo-ral signal (e.g., an EEG waveform) and a behaviotempo-ral response that can be graded (e.g., RT, perceived intensity on a continuous scale) or have only a few discrete labels (e.g., stimulus perceived vs. not
perceived, two- or multiple-alternative discrimination forced-choice; see Figure 1A). In certain situations, the graded behavioral response can be turned into a discrete variable by binning neighbor-ing values (for example, labelneighbor-ing each RT with the correspondneighbor-ing quintile value, from 1 to 5). For our purposes, the temporal signal will correspond to brain activity prior to the presentation of the stimulus that must be perceived or classified by the observer (of course, similar methods can also be used for analysis of stimulus-evoked brain activity, but these will not be discussed here). In addi-tion, we will assume that the experimental paradigm is designed using randomized inter-trial intervals, such that the moment of stimulus onset is unpredictable, and therefore the distribution of oscillatory phase values at or before stimulus onset is uniform across all trials. In technical terms, our main question is whether this phase distribution will significantly depart from uniformity, once the behavioral outcome is taken into account.
In practice, for a discrete behavioral variable, trials are grouped according to the behavioral response, and the uniformity of the distribution of phases is evaluated for each trial group. This last step can be done explicitly, by averaging across trials in the complex domain – with phase being represented by the angle of the complex vector (see Figure 1C); this was the approach used to compute results in Figures 2A,C. It can also be performed implicitly, in the temporal domain (see Figure 1B); for example, Fries et al. (2001) compared pre-stimulus LFP averages for groups of trials separated by short vs. long firing latencies; similarly, Mathewson et al. (2009) compared band-passed pre-stimulus EEG averages for perceived vs. unperceived visual stimuli. Finally, for a continuous behavioral variable, specific methods exist (Berens, 2009) that estimate the cor-relation between the pre-stimulus EEG phase (a circular variable) and the behavioral response (generally given on a linear scale); this was the approach used for the analysis illustrated in Figure 2B. There are, of course, other alternatives to measure phase depend-ency, but the methods listed here already cover most of those used in the existing literature.
Obviously, each of the approaches listed above also needs to be accompanied by appropriate statistics. Simple parametric tests are sometimes sufficient: for example, time-domain signals can be directly compared between two groups of trials corresponding to two distinct behavioral outcomes, using a Student’s t-test – the null hypothesis being that the pre-stimulus means for the two condi-tions are equivalent at each point in time. Care must be taken, how-ever, to correct for the increased likelihood of false positives due to the number of multiple comparisons (in the above example, each time point yields a distinct, but not necessarily independent, statis-tical comparison). Such correction methods (Bonferroni’s, among others) are beyond the scope of this article. In addition, circular variables (e.g., phase angles expressed in the complex domain) are highly non-linear (for example, the mean of two angles of 10° and 350° does not correspond to the arithmetic mean of 180; instead, the circular mean of these two vectors is 0° – or 360°). Therefore, it is often preferable to devise non-parametric statisti-cal tests based on permutation or bootstrapping methods (Vinck et al., 2010a,b). For example, phase-locking values measured across trials grouped by behavioral outcome cannot be directly compared with a null hypothesis of zero phase locking, because the null hypothesis actually depends on the exact number of trials in each
ongoIng eeg phase predIcts perceptual varIabIlIty
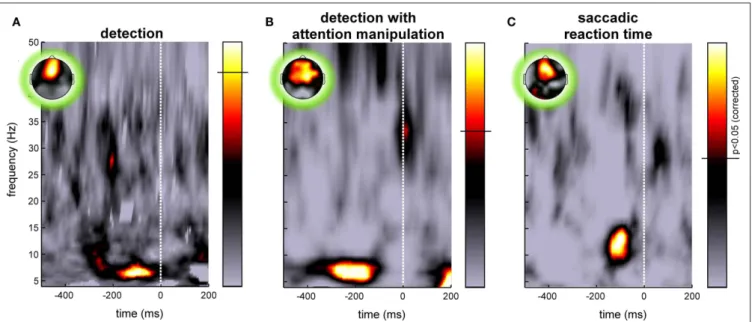
Recent studies by our group and others have started exploring the impact of the phase of ongoing pre-stimulus EEG oscillations on the subsequent perception of a visual stimulus. In a first study (Busch et al., 2009), we presented brief (6 ms) and dim peripheral flashes of light to our observers (n = 12), with the luminance of the flash adjusted individually so that the exact same stimulus would be per-ceived on approximately half of the trials, but go completely unno-ticed on the other half. We computed pre-stimulus phase-locking separately for the two trial groups corresponding to perceived and unperceived flashes, and found for each group a significant increase (compared to phase-locking computed on the same number of trials but drawn randomly, irrespective of perceptual outcome). This increase occurred just before stimulus onset, at a frequency of ∼7 Hz (Figure 2A), and the effect was maximal over fronto-central electrodes. In fact, by considering the phase of the 7-Hz band-pass group (even for a uniform phase distribution, the expected phase
locking in any finite group of trials is significantly above zero; see Figure 1C). A solution is to randomly reassign each trial to one of the behavior-defined groups, keeping the respective number of trials constant, and then re-calculate phase locking for this sur-rogate dataset; repeating this operation several times provides a distribution of phase-locking values under the null hypothesis, with which the real phase-locking value can be compared to esti-mate its statistical significance. The same approach can be applied to a situation with a continuous behavioral variable, by shuffling the assignment of behavioral values (e.g., RTs) to the correspond-ing EEG signals, each time re-calculatcorrespond-ing the circular test statistic under the null hypothesis (e.g., circular-to-linear correlation). In our experiments (Figure 2), we have favored such permutation methods because of their robustness and relative lack of assump-tions about the data structure.
FiGurE 1 | Methods for linking pre-stimulus EEG phase to trial-by-trial variations of a discrete behavioral response. (A) On each trial, a time-varying
signal (such as an EEG waveform) is recorded before stimulus onset. Here the signal is represented as oscillatory, but it could also correspond to a band-pass filtered version of a noisy, non-oscillatory signal. For each trial, the observer provides a behavioral response with discrete outcomes [here two possible outcomes (A,B)] corresponding, e.g., to distinct percepts (seen vs. unseen, category (A vs. B)], or to quantized reaction times (e.g., slow vs. fast), etc. On the right, the time-domain signal recorded on each trial is expressed as a vector in the complex plane (which can be calculated using Fourier or wavelet time–frequency decomposition methods). The direction of the vector and its length represent the phase and the amplitude (respectively) of the oscillatory signal recorded in a given time window of interest. (B) Since the moment of stimulus onset is unpredictable, the pre-stimulus mean over all trials is near-zero. However, if certain oscillatory phases systematically induce one or the other behavioral outcomes, then selectively averaging the signals for trials grouped according to the behavioral response should reveal oscillations with distinct phase angles. Here the
magnitude of the resulting oscillation appears constant at all pre-stimulus times but in practice, due to external and measurement noise, the phase difference is more likely to be visible just before stimulus onset. This method essentially corresponds to an ERP computed before, rather than after the stimulus onset. (C) Another method consists in selectively averaging the vectors for each trial group in the complex domain; prior to averaging, each vector is normalized to a unit length, implying that its phase will always equally contribute to the average, regardless of its amplitude [without this normalizing step, the method would actually give equivalent results to the one described in (B)]. This step is important because amplitude modulations that would occur independently of phase effects would tend to obscure them. The length of the resulting vector after averaging is called “phase-locking value” (PLV) or “inter-trial coherence” (ITC; Lachaux et al., 1999). The phase locking is weak when the distribution of phase angles across trials is uniform (as should occur when all trials are pooled together regardless of behavioral outcome); if certain phase angles systematically induce one specific behavioral outcome, on the other hand, this phase locking should be significantly increased by considering only the trials with this outcome.
illustrated in Figure 1A) which renders phase effects dependent on potential oscillatory amplitude differences between the perceptual conditions; such pre-stimulus amplitude differences between cor-rectly and incorcor-rectly perceived trials are known to exist, particu-larly over occipital regions at alpha-band frequencies around 10 Hz (Ergenoglu et al., 2004; Hanslmayr et al., 2005, 2007; Thut et al., 2006; van Dijk et al., 2008). This may also contribute to explain why the principal phase effect was observed by Mathewson et al. (2009) at 10 Hz on occipital electrodes, instead of 7 Hz on frontal electrodes in our study. Nonetheless, the fact that both studies point to a similar conclusion reinforces the general idea that pre-stimulus oscillatory phase at 7 and/or 10 Hz can determine to some extent the trial-by-trial changes in our conscious perception of a repetitive event.
ongoIng eeg phase reflects perIodIc attentIonal saMplIng
In our next study, we asked whether the influence of ongoing phase on perception was mediated by top-down attentional factors (Busch and VanRullen, 2010). The previous results had been obtained filtered EEG recorded at those electrodes just before stimulus onset
in each trial, we could predict the subsequent response of the subject well above chance. Up to 16% of the trial-by-trial differences in per-ception were accounted for by comparing trials having the optimal phase angle with those at the opposite angle (Busch et al., 2009).
These findings were globally consistent with the conclusions of an independent study by Mathewson et al. (2009), who also reported that the phase of low-frequency oscillations (around 10 Hz) just before stimulus onset predicted trial-by-trial perception, in a situ-ation where only half of the targets were consciously detected. However, important differences also exist between the two studies. The paradigm differed from ours, first, in that conscious visibility was regulated not by using dim stimuli, but by displaying a strong-contrast stimulus (a “mask”) shortly after the target. In addition, the inter-trial interval duration was fixed in that experiment; the possibility that certain oscillatory rhythms could have been reset by the stimulus onset in the previous trial thus makes it difficult to draw strong conclusions in terms of ongoing or spontaneous oscillations. Finally, the analysis method relied on time-domain averaging (as
FiGurE 2 | Examples of pre-stimulus EEG phase influences on behavioral response variability. Each image illustrates the significance of a relation
between the phase of ongoing EEG oscillations and a subsequent behavioral response recorded on the same trials, for various frequency bands (y-axis) and at different pre-stimulus times (x-axis). Time zero marks the (unpredictable) onset of the stimulus. The colorbar represents p-values, with the significance threshold marked by a horizontal line (p < 0.05, corrected for multiple comparisons across time and frequency points using the FDR procedure). The insets illustrate the topography of the effect at the optimal time–frequency point. (A) The response specified whether or not the observer had perceived a peripheral flash of light. The influence of phase was measured by comparing the phase-locking computed for two groups of trials corresponding to perceived and unperceived stimuli to surrogate phase-locking values obtained under the null hypothesis (random permutation of behavioral responses). At ∼7 Hz and 100–200 ms before the stimulus appears, the phase of frontal EEG on each trial was strongly predictive of the perceptual outcome (Busch et al., 2009). (B) In a separate experiment, observers again reported their perception of a flash of light, but the focus of spatial attention was manipulated with a cueing procedure. A significant relation between ongoing EEG phase and trial-by-trial perception was recorded
only when the target was flashed at the attended location. Here the image illustrates the significance of a circular-to-linear correlation between pre-stimulus phase (the circular variable) and post-stimulus global field power (GFP, a linear variable which we used as a marker of subjective perception; indeed, this GFP was virtually zero when the target was undetected). As in the previous case, the EEG phase at ∼7 Hz, recorded 100–400 ms prior to stimulus onset on frontal electrodes, was maximally predictive of target perception (Busch and VanRullen, 2010). (C) In another study, pre-stimulus phase was linked to the subsequent saccadic reaction time (here for a choice discrimination task between two shapes presented left and right of fixation). Reaction times for each subject were binned in five quintiles, and phase locking for each quintile was compared statistically with surrogate phase-locking values obtained under the null hypothesis (i.e., using the same number of trials but randomly drawn, regardless of reaction time). A strongly significant phase-locking increase was again observed on frontal electrodes around 100 ms pre-stimulus, but this time at a frequency of ∼13 Hz. Note that in this experiment, time zero corresponds to the beginning of the first stimulus-locked event, a “gap” or disappearance of the fixation point, the choice display itself being presented only after 200 ms (Drewes and VanRullen, 2011).
the difficulty of the choice varied. In the easiest case, subjects sim-ply made alternating left and right saccades toward a target whose position was fully predictable, trial after trial. In the second task the position was unpredictable, but since only one target appeared on each trial the task could be performed using mostly reflexive responses. Finally, the third task required a discrimination between two shapes displayed simultaneously; the saccade was made toward the shape that presented an opening at the top. In all three tasks, the fixation point disappeared 200 ms before the appearance of the sac-cade target display; this so-called “gap” procedure is normally used to maximize the occurrence of rapid “express” saccades (Fischer and Boch, 1983; Fischer and Ramsperger, 1984). The disappearance of the fixation point is itself a transient event that can modify or even reset ongoing oscillations; therefore, we considered the beginning of the gap as time zero, and concentrated only on spontaneous oscillations occurring before this time.
Behavioral results revealed that, as expected, the mean discrimi-nation performance decreased while the average RT increased with task difficulty. This time, we focused on RT variability across trials, and how this variability would relate to ongoing EEG phase dif-ferences. In order to apply the analysis methods described previ-ously (see Figure 1C), we binned the RTs of each observer into five groups, corresponding to the five quintiles of the RT distribution (this was done separately for each of the three tasks). For each trial group, we calculated the pre-stimulus phase locking (at each frequency and each pre-stimulus time point) and compared it to surrogate phase-locking values calculated using the same number of trials which were randomly drawn, irrespective of RT. Again, a significant increase in pre-stimulus phase locking was found over frontal electrodes for all five quintiles; this time, however, the effect was maximal at a frequency around 13 Hz. This phase effect was stronger in the easy and in the medium difficulty tasks; in fact, dur-ing the difficult task, the effect was only observed for subjects who provided very rapid (but often inaccurate) responses (Figure 2C). Thus the influence of pre-stimulus phase on RT variability seems to depend on cognitive load and subject strategy; for tasks involving a considerable cognitive effort, many other factors (discrimina-tion and decision processes, motiva(discrimina-tion) may come into play and contribute their own variability, which would act to conceal the effects of pre-stimulus phase.
The eventuality of a trial-by-trial relationship between pre- stimulus oscillatory phase and subsequent RTs had already been investigated in the past, but these early studies provided only mixed results (Walsh, 1952; Lansing, 1957; Callaway and Yeager, 1960; Dustman and Beck, 1965). One specificity of our experiment that could explain its comparative success, is that our analysis did not assume a one-to-one relationship between phases and RTs – contrary to previous studies that all searched for specific phase angles sys-tematically inducing the fastest, or the slowest RTs. As we found out, the relation between ongoing EEG rhythms and subsequent RTs can actually span more than a single oscillatory cycle. Each range of RT values will be associated with a specific and unique phase angle (as our analysis revealed), but the reverse is not true, that is, a given range of phases might be linked to two, or even more distinct RT values. This sort of relation would be missed by an analysis that would first group the trials by phase, and then compare the RTs in each group (a strategy employed in most of the studies cited above). under conditions in which target location was always known in
advance, and therefore subjects may have paid covert attention to that location in order to improve their detection performance. Would the same ongoing phase influence still occur for a target appearing at an unattended location?
Before each trial began, a central cue indicated to the observ-ers (n = 13) the location on the screen where they should expect the target (left or right). When the flash of light did occur on this side, everything happened in fact exactly as in the previous experiment – and indeed we confirmed our previous results in this condition, with a strong impact of ∼7 Hz pre-stimulus EEG phase recorded at fronto-central electrodes on the probability of target perception (Figure 2B). However, the target also sometimes occurred on the opposite side of the screen. In this case the sub-jects had more difficulty in perceiving the light (as indicated by the higher light intensity that proved necessary to achieve a 50% detection rate in this condition); this confirms that the observers were focusing on the cued side at the detriment of the rest of the screen. Critically, for those trials where the target appeared out-side the focus of attention, no significant phase-locking effect was recorded for the perceived or unperceived trials. In other words, perception was related to ongoing EEG phase only via the action of attention. We thus hypothesized that attention samples visual information periodically, and that each ∼7 Hz ongoing EEG cycle is the reflection of a new attentional sample (Busch and VanRullen, 2010). Stimuli occurring at around the optimal phase enjoy all the benefits of attention, while others are processed merely as if they were out of the attention focus. For some reason, likely related to its architecture and its neuronal substrates, the attention system could not apply the optimal strategy (optimal for such a detection task with unpredictable target onset) of steadily monitoring the expected location. These findings concur with conclusions from a previous psychophysical study in which we reported that attention samples information periodically at ∼7 Hz, even when only a single item needs to be attended (VanRullen et al., 2007). In this context, the topographic localization of the phase effects over fronto-cen-tral electrodes may reveal the contribution of the frontal eye field (FEF), an area known, among other things, for its involvement in visual attention (Crowne, 1983; Kodaka et al., 1997; Corbetta and Shulman, 1998; Schall, 2004; Wardak et al., 2006). However, our EEG data would require independent corroboration using more accurate anatomical localization methods, before the implication of FEF can be definitely established.
ongoIng eeg phase predIcts reactIon tIMe varIabIlIty
Attention and saccade programming are heavily intertwined brain functions (Rizzolatti et al., 1987; Deubel and Schneider, 1996; Smith et al., 2004). In particular, the FEF is involved in both visual atten-tion orienting and saccadic motor outputs (Moore and Fallah, 2001; Murthy et al., 2001; Juan et al., 2004; Schall, 2004; Wardak et al., 2006). Our next experiment thus tested whether saccadic responses would also be affected by ongoing pre-stimulus phase (Drewes and VanRullen, 2011).
We used three different versions of a saccadic response task, per-formed by the same 13 observers. All three tasks required speeded choice responses using leftward or rightward eye movements, but
• Does ongoing EEG phase predict threshold perception in other
sensory modalities (e.g., audition)? It is easy to adjust auditory,
or even somato-sensory stimuli so that they are consciously registered only half of the time. Would a pre-stimulus phase difference be observed between perceived and unperceived sti-muli? If yes, are the same or different mechanisms involved as in the visual modality, in terms of oscillation frequency, and cortical origin? The results of this experiment may indicate whether the source of the periodic modulation is central, or more sensory-specific. Existing evidence in animals already hints at a supramodal coordination of theta-band oscillatory activities (Lakatos et al., 2009).
• Does ongoing EEG phase predict the latency of attentional shifts? Just like saccadic RTs are variable when you move your eyes, it also takes variable amounts of time to shift your attention covertly from one location to another. This variability can be measured using specific paradigms, e.g., using a running analog “clock” at the target location and asking the observer to report the first “time” they can read on the clock after an attention orienting event. This time is generally delayed with respect to the onset of the orienting cue, and the delay is taken to reflect the latency of shifting attention to the target loca-tion (Carlson et al., 2006). Even for identical repetiloca-tions of an experimental trial, the latency is not fixed but varies by tens of milliseconds. Can the method employed to study the latency of saccadic responses (often taken to represent shifts of “overt” attention) also be used to reveal a relation between ongoing EEG phase and covert attentional shifts? In this case, would the relevant oscillation frequency be found at ∼7 Hz (like in our study of attentional sampling; Busch and VanRullen, 2010) or at ∼13 Hz (like in our study of saccadic latency; Drewes and VanRullen, 2011)? In any case, a positive outcome would lend credence to our proposal that ongoing ∼7 and/or ∼13 Hz oscil-lations mirror the rhythm at which attention samples visual information (VanRullen et al., 2005b, 2006, 2007; Busch and VanRullen, 2010).
• Does ongoing EEG phase predict the capacity and/or ordering of
items in visual short-term memory? Visual attention and visual
working memory share several traits, such as their limited capacity (Luck and Vogel, 1997; Cowan, 2001; Alvarez and Cavanagh, 2004), and it has even been proposed that the two cognitive functions overlap in part (LaBar et al., 1999; Awh et al., 2000, 2006; Downing, 2000; Awh and Jonides, 2001; de Fockert et al., 2001), although this conclusion is debated (Woodman et al., 2001, 2007). An influential model of wor-king memory organization posits that remembered items are maintained in memory as an ordered sequence (Sternberg, 1966), each element being represented by one cycle of a high-frequency oscillation (e.g., 30–80 Hz gamma activity) nested within a lower-frequency cycle (e.g., 4–8 Hz theta activity) supposed to encompass the entire list (Lisman and Idiart, 1995). The limited capacity of working memory (about four to seven items) is explained in this model by the number of high-frequency cycles that can be slotted in one period of the low-frequency oscillation. A recent study of neural responses in monkey prefrontal cortex reported that spikes fired at distinct phases of an ongoing ∼32 Hz oscillatory rhythm carried It would also be missed by directly calculating the circular-to-linear
correlation between phase angles and RTs. A proper analysis for such a situation is the one described in Figure 1, in which trials are first grouped according to RTs and phase values are then con-sidered in each group – in other words, the very analysis that we used (Figure 2C). The existence of a phase–RT relationship span-ning multiple oscillatory cycles suggests that the underlying ∼13 Hz ongoing oscillation creates multiple successive and regularly spaced “windows of opportunity” for saccade production.
What else does ongoIng eeg phase predIct?
The evidence reviewed so far unambiguously indicates that ongoing ∼7 and ∼13 Hz EEG oscillations dynamically modulate information processing in the visual system, and in particular the sampling of visual information by attention. Therefore, the single-trial phase recorded just before stimulus onset can be used as a predictor for subsequent behavioral and perceptual variables. Aside from con-scious visual detection and RTs, ongoing EEG phase could also contribute to the trial-by-trial variability of several other cogni-tive functions. Some of the possible associations are listed below, together with a preview of the significance that their discovery could have for our understanding of brain function. Needless to say, our group is currently exploring several of these issues.
• Does ongoing EEG phase predict transcranial magnetic
stimu-lation (TMS) phosphene perception at threshold? The
percep-tion of a flash of light is the result of a complex sequence of neuronal processing events, from the retina to the cortex via the thalamus. It is unclear (and heavily debated) which cortical region, or which network of cortical areas is critical for con-scious perception to occur. Within this context, our results of a rhythmic influence of ongoing oscillations onto the conscious detection of a flash are difficult to interpret. However, the con-scious experience of light can also be induced by direct stimu-lation of the occipital cortex (the seat of the visual system), for example using TMS pulses. Just as in our experiments, the intensity of the TMS pulse can be individually adjusted so that the perception of the induced “phosphene” only takes place in half of the trials, and it is possible to record EEG while applying TMS pulses (Thut et al., 2005; Taylor et al., 2008; Thut and Miniussi, 2009). Furthermore, focusing on pre-stimulation oscillations means that the study would be immune to the numerous artifacts generally evoked by the pulse in concur-rent TMS/EEG studies (Ilmoniemi and Kicic, 2010; Thut and Pascual-Leone, 2010). Would the perceptual outcome in this experiment also depend on ongoing 7 Hz frontal EEG phase? If these oscillations are the reflection of attentional sampling, and assuming that visual attention enhances phosphene per-ception (Bestmann et al., 2007), the answer is likely to be posi-tive. In addition, would the perceptual outcome on each trial also be affected by the phase of locally generated oscillations within occipital cortex itself – and if so, at what frequency? The fact that TMS-induced perception bypasses many of the early visual processing stages should maximize the chances of directly observing the local interplay between ongoing activity and visual responses, which so far has eluded our previous experimental efforts.
Trends Cogn. Sci. (Regul. Ed.) 5,
119–126.
Awh, E., Vogel, E. K., and Oh, S. H. (2006). Interactions between attention and working memory. Neuroscience 139, 201–208.
Berens, P. (2009). CircStat: a MATLAB Toolbox for circular statistics. J. Stat.
Softw. 31, 1–21.
Awh, E., Anllo-Vento, L., and Hillyard, S. A. (2000). The role of spatial selec-tive attention in working memory for locations: evidence from event-related potentials. J. Cogn. Neurosci. 12, 840–847.
Awh, E., and Jonides, J. (2001). Overlapping mechanisms of atten-tion and spatial working memory. Andrews, T., and Purves, D. (2005). The
wagon-wheel illusion in continuous light. Trends Cogn. Sci. (Regul. Ed.) 9, 261–263.
Andrews, T., Purves, D., Simpson, W. A., and VanRullen, R. (2005). The wheel keeps turning: reply to Holcombe et al. Trends Cogn. Sci. (Regul. Ed.) 9, 561.
references
Allport, D. A. (1968). Phenomenal simu-taneity and the perceptual moment hypothesis. Br. J. Psychol. 59, 395–406. Alvarez, G. A., and Cavanagh, P. (2004). The capacity of visual short-term memory is set both by visual infor-mation load and by number of objects.
Psychol. Sci. 15, 106–111.
do ongoIng oscIllatIons produce perceptual snapshots?
One critical test of the relation between ongoing rhythms and conscious perception has eluded the community for so long that it deserves a dedicated section in this review. In 1981, inspired by earlier theories claiming that our perceptual experience was built upon discrete processing events, similar to the discrete frames of a movie sequence (Pitts and McCulloch, 1947; Stroud, 1956; Harter, 1967; Allport, 1968), Varela et al. (1981) reported apparently direct evidence for such perceptual “frames” or “snapshots.” By presenting identical stimuli (two successive flashes separated by a short delay) at different phases of the ongoing alpha (10 Hz) EEG, they induced drastic changes in the observers’ experience of temporal simultane-ity: while at one alpha phase they judged the two flashes to have occurred at the same time, at the opposite phase they perceived the same two flashes as clearly separate events. The implication is that each alpha cycle slices the continuous temporal sequence of visual inputs into a new discrete chunk or snapshot – when the two flashes straddle the critical phase of the cycle, they are sliced into separate snapshots. Unfortunately, these promising first results did not prove as clear-cut in a follow-up study by the same author (Gho and Varela, 1988), and could simply not be replicated afterward, despite repeated efforts by our group and others (D. Eagleman, personal communication).
This failure is fateful: whereas the evidence reviewed so far of a relation between ongoing oscillatory phase and trial-by-trial variations in conscious detection, attention, or motor outputs implies the existence of periodic components in perception, it only indirectly alludes to the issue of discrete vs. continuous perception. A relation between ongoing phase and temporal framing, on the other hand, would directly, and unambigu-ously demonstrate the discrete nature of perception (VanRullen and Koch, 2003). Until such a demonstration is provided, the ongoing debate must continue to rely on indirect experimental signatures of the postulated discreteness, such as the motion reversals occurring in continuous light during the “wagon wheel illusion” (Purves et al., 1996; Kline et al., 2004; Andrews and Purves, 2005; Andrews et al., 2005; Holcombe et al., 2005; VanRullen et al., 2005b, 2006; Kline and Eagleman, 2008). In the end, even if it turns out that discrete temporal framing does not occur after all, or that it is restricted to specific sensory domains or experimental situations, the studies reviewed in this article should hopefully convince the reader that the outcome of many important brain functions depends in a periodic manner on the ongoing state of the brain, as reflected by the phase of certain pre-stimulus oscillations; and further, that it is possible to reveal this dependence using careful analysis of single-trial EEG activity.
information about distinct objects from a to-be-remembered list (Siegel et al., 2009). Although the study was presented as evidence for Lisman’s model, its findings depart significan-tly from Lisman’s predictions (indeed, the phase dependence should occur at the lower rhythm frequency, not at the higher one). Nonetheless, the findings clearly suggest that pre- stimulus oscillations could relate to short-term memory per-formance. Remaining questions include (i) whether the phase of ongoing lower-frequency oscillations (e.g., in the theta band) at which a test item is presented would predict the trial-by-trial variability in response time for deciding whether or not the item belongs to the remembered list – this prediction follows naturally from Lisman’s model since the phase encodes the item’s rank in the list and the rank determines the time needed for retrieval; (ii) whether inter-individual or inter-trial differences in peak oscillation frequency would correlate with capacity and performance measures; (iii) whether interfering with ongoing oscillations at specific phases (for example, using TMS applied on frontal areas) would disrupt working memory maintenance only for specific items within the list.
• Does ongoing EEG phase predict long-term memory encoding
and/or recall? Memory encoding over longer time scales
(minutes, days, or even more) depends both on frontal struc-tures and on the medial temporal lobe system, including the hippocampus (Poldrack and Gabrieli, 1997; Desgranges et al., 1998; Kramer et al., 2005; Ramus et al., 2007). This latter area displays very large amplitude oscillations in the theta band (4–8 Hz) which are known to underlie spatial memory for-mation in rodents (O’Keefe, 1993; Buzsaki, 2002, 2006). More precisely, the firing of certain hippocampal neurons signals a remembered location in the rat’s environment, and the spe-cific phase of the ongoing theta rhythm at which this firing occurs reflects the relative position of the rat with respect to this location – a mechanism coined “theta phase precession” (O’Keefe and Recce, 1993; Skaggs et al., 1996). In fact, theta phase precession also coordinates the firing of prefrontal neu-rons to the hippocampal theta rhythm (Jones and Wilson, 2005; Siapas et al., 2005). A recent study using single-neuron recordings in humans revealed that trials in which long-term memory formation was successful were characterized by stronger phase locking of hippocampal neurons to the ongoing theta rhythm, even before the onset of the stimulus to be recalled (Rutishauser et al., 2010). This neuronal result does not directly imply the existence of a relationship between the phase of ongoing theta oscillations at the moment of pre-sentation of a visual stimulus and the subsequent recall of this stimulus, but it makes such a relationship worth testing in future experiments.
reaction time. Electroencephalogr. Clin.
Neurophysiol. 9, 497–504.
Large, E. W., and Jones, M. R. (1999). The dynamics of attending: how people track time-varying events. Psychol.
Rev. 106, 119–159.
Levitan, H., Segundo, J. P., Moore, G. P., and Perkel, D. H. (1968). Statistical analysis of membrane potential fluc-tuations. Relation with presynaptic spike train. Biophys. J. 8, 1256–1274. Lisman, J. E., and Idiart, M. A. (1995).
Storage of 7±2 short-term memories in oscillatory subcycles. Science 267, 1512–1515.
Luck, S. J., and Vogel, E. K. (1997). The capacity of visual working memory for features and conjunctions. Nature 390, 279–281.
Mathewson, K. E., Fabiani, M., Gratton, G., Beck, D. M., and Lleras, A. (2010). Rescuing stimuli from invisibil-ity: inducing a momentary release from visual masking with pre-target entrainment. Cognition 115, 186–191. Mathewson, K. E., Gratton, G., Fabiani, M., Beck, D. M., and Ro, T. (2009). To see or not to see: prestimulus alpha phase predicts visual awareness. J.
Neurosci. 29, 2725–2732.
Montemurro, M. A., Rasch, M. J., Murayama, Y., Logothetis, N. K., and Panzeri, S. (2008). Phase-of-firing coding of natural visual stimuli in primary visual cortex. Curr. Biol. 18, 375–380.
Moore, T., and Fallah, M. (2001). Control of eye movements and spatial atten-tion. Proc. Natl. Acad. Sci. U.S.A. 98, 1273–1276.
Murthy, A., Thompson, K. G., and Schall, J. D. (2001). Dynamic dissociation of visual selection from saccade pro-gramming in frontal eye field. J.
Neurophysiol. 86, 2634–2637.
O’Keefe, J. (1993). Hippocampus, theta, and spatial memory. Curr. Opin.
Neurobiol. 3, 917–924.
O’Keefe, J., and Recce, M. L. (1993). Phase relationship between hippocampal place units and the EEG theta rhythm.
Hippocampus 3, 317–330.
Pitts, W., and McCulloch, W. S. (1947). How we know universals: the percep-tion of auditory and visual forms. Bull.
Math. Biophys. 9, 127–147.
Poldrack, R. A., and Gabrieli, J. D. (1997). Functional anatomy of long-term memory. J. Clin. Neurophysiol. 14, 294–310.
Purves, D., Paydarfar, J. A., and Andrews, T. J. (1996). The wagon wheel illusion in movies and reality. Proc. Natl. Acad.
Sci. U.S.A. 93, 3693–3697.
Ramus, S. J., Davis, J. B., Donahue, R. J., Discenza, C. B., and Waite, A. A. (2007). Interactions between the orbitofrontal cortex and the hippocampal memory evoked response. Electroencephalogr.
Clin. Neurophysiol. 80, 241–250.
Jones, M. W., and Wilson, M. A. (2005). Phase precession of medial prefrontal cortical activity relative to the hippoc-ampal theta rhythm. Hippocampus 15, 867–873.
Juan, C. H., Shorter-Jacobi, S. M., and Schall, J. D. (2004). Dissociation of spatial attention and saccade prepa-ration. Proc. Natl. Acad. Sci. U.S.A. 101, 15541–15544.
Klimesch, W. (1999). EEG alpha and theta oscillations reflect cognitive and memory performance: a review and analysis. Brain Res. Brain Res. Rev. 29, 169–195.
Kline, K., and Eagleman, D. M. (2008). Evidence against the temporal sub-sampling account of illusory motion reversal. J. Vis. 8, 13.1–13.5. Kline, K., Holcombe, A. O., and Eagleman,
D. M. (2004). Illusory motion reversal is caused by rivalry, not by perceptual snapshots of the visual field. Vision
Res. 44, 2653–2658.
Kodaka, Y., Mikami, A., and Kubota, K. (1997). Neuronal activity in the fron-tal eye field of the monkey is modu-lated while attention is focused on to a stimulus in the peripheral visual field, irrespective of eye movement.
Neurosci. Res. 28, 291–298.
Kramer, J. H., Rosen, H. J., Du, A. T., Schuff, N., Hollnagel, C., Weiner, M. W., Miller, B. L., and Delis, D. C. (2005). Dissociations in hippoc-ampal and frontal contributions to episodic memory performance.
Neuropsychology 19, 799–805.
Kruglikov, S. Y., and Schiff, S. J. (2003). Interplay of electroencephalogram phase and auditory-evoked neural activity. J. Neurosci. 23, 10122–10127. LaBar, K. S., Gitelman, D. R., Parrish, T. B., and Mesulam, M. (1999). Neuroanatomic overlap of working memory and spatial attention net-works: a functional MRI compari-son within subjects. Neuroimage 10, 695–704.
Lachaux, J. P., Rodriguez, E., Martinerie, J., and Varela, F. J. (1999). Measuring phase synchrony in brain signals.
Hum. Brain Mapp. 8, 194–208.
Lakatos, P., Karmos, G., Mehta, A. D., Ulbert, I., and Schroeder, C. E. (2008). Entrainment of neuronal oscillations as a mechanism of attentional selec-tion. Science 320, 110–113. Lakatos, P., O’Connell, M. N., Barczak, A.,
Mills, A., Javitt, D. C., and Schroeder, C. E. (2009). The leading sense: supramodal control of neurophysi-ological context by attention. Neuron 64, 419–430.
Lansing, R. W. (1957). Relation of brain and tremor rhythms to visual ongoing EEG oscillations modulates
saccadic reaction time. J. Neurosci. 31, 4698–4708.
Dustman, R. E., and Beck, E. C. (1965). Phase of alpha brain waves, reaction time and visually evoked potentials.
Electroencephalogr. Clin. Neurophysiol.
18, 433–440.
Engel, A. K., and Singer, W. (2001). Temporal binding and the neural correlates of sensory awareness. Trends
Cogn. Sci. (Regul. Ed.) 5, 16–25.
Ergenoglu, T., Demiralp, T., Bayraktaroglu, Z., Ergen, M., Beydagi, H., and Uresin, Y. (2004). Alpha rhythm of the EEG modulates visual detection perform-ance in humans. Brain Res. Cogn. Brain
Res. 20, 376–383.
Fischer, B., and Boch, R. (1983). Saccadic eye movements after extremely short reaction times in the monkey. Brain
Res. 260, 21–26.
Fischer, B., and Ramsperger, E. (1984). Human express saccades: extremely short reaction times of goal directed eye movements. Exp. Brain Res. 57, 191–195.
Fries, P., Neuenschwander, S., Engel, A. K., Goebel, R., and Singer, W. (2001). Rapid feature selective neuronal synchronization through correlated latency shifting. Nat. Neurosci. 4, 194–200.
Fries, P., Nikolic, D., and Singer, W. (2007). The gamma cycle. Trends Neurosci. 30, 309–316.
Gho, M., and Varela, F. J. (1988). A quan-titative assessment of the dependency of the visual temporal frame upon the cortical rhythm. J. Physiol. 83, 95–101. Hanslmayr, S., Aslan, A., Staudigl, T.,
Klimesch, W., Herrmann, C. S., and Bauml, K. H. (2007). Prestimulus oscillations predict visual perception performance between and within subjects. Neuroimage 37, 1465–1473. Hanslmayr, S., Klimesch, W., Sauseng,
P., Gruber, W., Doppelmayr, M., Freunberger, R., and Pecherstorfer, T. (2005). Visual discrimination per-formance is related to decreased alpha amplitude but increased phase lock-ing. Neurosci. Lett. 375, 64–68. Harter, M. R. (1967). Excitability cycles
and cortical scanning: a review of two hypotheses of central intermittency in perception. Psychol. Bull. 68, 47–58. Holcombe, A. O., Clifford, C. W.,
Eagleman, D. M., and Pakarian, P. (2005). Illusory motion reversal in tune with motion detectors. Trends
Cogn. Sci. (Regul. Ed.) 9, 559–560.
Ilmoniemi, R. J., and Kicic, D. (2010). Methodology for combined TMS and EEG. Brain Topogr. 22, 233–248. Jansen, B. H., and Brandt, M. E. (1991).
The effect of the phase of prestimulus alpha activity on the averaged visual Bestmann, S., Ruff, C. C., Blakemore,
C., Driver, J., and Thilo, K. V. (2007). Spatial attention changes excitabil-ity of human visual cortex to direct stimulation. Curr. Biol. 17, 134–139. Brandt, M. E. (1997). Visual and
audi-tory evoked phase resetting of the alpha EEG. Int. J. Psychophysiol. 26, 285–298.
Busch, N. A., Dubois, J., and VanRullen, R. (2009). The phase of ongoing EEG oscillations predicts visual perception.
J. Neurosci. 29, 7869–7876.
Busch, N. A., and VanRullen, R. (2010). Spontaneous EEG oscillations reveal periodic sampling of visual atten-tion. Proc. Natl. Acad. Sci. U.S.A. 107, 16048–16053.
Buzsaki, G. (2002). Theta oscillations in the hippocampus. Neuron 33, 325–340.
Buzsaki, G. (2006). Rhythms of the Brain. New York: Oxford University Press. Callaway, E. I., and Yeager, C. L. (1960).
Relationship between reaction time and electroencephalographic alpha phase. Science 132, 1765–1766. Calvin, W. H., and Stevens, C. F. (1967).
Synaptic noise as a source of variability in the interval between action poten-tials. Science 155, 842–844. Carlson, T. A., Hogendoorn, H., and
Verstraten, F. A. (2006). The speed of visual attention: what time is it? J. Vis. 6, 1406–1411.
Corbetta, M., and Shulman, G. L. (1998). Human cortical mechanisms of visual attention during orienting and search.
Philos. Trans. R. Soc. Lond. B Biol. Sci.
353, 1353–1362.
Cowan, N. (2001). The magical number 4 in short-term memory: a reconsidera-tion of mental storage capacity. Behav.
Brain Sci. 24, 87–114.
Crowne, D. P. (1983). The frontal eye field and attention. Psychol. Bull. 93, 232–260.
de Fockert, J. W., Rees, G., Frith, C. D., and Lavie, N. (2001). The role of working memory in visual selective attention.
Science 291, 1803–1806.
Desgranges, B., Baron, J. C., and Eustache, F. (1998). The functional neuroanat-omy of episodic memory: the role of the frontal lobes, the hippocampal for-mation, and other areas. Neuroimage 8, 198–213.
Deubel, H., and Schneider, W. X. (1996). Saccade target selection and object recognition: evidence for a common attentional mechanism. Vision Res. 36, 1827–1837.
Downing, P. E. (2000). Interactions between visual working memory and selective attention. Psychol. Sci. 11, 467–473.
Drewes, J., and VanRullen, R. (2011). This is the rhythm of your eyes: the phase of
gation of a scanning hypothesis. J.
Physiol. 118, 500–508.
Wardak, C., Ibos, G., Duhamel, J. R., and Olivier, E. (2006). Contribution of the monkey frontal eye field to cov-ert visual attention. J. Neurosci. 26, 4228–4235.
Woodman, G. F., Luck, S. J., and Schall, J. D. (2007). The role of working mem-ory representations in the control of attention. Cereb. Cortex 17(Suppl. 1), i118–i124.
Woodman, G. F., Vogel, E. K., and Luck, S. J. (2001). Visual search remains effi-cient when visual working memory is full. Psychol. Sci. 12, 219–224.
Conflict of Interest Statement: The
authors declare that the research was con-ducted in the absence of any commercial or financial relationships that could be construed as a potential conflict of interest.
Received: 12 January 2011; paper pending published: 26 January 2011; accepted: 24 March 2011; published online: 09 April 2011.
Citation: VanRullen R, Busch NA, Drewes J and Dubois J (2011) Ongoing EEG phase as a trial-by-trial predictor of perceptual and attentional variability. Front. Psychology 2:60. doi: 10.3389/fpsyg.2011.00060 This article was submitted to Frontiers in Perception Science, a specialty of Frontiers in Psychology.
Copyright © 2011 VanRullen, Busch, Drewes and Dubois. This is an open-access article subject to a non-exclusive license between the authors and Frontiers Media SA, which per-mits use, distribution and reproduction in other forums, provided the original authors and source are credited and other Frontiers conditions are complied with.
predicts visual discrimination ability.
J. Neurosci. 28, 1816–1823.
VanRullen, R., Carlson, T., and Cavanagh, P. (2007). The blinking spotlight of attention. Proc. Natl. Acad. Sci. U.S.A. 104, 19204–19209.
VanRullen, R., Guyonneau, R., and Thorpe, S. J. (2005a). Spike times make sense. Trends Neurosci. 28, 1–4. VanRullen, R., Reddy, L., and Koch, C.
(2005b). Attention-driven discrete sampling of motion perception. Proc.
Natl. Acad. Sci. U.S.A. 102, 5291–5296.
VanRullen, R., and Koch, C. (2003). Is per-ception discrete or continuous? Trends
Cogn. Sci. (Regul. Ed.) 7, 207–213.
VanRullen, R., Reddy, L., and Koch, C. (2006). The continuous wagon wheel illusion is associated with changes in electroencephalogram power at approx-imately 13 Hz. J. Neurosci. 26, 502–507. Varela, F., Lachaux, J. P., Rodriguez, E., and Martinerie, J. (2001). The brainweb: phase synchronization and large-scale integra-tion. Nat. Rev. Neurosci. 2, 229–239. Varela, F. J., Toro, A., John, E. R., and
Schwartz, E. L. (1981). Perceptual framing and cortical alpha rhythm.
Neuropsychologia 19, 675–686.
Vinck, M., Lima, B., Womelsdorf, T., Oostenveld, R., Singer, W., Neuenschwander, S., and Fries, P. (2010a). Gamma-phase shifting in awake monkey visual cortex. J.
Neurosci. 30, 1250–1257.
Vinck, M., van Wingerden, M., Womelsdorf, T., Fries, P., and Pennartz, C. M. (2010b). The pairwise phase consistency: a bias-free measure of rhythmic neuronal synchronization.
Neuroimage 51, 112–122.
Walsh, E. G. (1952). Visual reaction time and the alpha-rhythm, an investi-membrane potential fluctuations and
action potential variability of rat corti-costriatal and striatal neurons in vivo.
J. Neurophysiol. 77, 1697–1715.
Sternberg, S. (1966). High-speed scan-ning in human memory. Science 153, 652–654.
Stroud, J. M. (1956). “The fine structure of psychological time,” in Information
Theory in Psychology, ed. H. Quastler
(Chicago, IL: Free Press) 174–205. Tallon-Baudry, C., and Bertrand, O.
(1999). Oscillatory gamma activity in humans and its role in object rep-resentation. Trends Cogn. Sci. (Regul.
Ed.) 3, 151–162.
Taylor, P. C., Walsh, V., and Eimer, M. (2008). Combining TMS and EEG to study cognitive function and cortico-cortico interactions. Behav. Brain Res. 191, 141–147.
Thut, G., Ives, J. R., Kampmann, F., Pastor, M. A., and Pascual-Leone, A. (2005). A new device and protocol for com-bining TMS and online recordings of EEG and evoked potentials. J. Neurosci.
Methods 141, 207–217.
Thut, G., and Miniussi, C. (2009). New insights into rhythmic brain activity from TMS-EEG studies. Trends Cogn.
Sci. (Regul. Ed.) 13, 182–189.
Thut, G., Nietzel, A., Brandt, S. A., and Pascual-Leone, A. (2006). Alpha-band electroencephalographic activity over occipital cortex indexes visuospatial attention bias and predicts visual target detection. J. Neurosci. 26, 9494–9502. Thut, G., and Pascual-Leone, A. (2010).
Integrating TMS with EEG: how and what for? Brain Topogr. 22, 215–218. van Dijk, H., Schoffelen, J. M., Oostenveld,
R., and Jensen, O. (2008). Prestimulus oscillatory activity in the alpha band system during the storage of long-term
memory. Ann. N. Y. Acad. Sci. 1121, 216–231.
Rizzolatti, G., Riggio, L., Dascola, I., and Umilta, C. (1987). Reorienting attention across the horizontal and vertical meridians: evidence in favor of a premotor theory of attention.
Neuropsychologia 25, 31–40.
Rutishauser, U., Ross, I. B., Mamelak, A. N., and Schuman, E. M. (2010). Human memory strength is predicted by theta-frequency phase-locking of single neurons. Nature 464, 903–907. Schall, J. D. (2004). On the role of frontal
eye field in guiding attention and sac-cades. Vision Res. 44, 1453–1467. Schroeder, C. E., and Lakatos, P. (2009).
Low-frequency neuronal oscillations as instruments of sensory selection.
Trends Neurosci. 32, 9–18.
Siapas, A. G., Lubenov, E. V., and Wilson, M. A. (2005). Prefrontal phase lock-ing to hippocampal theta oscillations.
Neuron 46, 141–151.
Siegel, M., Warden, M. R., and Miller, E. K. (2009). Phase-dependent neuro-nal coding of objects in short-term memory. Proc. Natl. Acad. Sci. U.S.A. 106, 21341–21346.
Skaggs, W. E., McNaughton, B. L., Wilson, M. A., and Barnes, C. A. (1996). Theta phase precession in hippoc-ampal neuronal populations and the compression of temporal sequences.
Hippocampus 6, 149–172.
Smith, D. T., Rorden, C., and Jackson, S. R. (2004). Exogenous orienting of attention depends upon the ability to execute eye movements. Curr. Biol. 14, 792–795.
Stern, E. A., Kincaid, A. E., and Wilson, C. J. (1997). Spontaneous subthreshold