HAL Id: hal-02305623
https://hal.archives-ouvertes.fr/hal-02305623
Submitted on 4 Oct 2019HAL is a multi-disciplinary open access archive for the deposit and dissemination of sci-entific research documents, whether they are pub-lished or not. The documents may come from teaching and research institutions in France or abroad, or from public or private research centers.
L’archive ouverte pluridisciplinaire HAL, est destinée au dépôt et à la diffusion de documents scientifiques de niveau recherche, publiés ou non, émanant des établissements d’enseignement et de recherche français ou étrangers, des laboratoires publics ou privés.
Pritam Das, Andries van der Meer, Aisen Vivas, Yusuf B. Arik,
Jean-Christophe Remigy, Jean-Francois Lahitte, Rob G.H. Lammertink,
Patrice Bacchin
To cite this version:
Pritam Das, Andries van der Meer, Aisen Vivas, Yusuf B. Arik, Jean-Christophe Remigy, et al.. Tun-able microstructured membranes in organ-on-chip to monitor trans-endothelial hydraulic resistance. Tissue Engineering: Parts A, B, and C, Mary Ann Liebert, In press, �10.1089/ten.TEA.2019.0021�. �hal-02305623�
OATAO is an open access repository that collects the work of Toulouse
researchers and makes it freely available over the web where possible
Any correspondence concerning this service should be sent
to the repository administrator:
tech-oatao@listes-diff.inp-toulouse.fr
This is an author’s version published in:
http://oatao.univ-toulouse.fr/23664
To cite this version:
Das, Pritam
and van der Meer, Andries and Vivas, Aisen and Arik, Yusuf B.
and Remigy, Jean-Christophe
and Lahitte, Jean-François
and Lammertink,
Rob G.H. and Bacchin, Patrice
Tunable microstructured membranes in
organ‐on‐chip to monitor trans‐endothelial hydraulic resistance. (2019) Tissue
Engineering Part A. 1-41. ISSN 1937-3341
Tunable microstructured membranes in organ‐on‐chip to monitor
trans‐endothelial hydraulic resistance
Pritam Das PhDa,b,c,d, Andries D. van der Meer PhDb*, Aisen Vivas MScb,c, Yusuf B. Arik MScb,c, Jean‐Christophe Remigy PhDa, Jean‐François Lahitte PhDa, Rob G. H. Lammertink
PhDd* and Patrice Bacchin PhDa* a Laboratoire de Génie Chimique, Université de Toulouse, CNRS UMR 5503, INPT, UPS, Toulouse, France. b University of Twente, Applied Stem Cell Technologies, TechMed Centre, Faculty of Science and Technology, PO Box 217, 7500 AE, Enschede, The Netherlands cUniversity of Twente, BIOS Lab on a Chip group, TechMed Centre and MESA+ Institute for Nanotechnology, PO Box 217 7500 AE, Enschede, The Netherlands dSoft Matter, Fluidics and Interfaces, Faculty of Science and Technology, MESA+ Institute for Nanotechnology, University of Twente, Enschede, The Netherlands *Correspondence to. E‐mail address: andries.vandermeer@utwente.nl (Dr. Andries. D. van der Meer), r.g.h.lammertink@utwente.nl (Dr. Rob G. H. Lammertink), bacchin@chimie.ups‐tlse.fr (Dr. Patrice Bacchin) Other Authors’ Email addresses: Dr. Pritam Das, pritamdas005@gmail.com; Aisen Vivas, a.g.desavivas@utwente.nl; Yusuf Arik, y.b.arik@utwente.nl; Dr. Jean‐Christopher Remigy, remigy@chimie.ups‐tlse.fr; Dr. Jean‐François Lahitte lahitte@chimie.ups‐tlse.fr;
Abstract:
Tissue engineering is an interdisciplinary field, where scientists from different backgrounds collaborate to address the challenge of replacing damaged tissues and organs via the in vitro fabrication of functional and transplantable biological structures. Because the development and optimization of tissue engineering strategies relies on the complex interaction of cells, materials and the physical‐chemical tissue microenvironment, there is a need for experimental models that allow controlled studies of these aspects. Organs‐on‐ chips have recently emerged as in vitro models that capture the complexity of human tissues in a controlled manner, while including functional read‐outs related to human organ physiology. Organs‐on‐chips consist of multiple microfluidic cell culture compartments, which are interfaced by porous membranes or hydrogels in which human cells can be cultured, thereby providing a controlled culture environment that resembles the microenvironment of a certain organ including mechanical, biochemical and geometrical aspects. Because organs‐on‐chips provide both a well‐controlled microenvironment and functional read‐outs, they provide a unique opportunity to incorporate, evaluate and optimize materials for tissue engineering. Here we introduce a polymeric blend membrane with a three‐dimensional double‐porous morphology prepared from a poly(ε‐caprolactone)/chitosan blends (PCL/CHT) by a modified liquid induced phase inversion technique. The membranes have different physico‐chemical, microstructural and morphological properties depending on different PCL/CHT ratios. Big surface pores (macrovoids) provide a suitable microenvironment for the incorporation of cells or growth factors, while an interconnected small porous (macroporous) network allows transfer of essential nutrients, diffusion of oxygen and removal of waste. Human umbilical vein endothelial cells (HUVECs) were seeded on the blend membranes embedded inside an organ‐on‐chip device. The cellular hydraulic resistance was evaluated by perfusing culture medium at a realistic trans‐endothelial pressure of 20 cmH2O or 2 kPa
at 37 °C after one day and three days post‐seeding. By introducing and increasing CHT weight‐percentage, the resistance of the cellular barrier after three days was significantly improved. The high tuneability over the membrane physico‐chemical and architectural
characteristics might potentially allow studies of cell‐matrix interaction, cell‐transportation and barrier function for optimization of vascular scaffolds using organs‐on‐chips.
Impact statement (less than 100 words)
Organ‐on‐chips (OOCs) offer interesting potential for progress in the treatment of diseases and injury in the growing field of tissue engineering and regenerative medicine. The paper presents a new way to develop polymer membrane with a tunable microstructured morphology and to implement this biomaterial inside an OOCs device. The reader should find measurements of the trans‐endothelial hydraulic resistance in real time during endothelial cells culture: a simple and controlled way of mimicking human physiological condition for vascular tissue regeneration. This combination of novel biomaterial inside an OOC will explore innovative ideas in tissue engineering field.
Keywords: Transendothelial hydraulic resistance, Transendothelial pressure (TEP), Microstructured 3D porous membrane, Organs‐on‐chips, Microfluidics
1. Introduction:
To evaluate specific tissue engineered constructs, current in vitro methods are relatively limited, because they either rely on simple monolayer cell culture systems (e.g. for the evaluation of cytotoxicity) or on low‐throughput bioreactor systems. Because of this, there is a clear need of more advanced in vitro models that can be used as tools to evaluate and optimize tissue engineered constructs. Organs‐on‐chips (OOCs) are considered to better predict cellular responses and potentially mimic a particular organ by introducing organ‐ like features such as fluid flow and mechanical stress with the corresponding cellular preferences (1–3).
Generally, OOCs consist of polydimethylsiloxane (PDMS)‐based structures fabricated using soft lithography (4–6) defining microfluidic channels that are often interfaced through a porous membrane material in which human cells can be cultured. Depending on the application, the membrane normally requires micron‐sized pores to allow cellular interaction, while thickness and biocompatibility need to closely mimic biological conditions of the human body (7,8). Moreover, a straightforward way to resemble the microenvironment of a certain organ by tuning mechanical, biochemical and geometrical aspects (9) leads to better predictions (10). Like all in vitro models, OOCs hold the potential of parallelization and high‐throughput screening with very limited resources.
In spite of the substantial progress in OOC technologies in general (better sensors, pumps and microfluidics) with a rapidly expanding library of OOCs of different organs, the progress in the development of suitable porous, polymeric membranes is very slow. To date a handful of polymeric membrane such as polycarbonate (PC) and Polyethylene terephthalate (PET), are applied for interfacial support in OOCs. These membranes are generally prepared by track‐etching and are mainly obtained from commercial Transwell inserts (11–18) or filter membranes (11,19–24). Depending on the application, they often provide only a basic, non‐physiological cell culture microenvironment due to their limited biocompatible, structural and mechanical properties. All the material properties of the membrane like surface microstructure (25–28), roughness (29–32), hydrophilicity (33,34),
mechanical strength (34,35), and porosity (36–41) have a significant effect on the cellular adhesion and biocompatibity.
Recently, blends of synthetic and natural polymers such as polycaprolactone (PCL) and chitosan (CHT) were found to exhibit excellent abilities to match the needs of their specific target tissues via proper tuning of their properties (42–46). CHT is widely recognized for its natural ability to promote bioactive functionality, tunable degradation, and structural resemblance of native tissue extra cellular matrix (ECM) (47–49). PCL is approved by the Food and Drug Administration (FDA) for clinical use, and is also very suitable for tissue engineering applications (50–54) by providing attractive options for the control of morphology, architecture, dynamic modulus and degradation rate to generate potential alternatives via tuning the synthetic/natural ratio in combination with natural polymers (42–46).
Here we report a straightforward way to integrate a three‐dimensional porous membrane, intended for use in vascular tissue engineering, in an OOC system. We demonstrate that endothelial cells can be embedded in the scaffolds, and their functionality can be probed by measuring their hydraulic resistance with a microfluidic assay. Our study highlights the great potential of applying of OOCs as models for in vitro testing in the field of tissue engineering. 2. Materials and Methods: 2.1. Organ‐on‐chip fabrication The organ‐on‐chip consists of a porous membrane embedded inside a microfluidic device. The chip fabrication was reported in the previous publication from our group (11,55). The membrane is made from a biodegradable PCL/CHT polymer blend with a modified phase inversion technique to allow the formation of double porous morphology. The methods for the chip and the membrane fabrication are briefly described in Supplementary Information (SI 2 and SI 3). The chip design and assembled chip are shown in 3D (Blender v2.78) in Fig. 1. (A).
2.2. Hydraulic resistance measurements in different pressure by Fluidic set up
To evaluate the membrane hydraulic performance, volume flow rate of the culture medium (EGM‐2) through the membrane at different pressures was conducted by a fluidic setup (Fig. 1. (B)). The fluidic setup (Fluigent) controls the pressure and tracks the flow rate in real time (56). The experiments were started from 2 kPa (approximately 20 cmH2O: range of physiological transendothelial pressures or TEP (57–59)) and continued up to 20 kPa. The experimental set up was discussed in section 2.3.1. The obtained flux was plotted against pressure (Fig. 3), and the hydraulic resistance of the membranes was determined (Table. 2) from the slope by equations below (60–62). 𝐽 = (𝑄/𝑡)/𝐴 (1) And, 𝐽 =µ ×∆ (2) Or, 𝑅 = ∆ × µ (3)
Where, J is Flux (m/s), (Q/t) is the volume flow rate (m3/s), A is membrane surface area (m2), µ is 6.913 × 10‐4 Pa∙s, the dynamic viscosity of water at 37 °C (all the flow experiments were done with EGM‐2 but its viscosity is only 5% higher (57,63), while the resistance of the membrane should not be affected by this), ∆ applied pressure difference (Pa) and RMem is resistance (m‐1) of the membrane.
2.3. Flux measurements before and after the cell seeding by Flow sensing set up
The consecutive experiments were done on the same batch of chips with culture medium (EGM‐2) at 2 kPa for one day and three days (Fig. 4). For each batch, three chips were taken.
2.3.1. Flux before cell seeding
Chips were transferred in a plastic culture dish and washed with 70% EtOH thoroughly. Then the chips were washed with sterile PBS three times to ensure removal of EtOH from inside of the channel and both the channels were filled with endothelial cell culture medium (EGM‐2). One top and one bottom entrance was blocked with sealed yellow
pipette tips. The other top channel inlet was connected with the reservoir (30 ml of culture medium) via Tygon tubing. The other bottom channel inlet was connected to the flow rate sensor. Before connecting with the chip, all the tubing and the sensor were filled with culture medium. Then the flow was started at 2 kPa pressure and the flow rate was recorded after 2‐3 minutes to ensure a steady‐state measurement.
2.3.2. Cell seeding
After the flux measurements the channels were washed three times with sterile PBS and kept in PBS suspension for overnight at 4 °C. Then the channels were washed again with sterile PBS and filled with 0.1 mg/ml collagen I in PBS. The channels were inspected for air bubbles (any air bubbles were flushed out by Collagen I solution) and incubated for 30 minutes at 37 °C. Then the chips were taken out from the incubator and flushed with culture medium and incubated for 1 hour at 37 °C. In the meantime, HUVECs were trypsinized and collected from a confluent T175 flask. Then the chips were placed in the sterile hood and 10 µl of cell suspension (4 × 10⁶ cells/ml or 1.5 × 10⁵ cells/cm2) was pipetted slowly inside the top channel and inspected for any bubble formation (any bubble was flushed out by the cell suspension) and incubated in 37 °C for 2 hours. The chips were taken out from the incubator, inspected for complete attachment of the HUVECs by microscope, flushed with fresh culture medium to remove non‐attached cells and incubated again. The medium in the channels was changed twice every day (morning and afternoon). Every time before putting inside the incubator, one drop of culture medium was left on top of all the inlets to prevent the channel from drying. 2.3.3. Flux after cell seeding and staining The chips with seeded cells were taken one by one from the incubator and the flow rate was recorded again like the previous procedure. Directly after the perfusion experiment, the chip was washed with PBS and fixed with 4% paraformaldehyde for 15 minutes. Then the channels were washed with PBS and kept in permeabilization buffer (PB; 9:1 v:v ratio of 11 mg/ml BSA with 1% Triton X‐100 in PBS) at room temperature for 15 minutes to block any non‐specific protein‐binding sites. VE‐cadherin primary antibody (1:200 in PB) was added inside the channel and incubated at room temperature for 2 hours. The
channels were washed with PBS and VE‐cadherin secondary antibody, Phallodin‐488 and DAPI were added together in the ratio 1:400, 1 drop/ml and 1:4000 in PB, respectively, and incubated at room temperature for 1 hour. To prevent photo‐bleaching, the chips were protected from light exposure from this step onwards. Then the chips were washed with PBS thoroughly and imaged with confocal microscopy (Zeiss LSM 510, Nikon) in 15× and 85× magnification (Fig. 5). The images on the membrane were taken at the intersection point of the two channels. For control, cells on the bare PDMS channel surfaces were also imaged.
2.3.4. Calculation of the hydraulic resistance of HUVECs
From the flow rate, flux was calculated from Eq. 1 and plotted for different membranes, before cell seeding and after cell seeding (Table. 3). In addition, the resistance of the cellular barrier (RCell) was calculated from the difference between the total measured
resistance (membrane with the cells) and the blank membrane resistance (without cells). The equation has shown below (60,61). 𝑅 = 𝑅 − 𝑅 = ∆ µ × 𝐽 − ( ∆ µ × 𝐽 ) (4) 2.4. Statistical analysis
All the experiments were done in triplicate (n=3) and the data are shown as mean ± standard deviation. Slope of the blank membrane (Table.2) was determined by using LINST equation. To find the significance of flux after cell seeding (Fig. 4), one‐way ANOVA analysis with Bonferroni correction was done where; ****denotes p<0.0001, ***denotes 0.0001<p<0.001, **denotes 0.001<p<0.01 and *denotes 0.01<p<0.05.
3. Results and discussion:
3.1 Membrane morphological characteristics
After the membrane fabrication, the top surface and the cross section characteristics were analyzed by SEM (Fig. 2 and Table 1) according to the method presented in SI 4. It was found that the membrane surface that was covered by the track‐etched membrane, contained many open big pores which are interconnected with the small pores network as evident from the cross section images. In case of pure PCL, surface big pores were around
21 µm in diameter and inside the bulk were around 30 µm. On the other hand, all the blend of PCL/CHT, surface big pores were around 14 – 16 µm and inside the bulk 51 – 56 µm. The size of the small pores was around 0.8 – 2 µm. Thickness of all the membranes were around 55 – 85 µm. Overall, by this modified phase inversion technique, a remarkable difference was found between the big pores and the small pores. The morphology also contained some pillars, which were almost the same dimension as the track‐etched membrane pores. The amount of pillars was decreasing with increasing CHT %.
The commercial track‐etched membrane upon the casted polymer solution triggered a heterogeneous solvent exchange during the solvent‐nonsolvent exchange. The solvent exchange is faster where the nonsolvent has a direct contact with the solution through the pores of the track‐etched membrane. By introducing and increasing the CHT wt% inside the PCL backbone, several material characteristics can be further tuned like surface pore size and morphology, mechanical property, hydrophilicity, biodegradable properties. Nonetheless, all these characteristics have direct consequences on cellular viability and adhesion phenomena. As stated earlier, the goal of the current work was to study the suitability of these membranes in vascular tissue engineering by evaluating the adhesion of HUVECs, as well as their functionality in terms of generating hydraulic resistance.
3.2. Permeate flux and hydraulic resistance of the membrane at different pressures The OOC was designed in such a way that the membrane scaffolds are embedded in between two channels where the culture medium were perfused through the top channel at realistic TEP (transendothelial pressure; 2 kPa), mimicking the inner lumen properties. The other end of the top channel was blocked so the medium passes through the membrane porous network to the bottom channel. One exit of the bottom channel was also blocked such that the cell operates in dead‐end filtration mode. Firstly, we tested the membrane stand‐alone performance, starting from TEP up to 10 times TEP. After that we enhanced the resistance by seeding the endothelial cell and quantifying the additional hydraulic resistance induced by the cells. This kind of membrane scaffolds loaded with endothelial cells can be applied as grafts for disrupted vascular lumen and resist the
leakage of fluid from inside of the lumen to outside. Due to the biodegradable porous structure, the cell will grow inside the scaffolds by replacing the scaffolds material and hence repair the disrupted lumen.
3.2.1. Permeate flux and Hydraulic resistance of the membranes without cells
The permeate flux of the membranes were plotted (Fig. 3) against pressure starting from realistic TEP (2 kPa). All the membranes showed a linear response across the entire pressure range. In the blend, by increasing CHT wt%, the flux was increasing.
The hydraulic resistance of the membrane was obtained from the slopes in Fig. 3 and depicted in Table 2.
The pristine membrane does not exhibit any membrane compressibility in the TEP range (2 – 16 kPa) (57–59,64), suggesting in the real‐time the bulk microstructure of the membrane will be intact while the cellular ingrowth should not be affected. The blend membrane has a higher resistance (or lower flux) than the control (Polyester membrane), most probably because the blend membranes have a higher hydraulic length (i.e. the membrane thickness) (65) and different pore morphology. These blend membranes have higher resistance even without the cellular attachment than the membrane like Polyester or Polycarbonate filter membrane which are typically used inside the trans wells inserts systems (57,58) or in OOC system (11,55) to asses cellular barrier. The water flux of the control (polyester membrane) in the manufacturer’s protocol (66) is given as ‐ 1000 ml/min/cm2 at 10 psi pressure, corresponds to a membrane resistance of 6.25 × 10⁸ m‐1, which is very close to what we find in our OOC system. This good agreement confirms that the system allows determining the resistance reliably and that the membrane sealing was intact even up to 10 times TEP. The flux is very important to applications of membranes in vascular biology as it dictates the amount of fluid flow that can be processed for a given time and dimension at a defined applied pressure without damaging the mechanical integrity of the membrane (67). Particularly in our blend membrane by increasing CHT wt% the flux was increased likely due to higher hydrophilicity and improved wetting. However, regardless of different chemical property and pore morphology, the resistance of all the blend membranes were
quite close to each other. Unlike the polyester membrane, the advantage of the blend microporous structure is that they consists of big pores which are not all the way through the thickness, reducing the flux while facilitate cellular adhesion and incorporation in the same time. Starting from TEP, the applied pressure range (2 ‐ 20 kPa) was well within the range of transmembrane pressure for microfiltration membrane (68). Copper et. al (69) evaluated the water flux of a PCL‐CHT based nanofibrous membranes by electrospining. They found their membranes exhibited flux values in the same order of magnitude with our reported data in the similar pressure range. Madhavan et. al (64) reported vascular grafts made of thin, dense nanofibrous core composed of poly‐ε‐caprolactone, and a thick, porous, hydrogel sleeve composed of genipin‐crosslinked collagen–chitosan. They achieved a desired flux 528 ml/cm2/min (corresponds to 0.08 m/s) at average blood pressure of 16 kPa and mentioned flux value in that range considered as ideal for immediate grafting and fast healing. They also mentioned flux value below that range does not require any preclotting before implantation, but healing could be slower due to limited molecule transport. Whereas unlike the multilayer morphology they reported, the single layer morphology with macroporous structure like us could be an added advantage with optimum flux property and the fast healing.
3.2.2. Permeate flux and Hydraulic resistance of membranes with cell cultures
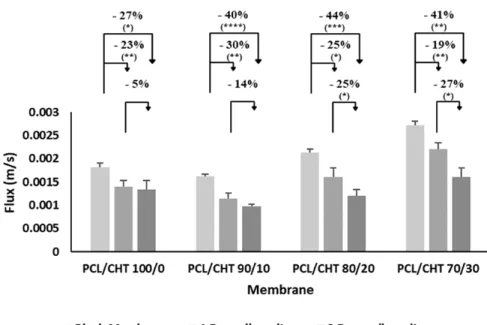
Flux was measured after one and three days of cell culturing and compared with the blank membranes at physiological transendothelial pressure (TEP) 2 kPa (Fig. 4). By introducing and increasing the CHT wt% in PCL, the %reduction of flux was depicted in the figure, where it can be found there was a significant decrease of flux took place after three days compare to one day, most likely due to added cellular resistance.
The primary point of interest of this work was to evaluate the additional hydraulic resistance induced by the HUVECs during the flux measurements. These values were derived from the mean flux after one day and three days of cell culture from Eq. 4 and listed in Table. 3.
The cellular resistance (RCell) increased the total cell‐membrane resistance in the OOC
scaffolds were decreasing perhaps due to enhanced flux property induced by the CHT moieties as discussed above. However, a notable increase in cellular resistance (RCell) after
three days of seeding was observed presumably due to higher numbers of adherent cells and the increase is likely to be more significant by increasing CHT wt%. After three days %RCell increase compare to one day was as follows; PCL/CHT 100/0 (+20 %), PCL/CHT 90/10
(+50 %), PCL/CHT 80/20 (+130 %) and PCL/CHT 70/30 (+200 %). This could be due to combination of better morphological property or pore spacing as evident from the SEM images (Fig. 2) where it was observed that, by increasing CHT wt% the membrane surface has more continuous and smooth space between the pores. Casillo et al. (36) grew endothelial cells on non‐porous and porous SiO2 membranes. The porous membranes had
different pore sizes and corresponding pore spacing, and they found membranes with higher pore spacing give better focal adhesion formation. In contrast, they measured cell‐ cell interactions in the form of tight junctions by ZO‐1, which showed an opposite trend. Porosity especially with smaller pore spacing, could thus limit cell adhesion, but enhance barrier function of cells.
By increasing CHT wt%, the hydrophilicity of the membrane was also increased which could have a positive influence on protein adsorption and hence cell adhesion (29,33). Wala et al. (34) prepared poly(dimethyl siloxane) (PDMS) films with different hydrophilicity and reported that cell attachment, spreading and growth of 3T3 fibroblasts and HaCaT keratinocytes increased with increasing hydrophilicity of the films. Others found that moderate hydrophilicity often yields the best cell response (33,70). Adsorption of serum proteins also showed an optimum on films with moderate hydrophilicity (33) which could be the main cause of the increased cell response.
Above all, the big pores inside the scaffold are likely to play a significant role to increase the cellular resistance. During the cell seeding the HUVECs could block the big pores as they have a globular shape of around 15‐20 µm in diameter which is almost similar in dimension to the big pores on the surface of the scaffold. Chen et al. (25) showed that pore sizes similar or larger than a single cell have significant influence on clusters formation by involving multiple cells together.
3.4. Microscopic observation of cells on the membrane
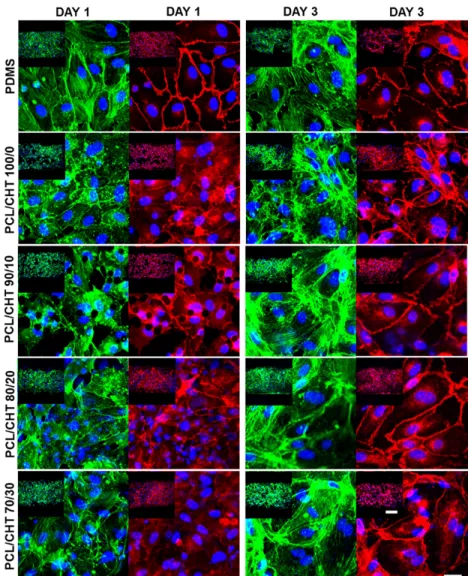
The cellular adhesion was observed after the flux experiments in the confocal images (Fig. 5). After one day (in 15× Mag.) all four batches of membranes showed good cellular adhesion and compatibility. The cellular adhesion was increasing by increasing CHT wt%, which could be due to an increase of surface hydrophilicity and functional property like enhanced collagen coating. Whereas in 85× magnification images, the cell‐cell interactions looks better on PCL/CHT 100/0 and PCL/CHT 90/10 scaffolds by expressing VE‐Cadherin stronger than the other two scaffolds. The cellular morphology was the best on PDMS by strongly expressing VE‐Cadherin with confluent cell‐cell interactions and cortical F‐actin, presumably because the cells prefer a smoother surface during the initial attachments (36).
After three days, the cellular adhesion was clearly higher for PCL/CHT 80/20 and PCL/CHT 70/30 scaffolds than PCL/CHT 100/0 and PCL/CHT 90/10. On PDMS (control) the cellular attachments decreased compared to our membrane scaffolds. This could be due to detachment of the collagen layer from hydrophobic PDMS which eventually detaches the cellular layer. The detachment of the collagen from the PDMS likely occurred due to shear stress during medium changing followed by flux experiments. Normally to establish a strong bonding between PDMS and the collagen layer, chemical modification by amino‐ silane surface treatment is used inside the chips before collagen coating (2). In our case, we skipped this chemical surface modification step purposely in order to compare cellular attachment exclusively on the membrane scaffolds and the control (PDMS surface) during long‐term cell culture. In 85× magnification, HUVECs on all the scaffolds strongly express junctional VE‐cadherin indicating better cell‐cell connectivity compared to day one. In addition, the cells were spreading on the surface by increasing CHT wt%, presumably due to its higher hydrophilicity and better pore spacing of the scaffolds which is evident in the confocal images with spreading of actin filament bundles stained by Phalloidin. For comparison, Xiao et. al. (71) seeded HUVECs in three‐dimensional β‐tricalcium phosphate scaffolds with big pores connected with different interconnection sizes and studied cytoskeletal proteins such as actin to illustrate the spreading and attachment of cells on scaffolds. They found the scaffolds with higher pore spacing exhibited uniform and
homogenous actin distribution of cytoplasm. This phenomenon is understandable, as the big pores mainly provide the space for cell growth, whereas the interconnections function as the doorway for cell‐cell interaction and eventually cell growth into the scaffold (71,72). Du, et al. (42) reported the viability of HUVECs on a gradient nano‐fibrous PCL‐CHT membrane scaffolds for vascular tissue engineering. They found that the HUVECs have a tendency for high proliferation and adhesion on the luminal side (CHT rich) of the gradient scaffolds due to a better ECM proteoglycan‐like structure and adsorption of essential growth factors (VEGF) by the CHT matrix. Our data showed that by increasing CHT wt% in PCL‐CHT membranes, the microporous structure was significantly improved promoting higher endothelial cell types growth on the scaffolds. The entire layer of endothelial cell adhesion on the membrane top surface (lumen side) and the scaffold itself as the adventitial side is a potential match to the natural structure of blood vessels.
In the past, several experiments were reported to monitor the hydraulic transportation phenomena across the endothelial cell layer seeded on membrane at TEP range (57–59). Almost all those experiments were conducted in a trans‐well insert system with the conventional track‐etched filter membranes. The current study is a further step forward in vascular tissue engineering by demonstrating how these three‐dimensional membranes are more convenient candidates with tunable physico‐chemical and microstructural properties when analyzed within OOCs.
4. Conclusion
We showed a straightforward and simple process to quantify the additional hydraulic resistance of HUVECs seeded on three‐dimensional membrane scaffolds in an OOC system. The membrane scaffolds were developed by a modified version of liquid induced phase inversion, using different ratios of polycaprolactone‐chitosan. At first, the flux and the corresponding resistance of the membranes were evaluated in the OOC system, starting from realistic trans‐endothelial pressure (TEP). The flux was found to increase with increasing CHT content in the blend. The additional hydraulic resistance induced by the living HUVECs was quantified in the same set‐up seeded on the membranes after one day and three days using EGM‐2 culture medium. Results suggest that by increasing the CHT
wt%, the microstructural morphology and the chemical properties are significantly improved leading to an increased hydraulic resistance of the cells due to enhanced cellular adhesion.
Overall, our study demonstrates that OOC systems can be used as in vitro platforms to optimize and evaluate the morphology and functionality of various tissue engineering constructs. We anticipate that the use of OOC technology in tissue engineering will increase, because the unique properties of OOCs, with their small size, engineered microenvironments and tissue‐level or organ‐level functional read‐outs. Thus could greatly facilitate the development and optimization of new tissue engineered constructs for regenerative medicine.
5. Acknowledgment
The author would like to acknowledge Marinke van der Helm and Paul ter Braak (BIOS/Lab on a Chip, UTwente) for kindly providing the inset photo in Fig. 1. (A). and the funding organization Erasmus mundus doctorate in membrane engineering‐5th Ed. under European commission (EACEA).
6. Reference: 1. Pasman T, Grijpma D, Stamatialis D, Poot A. Flat and microstructured polymeric membranes in organs‐on‐chips. J. R. Soc. Interface. 15(144), 20180351, 2018; 2. Quirós‐Solano WF, Gaio N, Stassen OMJA, Arik YB, Silvestri C, Engeland NCAV, et al. Microfabricated tuneable and transferable porous PDMS membranes for Organs‐on‐ Chips. Sci. Rep. 8(1), 13524, 2018; 3. Helm MW van der. Electrical and microfluidic technologies for organs‐on‐chips: Mimicking blood‐brain barrier and gut tissues. 2018 [cited 2018 Oct 24]; Available from: https://research.utwente.nl/en/publications/electrical‐and‐microfluidic‐ technologies‐for‐organs‐on‐chips‐mimi 4. Xia Y, Whitesides GM. Soft Lithography. Annu. Rev. Mater. Sci. 28(1), 153, 1998; 5. Huh D, Torisawa Y, Hamilton GA, Kim HJ, Ingber DE. Microengineered physiological biomimicry: organs‐on‐chips. Lab. Chip. 12(12), 2156, 2012; 6. Capulli AK, Tian K, Mehandru N, Bukhta A, Choudhury SF, Suchyta M, et al. Approaching the In Vitro Clinical Trial: Engineering Organs on Chips. Lab. Chip. 14(17), 3181, 2014; 7. Huh D, Hamilton GA, Ingber DE. From 3D cell culture to organs‐on‐chips. Trends Cell Biol. 21(12), 745, 2011; 8. Huh D, Kim HJ, Fraser JP, Shea DE, Khan M, Bahinski A, et al. Microfabrication of human organs‐on‐chips. Nat. Protoc. 8(11), 2135, 2013; 9. Meer AD van der, Berg A van den. Organs‐on‐chips: breaking the in vitro impasse. Integr. Biol. 4(5), 461, 2012; 10. Bhatia SN, Ingber DE. Microfluidic organs‐on‐chips. Nat. Biotechnol. 32(8), 760, 2014;
11. van der Helm MW, Odijk M, Frimat J‐P, van der Meer AD, Eijkel JCT, van den Berg A, et al. Direct quantification of transendothelial electrical resistance in organs‐on‐chips. Biosens. Bioelectron. 85, 924, 2016; 12. Abhyankar VV, Wu M, Koh C‐Y, Hatch AV. A Reversibly Sealed, Easy Access, Modular (SEAM) Microfluidic Architecture to Establish In Vitro Tissue Interfaces. Eddington DT, editor. PLOS ONE. 11(5), e0156341, 2016; 13. Lee H, Kim DS, Ha SK, Choi I, Lee JM, Sung JH. A pumpless multi‐organ‐on‐a‐chip (MOC) combined with a pharmacokinetic‐pharmacodynamic (PK‐PD) model. Biotechnol. Bioeng. 114(2), 432, 2017; 14. Loskill P, Sezhian T, Tharp KM, Lee‐Montiel FT, Jeeawoody S, Reese WM, et al. WAT‐ on‐a‐chip: a physiologically relevant microfluidic system incorporating white adipose tissue. Lab. Chip. 17(9), 1645, 2017; 15. Shim K‐Y, Lee D, Han J, Nguyen N‐T, Park S, Sung JH. Microfluidic gut‐on‐a‐chip with three‐dimensional villi structure. Biomed. Microdevices. 19(2), 37, 2017; 16. Zhu L, Xia H, Wang Z, Fong ELS, Fan J, Tong WH, et al. A vertical‐flow bioreactor array compacts hepatocytes for enhanced polarity and functions. Lab. Chip. 16(20), 3898, 2016; 17. Pocock KJ, Gao X, Wang C, Priest C, Prestidge CA, Mawatari K, et al. Low‐temperature bonding process for the fabrication of hybrid glass–membrane organ‐on‐a‐chip devices. J. MicroNanolithography MEMS MOEMS. 15(4), 044502, 2016; 18. Maoz BM, Herland A, Henry OYF, Leineweber WD, Yadid M, Doyle J, et al. Organs‐on‐ Chips with combined multi‐electrode array and transepithelial electrical resistance measurement capabilities. Lab. Chip. 17(13), 2294, 2017; 19. Wang YI, Abaci HE, Shuler ML. Microfluidic blood‐brain barrier model provides in vivo‐like barrier properties for drug permeability screening. Biotechnol. Bioeng. 114(1), 184, 2017;
20. Sticker D, Rothbauer M, Lechner S, Hehenberger M‐T, Ertl P. Multi‐layered, membrane‐integrated microfluidics based on replica molding of a thiol–ene epoxy thermoset for organ‐on‐a‐chip applications. Lab. Chip. 15(24), 4542, 2015; 21. Ma Y, Pan J‐Z, Zhao S‐P, Lou Q, Zhu Y, Fang Q. Microdroplet chain array for cell migration assays. Lab. Chip. 16(24), 4658, 2016; 22. Lee S, Jin S‐P, Kim YK, Sung GY, Chung JH, Sung JH. Construction of 3D multicellular microfluidic chip for an in vitro skin model. Biomed. Microdevices. 19(2), 22, 2017; 23. Jie M, Li H‐F, Lin L, Zhang J, Lin J‐M. Integrated microfluidic system for cell co‐culture and simulation of drug metabolism. RSC Adv. 6(59), 54564, 2016; 24. Brown JA, Codreanu SG, Shi M, Sherrod SD, Markov DA, Neely MD, et al. Metabolic consequences of inflammatory disruption of the blood‐brain barrier in an organ‐on‐ chip model of the human neurovascular unit. J. Neuroinflammation [Internet]. 13, 2016 [cited 2018 Oct 24]; Available from: https://www.ncbi.nlm.nih.gov/pmc/articles/PMC5153753/ 25. Chen CS, Mrksich M, Huang S, Whitesides GM, Ingber DE. Geometric control of cell life and death. Science. 276(5317), 1425, 1997; 26. Hulsman M, Hulshof F, Unadkat H, Papenburg BJ, Stamatialis DF, Truckenmüller R, et al. Analysis of high‐throughput screening reveals the effect of surface topographies on cellular morphology. Acta Biomater. 15, 29, 2015; 27. Esch MB, Post DJ, Shuler ML, Stokol T. Characterization of in vitro endothelial linings grown within microfluidic channels. Tissue Eng. Part A. 17(23–24), 2965, 2011; 28. Broaders KE, Cerchiari AE, Gartner ZJ. Coupling between apical tension and basal adhesion allow epithelia to collectively sense and respond to substrate topography over long distances. Integr. Biol. Quant. Biosci. Nano Macro. 7(12), 1611, 2015;
29. Lampin M, Warocquier‐Clérout null, Legris C, Degrange M, Sigot‐Luizard MF. Correlation between substratum roughness and wettability, cell adhesion, and cell migration. J. Biomed. Mater. Res. 36(1), 99, 1997; 30. Dowling DP, Miller IS, Ardhaoui M, Gallagher WM. Effect of surface wettability and topography on the adhesion of osteosarcoma cells on plasma‐modified polystyrene. J. Biomater. Appl. 26(3), 327, 2011; 31. Kunzler TP, Drobek T, Schuler M, Spencer ND. Systematic study of osteoblast and fibroblast response to roughness by means of surface‐morphology gradients. Biomaterials. 28(13), 2175, 2007; 32. Lange R, Lüthen F, Beck U, Rychly J, Baumann A, Nebe B. Cell‐extracellular matrix interaction and physico‐chemical characteristics of titanium surfaces depend on the roughness of the material. Biomol. Eng. 19(2–6), 255, 2002; 33. Lee JH, Khang G, Lee JW, Lee HB. Interaction of Different Types of Cells on Polymer Surfaces with Wettability Gradient. J. Colloid Interface Sci. 205(2), 323, 1998; 34. Wala J, Maji D, Das S. Influence of physico‐mechanical properties of elastomeric material for different cell growth. Biomed. Mater. Bristol Engl. 12(6), 065002, 2017; 35. Engler AJ, Sen S, Sweeney HL, Discher DE. Matrix elasticity directs stem cell lineage specification. Cell. 126(4), 677, 2006; 36. Casillo SM, Peredo AP, Perry SJ, Chung HH, Gaborski TR. Membrane Pore Spacing Can Modulate Endothelial Cell‐Substrate and Cell‐Cell Interactions. ACS Biomater. Sci. Eng. 3(3), 243, 2017; 37. Choi S‐W, Zhang Y, Xia Y. Three‐dimensional Scaffolds for Tissue Engineering: The Importance of Uniformity in Pore Size and Structure. Langmuir ACS J. Surf. Colloids. 26(24), 19001, 2010;
38. Di Luca A, Ostrowska B, Lorenzo‐Moldero I, Lepedda A, Swieszkowski W, Van Blitterswijk C, et al. Gradients in pore size enhance the osteogenic differentiation of human mesenchymal stromal cells in three‐dimensional scaffolds. Sci. Rep. [Internet]. 6(1), 2016 [cited 2018 Oct 1]; Available from: http://www.nature.com/articles/srep22898 39. Loh QL, Choong C. Three‐Dimensional Scaffolds for Tissue Engineering Applications: Role of Porosity and Pore Size. Tissue Eng. Part B Rev. 19(6), 485, 2013; 40. O’Brien FJ, Harley BA, Yannas IV, Gibson LJ. The effect of pore size on cell adhesion in collagen‐GAG scaffolds. Biomaterials. 26(4), 433, 2005; 41. Zhang Q, Lu H, Kawazoe N, Chen G. Pore size effect of collagen scaffolds on cartilage regeneration. Acta Biomater. 10(5), 2005, 2014; 42. Du F, Wang H, Zhao W, Li D, Kong D, Yang J, et al. Gradient nanofibrous chitosan/poly ɛ‐caprolactone scaffolds as extracellular microenvironments for vascular tissue engineering. Biomaterials. 33(3), 762, 2012; 43. Correlo VM, Boesel LF, Bhattacharya M, Mano JF, Neves NM, Reis RL. Properties of melt processed chitosan and aliphatic polyester blends. Mater. Sci. Eng. A. 403(1), 57, 2005; 44. Malheiro VN, Caridade SG, Alves NM, Mano JF. New poly(ε‐caprolactone)/chitosan blend fibers for tissue engineering applications. Acta Biomater. 6(2), 418, 2010; 45. Van der Schueren L, Steyaert I, De Schoenmaker B, De Clerck K. Polycaprolactone/chitosan blend nanofibres electrospun from an acetic acid/formic acid solvent system. Carbohydr. Polym. 88(4), 1221, 2012; 46. Cooper A, Bhattarai N, Zhang M. Fabrication and cellular compatibility of aligned chitosan–PCL fibers for nerve tissue regeneration. Carbohydr. Polym. 85(1), 149, 2011;
47. Teotia RS, Kalita D, Singh AK, Verma SK, Kadam SS, Bellare JR. Bifunctional Polysulfone‐Chitosan Composite Hollow Fiber Membrane for Bioartificial Liver. ACS Biomater. Sci. Eng. 1(6), 372, 2015; 48. Prabaharan M, Rodriguez‐Perez MA, de Saja JA, Mano JF. Preparation and characterization of poly(L‐lactic acid)‐chitosan hybrid scaffolds with drug release capability. J. Biomed. Mater. Res. B Appl. Biomater. 81B(2), 427, 2007; 49. Chen F, Li X, Mo X, He C, Wang H, Ikada Y. Electrospun chitosan‐P(LLA‐CL) nanofibers for biomimetic extracellular matrix. J. Biomater. Sci. Polym. Ed. 19(5), 677, 2008; 50. Hong S, Kim G. Fabrication of electrospun polycaprolactone biocomposites reinforced with chitosan for the proliferation of mesenchymal stem cells. Carbohydr. Polym. 83(2), 940, 2011; 51. Das P, Lahitte J‐F, Remigy J‐C, Garmy‐Susini B, Desclaux S, Coetsier C, et al. Artificial membranes tuning for lymphatic wall repair. Eur. Chapter Meet. Tissue Eng. Regen. Med. Int. Soc. ‐ TERMIS‐EU 2016 [Internet]. Uppsala, Sweden; p. 101, 2016 [cited 2017 Dec 13]. Available from: https://hal.archives‐ouvertes.fr/hal‐01360666 52. Li Z, Tan BH. Towards the development of polycaprolactone based amphiphilic block copolymers: molecular design, self‐assembly and biomedical applications. Mater. Sci. Eng. C. 15, 2014; 53. Morelli S, Piscioneri A, Messina A, Salerno S, Al‐Fageeh MB, Drioli E, et al. Neuronal growth and differentiation on biodegradable membranes. J. Tissue Eng. Regen. Med. 9(2), 106, 2015; 54. Xiao Y, Li D, Chen X, Lu J, Fan H, Zhang X. Preparation and cytocompatibility of chitosan‐modified polylactide. J. Appl. Polym. Sci. 110(1), 408, 2008;
55. Helm MW van der, Odijk M, Frimat J‐P, Meer AD van der, Eijkel JCT, Berg A van den, et al. Fabrication and Validation of an Organ‐on‐chip System with Integrated Electrodes to Directly Quantify Transendothelial Electrical Resistance. JoVE J. Vis. Exp. (127), e56334, 2017; 56. FRP Flow Sensor: FLOW‐RATE PLATFORM | Fluigent 2018 [Internet]. Fluigent. [cited 2018 Dec 17]. Available from: https://www.fluigent.com/product/microfluidic‐ components/frp‐flow‐rate‐platform/ 57. Sill HW, Chang YS, Artman JR, Frangos JA, Hollis TM, Tarbell JM. Shear stress increases hydraulic conductivity of cultured endothelial monolayers. Am. J. Physiol.‐Heart Circ. Physiol. 268(2), H535, 1995; 58. Pang Z, Antonetti DA, Tarbell JM. Shear stress regulates HUVEC hydraulic conductivity by occludin phosphorylation. Ann. Biomed. Eng. 33(11), 1536, 2005; 59. Luckett PM, Fischbarg J, Bhattacharya J, Silverstein SC. Hydraulic conductivity of endothelial cell monolayers cultured on human amnion. Am. J. Physiol.‐Heart Circ. Physiol. 256(6), H1675, 1989; 60. Desmond P, Best JP, Morgenroth E, Derlon N. Linking composition of extracellular polymeric substances (EPS) to the physical structure and hydraulic resistance of membrane biofilms. Water Res. 132, 211, 2018; 61. Desmond P, Böni L, Fischer P, Morgenroth E, Derlon N. Stratification in the physical structure and cohesion of membrane biofilms — Implications for hydraulic resistance. J. Membr. Sci. 564, 897, 2018; 62. Tripathi BP, Das P, Simon F, Stamm M. Ultralow fouling membranes by surface modification with functional polydopamine. Eur. Polym. J. 99, 80, 2018; 63. Fröhlich E, Bonstingl G, Höfler A, Meindl C, Leitinger G, Pieber TR, et al. Comparison of two in vitro systems to assess cellular effects of nanoparticles‐containing aerosols. Toxicol. In Vitro. 27–360(1), 409, 2013;
64. Madhavan K, Elliott WH, Bonani W, Monnet E, Tan W. Mechanical and biocompatible characterizations of a readily available multilayer vascular graft. J. Biomed. Mater. Res. B Appl. Biomater. 101(4), 506, 2013; 65. Bazyar H, Lv P, Wood JA, Porada S, Lohse D, Lammertink RGH. Liquid–liquid displacement in slippery liquid‐infused membranes (SLIMs). Soft Matter. 14(10), 1780, 2018; 66. Product lines [Internet]. GVS Filter Technol. [cited 2018 Sep 18]. Available from: http://www.gvs.com 67. Barhate RS, Ramakrishna S. Nanofibrous filtering media: Filtration problems and solutions from tiny materials. J. Membr. Sci. 296(1), 1, 2007; 68. Bjorge D, Daels N, De Vrieze S, Dejans P, Van Camp T, Audenaert W, et al. Performance assessment of electrospun nanofibers for filter applications. Desalination. 249(3), 942, 2009; 69. Cooper A, Oldinski R, Ma H, Bryers JD, Zhang M. Chitosan‐based nanofibrous membranes for antibacterial filter applications. Carbohydr. Polym. 92(1), 254, 2013; 70. Premnath P, Tavangar A, Tan B, Venkatakrishnan K. Tuning cell adhesion by direct nanostructuring silicon into cell repulsive/adhesive patterns. Exp. Cell Res. 337(1), 44, 2015; 71. Xiao X, Wang W, Liu D, Zhang H, Gao P, Geng L, et al. The promotion of angiogenesis induced by three‐dimensional porous beta‐tricalcium phosphate scaffold with different interconnection sizes via activation of PI3K/Akt pathways. Sci. Rep. 5, 9409, 2015; 72. Mastrogiacomo M, Scaglione S, Martinetti R, Dolcini L, Beltrame F, Cancedda R, et al. Role of scaffold internal structure on in vivo bone formation in macroporous calcium phosphate bioceramics. Biomaterials. 27(17), 3230, 2006;
Table. 1. Relationship between polymer blend ratio and membrane pore size. PCL/CHT 100/0 PCL/CHT 90/10 PCL/CHT 80/20 PCL/CHT 70/30 Surface Big Pores Dia. (µm) 21.4±5.2 14.3±4.1 15.3±3.4 15.8±5.7 Bulk Big Pores Dia. (µm) 30.6±4.9 54.4±7.6 51.9±9.2 56.1±5.5 *Surface Small Pores Dia. (µm) 2.3±1.5 0.8±0.3 1.4±0.5 1.7±0.9 Thickness (µm) 55 85 65 80
Table 2. Resistance determined by the slop of the Flux vs Pressure graph. Slope of the Flux vs Press graph (1/RMem.µ) m/Pa∙s × 10‐5 Resistance (R) m‐1 × 10⁸ Polyester membrane 0.26±0.001 5.48±0.06 PCL/CHT 100/0 0.1±0.001 14.47±0.39 PCL/CHT 90/10 0.11±0.002 13.65±0.25 PCL/CHT 80/20 0.14±0.003 10.48±0.18 PCL/CHT 70/30 0.19±0.004 7.73±0.19
Table 3. Resistance of HUVECs cellular barrier determined by eq. 4 and computed in terms of hydraulic conductivity Lp after 1 and 3 day. Resistance of HUVECs (RCell) m‐1 x10⁸ Hydraulic conductivity of HUVECs (Lp) cm.s‐1.cmH2O‐1 × 10‐2
1 Day 3 Day 1 Day 3 Day
PCL/CHT 100/0 4.8±2.1 5.8±3.2 2.96±1.99 2.44±2.22 PCL/CHT 90/10 7.7±2.5 11.8±0.9 1.84±0.70 1.21±0.09 PCL/CHT 80/20 4.5±1.8 10.5±2.4 3.14±1.17 1.34±0.33 PCL/CHT 70/30 2.5±0.5 7.4±2.0 5.72±1.33 1.91±0.5
Fig. 1: (A) Organ‐on‐chip device (inset Picture: BIOS/Lab on a Chip, UTwente); exploded view of the PDMS chip with the top channel (TC), membrane (M), bottom channel (BC) and (PT) blocked pipette tip. The working area of the membrane suspended between two channels is 500 µm × 500 µm. (B) Fluidic set up; determination of volumetric flow rate by perfusion of the cell culture medium (EGM‐2) through one top channel and collection of the permeate through the bottom channel to the sensor.
Fig. 2. SEM images of membranes on the Top surface and cross section with double porosity; (A, B) PCL/CHT 100/0, (C, D) PCL/CHT 90/10, (E, F) PCL/CHT 80/20, (G, H) PCL/CHT 70/30 respectively using track‐etched membrane (10 µm). All images were taken after removing the track‐etched membrane.
Fig. 3. Flux vs Pressure of four different membrane compare to Polyester membrane (control) measured (n=3) in Organ‐on‐chip device by fluidic set up.
Fig. 4. Flux of four different membranes before cell seeding and after one day and three days of cell seeding. All values were measured at physiological transendothelial pressure (2 kPa). The percentages denote flux reduction compared to the individual blank membrane. (**** p<0.0001, *** 0.0001<p<0.001, ** 0.001<p<0.01 and * 0.01<p<0.05 in one‐way ANOVA analysis with Bonferroni correction).
Fig. 5. LCSM representative images of HUVECs on different blends of membranes after staining three different parameters (nucleus by DAPI in blue, cell cytoskeleton by phalloidin 488 in green and cell junctions by VE‐Cadherin in red) taken after permeability experiments inside OOC systems after 1 day and 3 day of cell seeding. Bars; 200 µm in inset view (15× mag.) and 20 µm in enlarged view (85× mag.).
Supplementary information SI 1. Materials
PCL with a molecular weight (MW) of 80 kDa (CAPATM 6800, CAS Number 24980‐41‐4) was obtained from Perstorp Holding AB, Sweden. CHT with medium MW (190 kDa – 310 kDa) and 75 – 85 % degree of de‐acetylation (CAS Number 9012‐76‐4) was purchased from Sigma‐Aldrich. Polyethylene Terephthalate (PET) isoporous (track‐etched) membranes with pore diameter 10 µm were commercially obtained from Sterlitech, USA. Solvents (AcOH, HCOOH) and NaOH was obtained from Sigma‐Aldrich. PDMS was purchased from Dow Corning as a kit containing base and curing agent (Sylgard 184, Midland, MI, USA). Toluene was purchased from Merck, Germany. Polyester membrane (8 µm pore size and 10 µm thickness) was obtained from GVS Filter Technology. Fluorescent dye (Dextran 4 kDa) was purchased from Sigma. Human umbilical vein endothelial cells (HUVECs) were obtained from Lonza and the corresponding culture medium (EGM‐2: basal endothelial growth medium with supplement mix, CC‐22011) was obtained from Promocell. Collagen I (rat‐ tail), goat anti‐human vascular endothelial (VE)‐Cadherin primary antibody were purchased from Santa Cruz. Phosphate buffered saline (PBS), Trypsin‐EDTA, paraformaldehyde, donkey anti‐goat IgG Alexa Fluor 546, 6‐Diamidino‐2‐Phenylindole (DAPI), and Alexa Fluor 488 Phalloidin were purchased from Thermo Fisher. Triton X‐100, bovine serum albumin (BSA) were purchased from Sigma Aldrich.
SI 2. Double porous membrane scaffolds fabrication
The membranes were prepared using a modified liquid induced phase inversion technique using formic acid/acetic acid (FA/AA) as solvent and NaOH as non‐solvent (Supp. Fig. 1; 3D imaging by Blender v2.78). PCL and CHT with a ratio 100/0 (15 wt.%), 90/10 (14 wt.%), 80/20 (14 wt.%) and 70/30 (10 wt.%) (w/w %) were dissolved in the FA/AA (w/w %) mixture. At first CHT was dissolved in the solvent at 55 °C for 12 hours. PCL was added when the temperature was below 35 °C. Within 2 hours a clear, viscous and a light yellow solution was obtained. After standing for 10‐20 minutes, the polymer solution was casted on a glass plate by a casting knife in order to achieve a thickness of around 250 µm at temperature 16 °C. Then the track‐etched commercial membrane (pore diameter 10 µm)
was rinsed with the solvent, slowly wiped to remove excess solvent and gently applied on the casted polymer solution. The glass plate was then slowly immersed inside the non‐ solvent bath containing NaOH aqueous solution at 16 °C. Just after immersion, solvent exchange started by forming a flat sheet membrane due to de‐mixing of the polymer. With this method, heterogeneous membranes were formed due to local different solvent exchange. The solvent exchange rate was homogeneous on the zone where the casted solution was not covered by the track‐etched membrane, leading to a single and closed porous structure. On the other hand, where the polymer solution was covered by the track‐etched membrane, two different solvent exchange rates were observed, leading to the formation of a double porous morphology. The big pores (macrovoids) were formed where the non‐solvent could directly access the casted solution through the pores of the track‐etched membrane. A network of interconnected small pores (macroporous) network was formed where the non‐solvent was not able to make a direct entry (Fig. 2).
After formation of the membrane, when it turned opaque and detached from the glass plate, the track‐etched membrane was removed gently and the newly formed membrane was washed several times in pure water. Then, the membrane was stored in ultrapure water in 4 °C temperature. The surface where the big pores were open towards the non‐ solvent is denoted as top surface and the other surface, which was facing the glass plate is denoted as the bottom surface.
Due to the high viscosity of CHT in the solvent, we could not go beyond the ratio PCL/CHT 70/30 as it was quite difficult to make a homogeneous solution. Double porous membrane formation with pure CHT was not successful as dissolving CHT more than 4 wt.% was difficult.
SI 3. Organ‐on‐chip fabrication
Briefly, PDMS base agent and curing agent were mixed in a 10:1 wt% ratio. After degassing, this mixture was poured onto an SU‐8 patterned silicon wafer and cured for 4 h at 60 °C. Then the PDMS with channel imprints was cut into top and bottom parts, and four inlets were punched (by 0.5 mm diameter biopsy puncher) into the top parts containing the top channel. Dust was removed using Scotch tape (3M). To assemble the
two PDMS parts with an embedded membrane, a PDMS/toluene glue at 5:3 wt ratio (1,2) was prepared which ensures complete leakage‐free bonding of the two PDMS parts. At first, the glue was spin‐coated onto a glass coverslip (1500 rpm for 60 s, ramped at 1000 rpm s‐1; Spin 150, Polos, the Netherlands) and a thin layer was transferred to both PDMS halves using an ink roller. Then the doubled‐porous membrane of 2 mm × 2 mm was cut and placed in the centre of the bottom half. The top part was aligned and gently placed on the bottom part without applying pressure, after which the chips were baked for 3 days at 30 °C (baking was done in low temperature to avoid unwanted damage of the membrane microstructure by melting). Polyester membrane (8 µm pore size and 10 µm thickness) (3) was also embedded inside the chip system by using the PDMS/toluene glue (Baked in 60 °C for 4 hours) and the resistance of flow was determined as a control with the same procedure. This polyester membrane is typically used in Transwell insert systems for cell culture purposes. SI 4. Membrane characterization by scanning electron microscopy
After preparation of the membrane with double porosity, the repeatability of the membrane surface and bulk morphology was checked by scanning electron microscopy (SEM; JEOL 5600LV) (Fig. 2). Diameter of the big pores and small porous size distribution were evaluated by ImageJ software on the SEM images. SI 5. Verification of the absence of leakage with fluorescent dye After fabrication and before the flux experiments, the chips were verified in order to check good sealing between the membranes and the PDMS or for any unwanted leakages. To do that, a fluorescent dye (4 kDa dextran Alexa 488, 1 mg/ml in PBS) was pipetted inside the channel and the chips were inspected by performing fluorescence microscopy (EVOS FL, Life Technologies) for one day (Supp. Fig. 2).
For this experiment, chips with different batch of membrane were taken and they were imaged in EVOS, where no leakage out of the channel was found just after pipetting the dye. Then the chip were kept in room temperature for one day and imaged again. This time the fluorescent dye was slightly dispersed out of channel from inside the membrane
area. The normal hand pressure of pipetting inside the channel must be much higher than the pressure of interests (TEP at 2‐16 kPa), suggesting at real time Transendothelial pressure (TEP) the probability of leakage inside the channel is almost none.
SI 6. Permeate flux of the membrane in Amicon cell
To assess the membrane hydraulic performance in a high‐pressure filtration system, flux of all the membranes mentioned above were also measured in an Amicon cell at room temperature with deionized water at pressure 20 kPa to 60 kPa (SI Fig. 3). The hydraulic flux and the resistance for water was determined by the above equation where the dynamic viscosity of water at 25 °C was considered as 8.9 × 10‐4 Pa∙s. The flux was found much lower than the OOC system at pressure 20 kPa.
The overall flux of all the membranes follow the similar trend. By increasing CHT wt% flux is increasing due to higher hydrophilicity and improved wetting. Unlike the OOC system, flux was not increasing linearly with pressure due to membrane compaction as big pores are present inside the bulk resulting collapsing of the pores through the thickness. By increasing CHT wt% membrane compaction is increasing as CHT in wet condition is mechanically less stable than PCL, wreaking the PCL structural integrity. PCL/CHT 90/10 has shown the highest compressibility due to smallest small pores. Flux of a Polyester membrane (8 µm pore size and 10 µm thickness) was also measured as a control which is around 30 – 100 times higher than the blend membrane.
Due to the non‐linearity of the flux vs pressure graph in the blend membrane, the hydraulic resistance was determined in each corresponding pressure (and water viscosity at 25 OC) by Eq. 3 and listed in SI. Table. 1. Comparison of hydraulic resistance obtained in Fluigent and Amicon cell Below is the Resistance (m‐1) of the Polyester membrane by different report ‐ Manufacturer protocol (3) 4.6 × 10⁸ m‐1 (at press 70 kPa or 10 psi and Vis. Water in 25 °C) Amicon cell 15.2 × 10⁸ m‐1 (from slop in Supp. Fig. 3, using Vis. Water in 25 °C)
In OOC 5.5 × 10⁸ m‐1 (from slop in Fig. 3, using Vis. Culture medium in 37 °C)
For the polyester membrane (as control), the resistance that obtained from OOC system was quite similar that has been reported in the manufacturer protocol whereas the value in the amicon cell was 3 times higher from the manufacturer protocol. Whereas, in case of PCL‐CHT membrane, the resistance in the amicon cell was 100 times higher than that have been obtained in the fluigent system. Unlike the PCL‐CHT membrane, hydraulic flux in the polyester membrane was simpler due to lower hydraulic length (membrane thickness 10 µm) and smooth surface with pores all the way through the membrane thickness. In spite of that, the resistance value in the polyester membrane obtained in the Amicon cell was increasing could be due to added internal instrumental resistance. Whereas PCL‐CHT membranes has more complicated surface and bulk morphology than the polyester membrane. Moreover, the blend membrane surface was heterogeneous with combination of pores and pillars where the pillar was decreasing by increasing CHT wt% (the exact proportion of the pores and pillars was unknown). Hence, the resistance that obtained from the Amicon cell is combination of pores and with some pillars. Although similar thing should happen in the OOC system but here the flux experiment was started from 10 times lower pressure and 1256 times lower membrane surface area where it possible that membrane surface majorly faced Pillar (which was giving zero reading and was discarded) and pores (which was giving reading and considered). And as the reading in the OOC was considered majorly from the pores, the resistance should be much lower than the reading of Amicon cell.
Supplementary references 1. Chueh B, Huh D, Kyrtsos CR, Houssin T, Futai N, Takayama S. Leakage‐Free Bonding of Porous Membranes into Layered Microfluidic Array Systems. Anal. Chem. 79(9), 3504, 2007; 2. Griep LM, Wolbers F, de Wagenaar B, ter Braak PM, Weksler BB, Romero IA, et al. BBB ON CHIP: microfluidic platform to mechanically and biochemically modulate blood‐brain barrier function. Biomed. Microdevices. 15(1), 145, 2013; 3. Product lines [Internet]. GVS Filter Technol. [cited 2018 Sep 18]. Available from: http://www.gvs.com