/
z
-
William J. Dally
Thesis Supervisor IAsynchronous Event Handling
bySandeep Chatterjee
B.S. Electrical Engineering and Computer Science University of California at Berkeley (I 995)
Submitted to the Department of Electrical Engineering and Computer Science In Partial Fulfillment of the Requirements for the Degree of
Master of Science
in Electrical Engineering and Computer Science
at the
MASSACHUSETTS INSTITUTE OF TECHNOLOGY
May 1996
996 Sandeep Chatterjee. All rights reserved.
The author hereby grants to MIT permission to reproduce and to distribute copies of tis thesis document in whole or in part.
Author 7,
Department of Electrical Engineering and Computer Science
May 15, 1996
Certified by
Accepted 3
-" ."I ... . ...A Frederick R. M orgenthaler
"L
Chairman, Department Committee on Graduate Theses-03ETTS NS:';r'TU-'Zr OF TECHWILOGN
by
Sandeep Chatterjee Submitted to the
Department of Electrical Engineering and Computer Science on May 15, 1996, in partial fulfillment of the requirements for the Degree of Master of Science in
Electrical Engineering and Computer Science
Abstract
Application programs and runtime systems are increasingly using events (sometimes called interrupts or exceptions) to optimize program performance. As event frequency rises, the overhead associated with event handling becomes a larg,,er part of total program execution time. This high overhead arises from the synchronous approach to handling events which many modem architectures employ. We explore the deficiencies of the synchronous method and present an alternative - asynchronous event handling. We describe the MIT M-Machine's implementation of asynchronous event handling, and discuss the role of architecture in simplifying and supporting such mechanisms.
Thesis Supervisor: William, J. Dally
Title: Professor of Electrical Engineering and Computer Science
Acknowledgments
Many people have contributed to this thesis and to my first year at MIT.
I would like to thank Bill Dally for giving me the chance to work in te CVA research group and on the M-Machine project. These past few months have been a great educational experience and I have had a terrific time. Thanks Bill!
I would also like to thank the members of the CVA group who ake coming to work each day a pleasant experi-ence. I would especially like to thank my officemate, Steve Keckler, who guided me through this thesis and spent numerous hours having technical (and sometimes not so technical!) conversations with me. Thanks CVA-ers! Most importantly, I would like to thank my parents and my grandmother for their constant support throughout this past year and throughout my life. Through my ups and through my downs, they have always been there for me. Finally, I would like to thank my brother who has been on-call for me 24 hours a day, 365 days a year I would not be where I am today if it were not for him! Thanks Didu, Baba, Ma and Dada I love you all very much!
The research described in this thesis was supported ii! part by a National Science Foundation Graduate Research Fellowship.
Table of Contents
Table of Contents 7 List of Figures 9 List of Tables I I 1. Introduction 13 Thesis Overview 14 2. Definitions 15 Events 15Event Handling Mechanisms 16
Performance Evaluation 18
3. Motivation and Background 19
Background 19
Examples and User-Level Events 20
4. Analytical Models 23
31
5. M-Machine Implementation
Overview of the M-Machine 3
M-Machine Event Subsystem 33
6. M-Machine Experiments 37
Event Frequency 37
Handler Latency 38
Instruction Slack with Multi-Threading 40
Synchronous Event Handling 42
User Level Event Handling 43
7. Conclusion 45
A. Event Queue Design 47
Operation of the Event Queue Unit 47
Event Queue Unit Interface 49
Architecture of the Event Queue Unit 50
---Figure 1: Switch-like representations of the five steps involved in handling an event synchronously. Figure 2 Switch-like representations of the three steps involved in handling an event asynchronously. Figure 3 Timelines for the analytical models of synchronous and asynchronous event handling. Figure 4 Plots of the percentage of time user code execution is stalled because of event handling. Figure 5: V-Thread and H-Thread organization of the M-Machine.
Figure 6 The M-Machine's Event Queue Unit. Figure 7 Typical M-Machine event packet. Figure 8: Event Frequency Statistics. Figure 9 Multi-thread execution statistics.
Figure 10: Speedup from asynchronous event handling over synchronous event handling. Figure I : The Event Queue Unit within the Multi-ALU Processor chip.
Figure 12: Top-level diagram of the MAP Event Queue (EQ) Unit. Figure 13: Handshake signals for reading from the Event Queue Unit. Figure 14: Event Queue Datapath Interface
Figure 15: Top-level architecture of the MAP Event Queue Unit.
16 17 25 28 32 34 35 38 41 42 48 50 51 52 52
List of Figures
Table 1: Relative number of cycles required for event handling on the M-Machine. 40
List of Tables
CHAPTER1
Introduction
Over time the overhead of handling an event in hardware, measured in instructions, has increased as pipelines have gotten deeper and wider, and the machine state has expanded. With this high overhead, many potential applications for events are cur-rently ruled out as being prohibitively expensive. For example, today parallel threads synchronize with one another and with message arrival by polling (spin locks). Significant savings would result if event handling were inexpensive enough to replace polling for such applications.
The high overhead of today's event systems stems from the synchronous approach to event handling in; which the current thread is stopped at the instruction causing the event, subsequent instructions in the pipeline are cancelled, and a con-text switch is made to an event handler. Handling events asynchronously, in a sepa-rate hardware thread that runs in parallel with the executing process, eliminates much of the overhead of event handling. No instructions are cancelled, there is no context switch, and the thread causing the event may continue to issue instructions. This gives a small performance improvement for existing applications, and, more
Introduction
importantly, makes hardware event handling feasible for high frequency events such as off-node cache misses, message reception, and thread synchronization.
1.1 Thesis Overview
This thesis examines the design, implementation and trade-offs of asynchronous event handling as an alternative to the traditional synchronous method.
Chapter 2 begins by defining the key terminology used throughout this thesis. Chapter 3 then delves into the history and background of events and their handling mechanisms. It outlines a few possible uses of events and motivates the need for fast event handling.
Chapter 4 begins the analysis and comparison of synchronous and asynchro-nous event handling. It pesents a simple analytical model for the two event han-dling classes, and investigates the variables which affect each. Using the models presented, the chapter goes on to forecast the cost of event handling as the relevant variables in the models are varied and as current architectural trends continue.
Chapters and 6 describe one specific implementation of asynchronous event handling, and evaluate it over a number of criteria. Chapter begins by outlining the overall architecture of the MIT M-Machine and then delves into a detailed description of its event subsystem. Chapter 6 continues the study of the M-Machine's by presenting performance data for its event subsystem, and by discuss-ing how the architectural features of the M-Machine affect the data presented.
Finally, Chapter 7 concludes this thesis by evaluating our findings and by dis-cussing future work.
CHAPTER 2
This chapter presents the basic terminology used throughout this thesis. It begins by defining what an event is and how one is generated. The chapter goes on to discuss the two main classifications of event handling mechanisms, and finally concludes by discussing the terminology used throughout this thesis for analyzing the perfor-mance of different event handling mechanisms.
2.1 Events
An event is the occurrence of a condition that requires software intervention to
complete. The arrival of a message, a thread reaching a barrier, and a TB-miss are all examples of events. An internal event is caused by an instruction of an execut-ing program, e.g., a TB-miss while an external event is caused by some other computer or physical process, e.g., a message aiving or input queue filling. We call the instruction causing an internal event thefaulting instruction and its thread
thefaulting thread.
Definitions
Step 1: User code execution. Step 2 Event detected. Prepare Step 3 Run event handler. to service event (context switch).
---- Event Handler Code User Code FU
Step 4 Return from event Step 5: Continue with user handler (context switch). code.
Figure 1: Switch-like representations of the five steps involved in handling an event synchronously. Initially, the user code instruction stream is executed on the functional units (FU). After an event is detected, a context switch is made to the event handler instruction stream. After all of the handler instructions are executed, another context switch to the user code resumes execution of the user code from the faulting instruction.
2.2 Event Handling Mechanisms
With
synchronous event handling, the faulting thread is rolled-back to just beforethe faulting instruction, any instructions already in flight are cancelled, and a jump is performed to an event handler. When the event handler completes execution, a jump is performed back to the faulting thread, resuming execution with the faulting instruction. In this case, the handler is exactly synchronized with the faulting thread. All of the handler instructions are run after the instruction just before the faulting instruction and before the faulting instruction itself. Figure I shows graph-ical depictions of the different steps involved in synchronous event handling.
With asynchronous event handling, the faulting thread is not halted, but rather
allowed to continue execution until it needs the result of the faulting instruction. Instead of 'umping to an event handler, the handler is run on a separate thread. The handler completes the operation performed by the faulting instruction so there is no
Step 1: User code execution. Step 2 Run event handier Step 3 Return from handier. in parallel with user code.
- Event Handler Code - User Code
Figure 2 Switch-like representations of the three steps involved in handling an event asynchronously. Initially, the functional units U) dedicated for event handling are idle, while the user code instruc-tion stream executes on those Us dedicated for user code. When an event is detected, the event han-dling Us simply execute the event handler code; the separate sets of Us allow both the handler and the user code to execute in parallel. Finally, after the event is resolved, the event handier FUs are once again idle.
need to rerun the instruction. If the instruction slack, the number of instructions between the faulting instruction and the first instruction which uses its result, is larger than the handling time, the faulting thread can continue executing without ever being interrupted by the event. The handling is asynchronous with respect to the faultin thread. Handler and faultino, thread instructions interleave execution9 C, only synchronized by data dependency. An instruction cannot use the result of the faulting instruction until it is produced by the handier. Figure 2 shows the different stages of asynchronous event handling.
Asynchronous -,vent handling should not be confused with imprecise event handling (often called imprecise exceptions). With imprecise event handling, the exact identity of the faulting instruction is not known, only its general location. With asynchronous event handling, on the other hand, the identity of the faulting instruction is known exactly. The event is precise. The handier is merely run asyn-chronously with respect to the faulting thread.
Definitions
2.3 Performance Evaluation
After an event is detected an event handler is dispatched. This handler deciphers what transpired and calls the appropriate handler routine to resolve the event. We define handler overhead as the time to initiate the event handler, jump to the han-dler routine and execute it's first instruction, return from the hanhan-dler routine, and return from the event handler. This is different from the handler runtime which is the time to execute all of the instructions in the handler routine. Handler cost is the amount of time user code is stalled because of event handling. Since handler runt-imes, vary with the event type (this is especially true for user level handlers) and are usually independent of the handling mechanism used, we focus mainly on the han-dler overhead and cost.
The recent development and success of distributed and parallel computers have sig-nificantly changed the frequency and type of events generated by programs. The need for communication in distributed systems and synchronization in multi-threaded environments have drastically increased the frequency of internal events. Unfortunately, the increase in event frequency has ot seen a commensurate decrease in the cost (in processor cycles) to handle an event. In some cases, the cost may actually have increased [10]! As event frequency rises with an increased (or even constant) overhead per event, event handling becomes a larger part of total program execution time and machine performance suffers.
3.1 Background
The main issue in event handling is how to quickly resolve an event once it is detected. Various different approaches have been pursued and implemented by dif-ferent machines. Most single processor, single threaded architectures, such as the
Mofivafion
aid
Background
Motivation and Background
PowerPC[6], use synchronous event handling. As we have seen, this approach may incur a substantial cost. After it detects an event, the processor can spend poten-tially tens of issue cycles waiting for earlier instructions to complete, cancelling later instructions, and saving the current context. It must again repeat this on the return from the handier.
The -Machine uses a variant of asynchronous event handling for inter-node message reception[7]. Message arrival causes one of the message handler threads (depending on the priority level of the message) to issue. Separate hardware context for each thread allows fast switching from the user thread to the message handler thread. However, long latency operations from the message handler are not masked by operations from the other threads. All other events are handled synchronously.
The Tera uses a form of synchronous handling in which events are handled by the faulting thread[8]. Extra event handler registers associated with each hardware thread obviate the need for a full context switch, while round-robin issuing of threads on each cycle masks operation latency. Since the Tera allows concurrent execution of up to 128 threads, this method may suffer from a large event handler execution time and lower latency per thread.
3.2 Examples and User-Level Events
Numerous application and systems programs will benefit from fast events. For example, TB-misses, which are commonplace in most systems, will be resolved faster. Software implementations of cache-coherence protocols will become more practical. As the handler overhead is lowered, using events for more mundane and routine tasks becomes reasonable. Fast event handling not only improves the perfor-mance of internal events which are generated by the system for the proper execu-tion of a proaram, but also make user-level events plausible. The ability to detect an occurrence of a special situation in hardware and resolve it in software is an useful
function. Such user-level events can be utilized by programmers to optimize (or at least improve) algorithms and improve program performance. The next few para-graphs discuss two uses of user-level events.
Instruction set extension is a scheme used by some computer systems to allow instructions which are not supported by hardware. Whenever such an unsupported instruction is parsed, an event is generated. The event handler deciphers the type of instruction and performs the appropriate action, effectively and transparently extending the instruction set. Instruction set extension is used for such things as maintaining backward binary compatibility, and constructing atomic instructions from non-atomic ones. If the new instructions are popular, the event frequency can be very large. The need for a fast handler in this situation is obvious.
Another application which may potentially benefit from fast events is garbage collection. I I describes a method of concurrent garbage collection using events. In this scheme, the collector runs concurrently with the mutator in a multi-threaded, multi-processor environment. However, if the mutator accesses an object on an unscanned partition, an event is signalled. The handler halts the mutator and asks the collector to scan all of the objects on that partition. This technique allows the collector to run concurrently with the mutator while not requiring that the mutator access only objects already scanned. Since the mutator is stalled while the handler runs, it is important that the total handler time be small. In this case, the handler runtime is the time to run the collector on that partition.
This chapter has shown that fast events have many benefits and may poten-tially improve program performance. Traditional systems will benefit from faster resolution of events such as T1,13-misses. Parallel and distributed systems will offer improved performance with faster communication and synchronization. Finally, user-level events may indirectly affect program performance by allowing improved algorithms.4__
CHAPTER 4
Analytical Models
In this chapter, we present a simple model for analyzing event handling mecha-nisms. We apply this model to both synchronous and asynchronous event handling, and derive the variables which affect each.
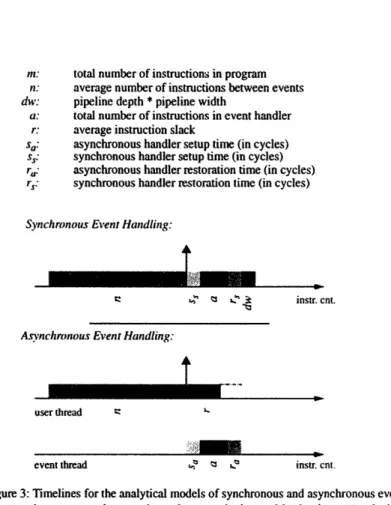
Figure 3 shows timelines depicting our model for analyzing synchronous and asynchronous event handling. The models assume that events are detected and are handled in regular cycles. Each cycle consists of three main steps: user code execu-tion, event detection by hardware (represented by a vertical arrow), and handler execution.
The synchronous model is shown with a single thread on which both the user code and the event handler execute sequentially. The asynchronous model consists of two threads -- one user thread and one event thread. In this section, we use a sim-plified model in which the event thread runs on a separate cluster from the user thread. We remove this restriction when we discuss the M-Machine's implementa-tion of asynchronous handling in Chapter .
Analytical Models
latency before handler instructions can begin executing. In the synchronous case, the latency is due to the time needed to:
• stall user code,
• save the current state of the processor,
• cancel all outstanding instructions in the pipeline,
• create an environment to transfer control to the handler, and • jump to the handler code.
In the asynchronous case, the latency is merely the time to fork a thread on which to run the handler process. Since forking a thread may incur a large overhead, some systems simply provide a dedicated event thread. In this case, the latency is the time to issue the first instruction from the dedicated event thread.
In the next step, both mechanisms begin executing handler instructions. The asynchronous handler runs in parallel with user code whereas in the synchronous case, user code is stalled while the handler executes. It is important to note that since the user code which is executed while the handler runs may also generate events, asynchronous event handling mechanisms require a buffer in which to store outstanding events for future handling.
After the event has been serviced, both handling mechanisms again incur a delay. In the synchronous case, this time is used to:
• restore state of the machine, • return from the handler, and
• re-start user code from the faulting instruction.
In the asynchronous case, the lag is merely the time to stall the handler thread and complete the faulting instruction.
From analyzing the models in Figure 3 we can derive equations to estimate the percentage of time user code execution is stalled because of event handling. This value is simply the ratio of the total time spent in only event handling to the total execution time of the program. Zero percent is ideal in which case the processor is always busy executing user instructions.
ME---userthread
-0-M: total number of instructions in program
n: average number of instructions between events
dw.- pipeline depth pipeline width
a: total number of instructions in event handler
r., average instruction slack
S': asynchronous handler setup time (in cycles) Ss: synchronous handler setup time (in cycles)
r': asynchronous handler restoration time (in cycles) r': synchronous handler restoration time (in cycles)
Synchronous Event Handling:
A
z -' 1 Ln B: MM. M.
,,Zs
Asynchronous Event Handling:
AL
eventthread rj '13 instr. cnt.
Figure 3: Timelines for the analytical models of synchronous and asynchronous event handling. After executing n user code operations, the event is detected by hardware (marked by the vertical arrow). After detection. both handling methods incur a delay while the handler is setup. The handler then executes a total of a operations. Again, both handling methods incur a delay -- this time to return from the handler. Finally, in the synchronous method, all of the instructions which were in flight when the event was detected, and had to be cancelled, are re-issued.
In the synchronous model, the total event handling time is the time to handle each event (the time after the vertical arrow) multiplied by iln number of events. Since the net pipeline width is w, each of the instruction counts (n and a) is divided by w. The latencies are in cycles and do not have to be scaled. Similarly, the total execution time for the program is the time to execute n instructions of user code and handle one event, all of which is multiplied by Vn (the number of times this sequence occurs). The percentage overhead for synchronous event handling,
Analytical Models
denoted synch, IS SIM. . ply the quotient of the time spent in only event handling to the total program execution time:
m(a +S S+ dw n w_ W) Osynch = - -- X 100 (EQ 1) m a n + ss + r + dw) n W W W a+ ss+r)w+dw X 100
n+a+ ss+rs)w+dw
The equation for percentage overhead in asynchronous event handling is simi-lar to (EQ 1) except that the handler and instruction slack execution times may overlap. Only if there is insufficient instruction slack does user code get halted. Otherwise, user code is not stalled and the overhead is zero. As in (EQ 1), we must scale all of the instruction counts (it, a and r) by the pipeline width, w. (EQ 2 pre-sents the equation for the percentage of time user code is stalled because of asyn-chronous event handling. The max function disallows negative event handling overhead in the cases where the instruction slack, r, is larger than what is needed to mask the handler execution time.
m X Ma'(0' S. ra + a r n + r W W 0, X 100 (EO 2) synch m (n a)
-
-
+r +_
n+r wSa a W max (0, ( (sa + r w a - r)) X 100 n+ (Sa+ra)w+aFigures 4a and b show plots of Equations (EQ 1) and (EQ 2 as a function of the number of user code instructions between events, and instruction slack. The other variables are assigned the following average values:
d 8 pipeline stages
• 5 functional units
a 400 operations
• ss+rs 100 cycles
• sa+ra 8 cycles.
It is clear from the figure that synchronous event handling incurs a substantial cost for programs with a high event frequency. The largest part of the cost stems from the handler overhead, which in synchronous handling may be orders of mag-nitude greater than that for asynchronous. In Figure 4c we assume that synchronous handling incurs the same low overhead as that of asynchronous handling. Although this lowers the cost by about fifteen percentage points, performance is still limited. This is because in the synchronous case, the faulting thread must be stalled while the handler runs. Figure 4d shows how serious the situation can become as the trend in increasing the number of instructions in flight (by expanding the pipeline depth and/or width) continues.
In the asynchronous case, the handler cost may actually be zero. If the amount of available instruction slack is such that the faulting tread does not have to be stalled, there is no cost associated with asynchronous event handling. If there exists too much slack, the extraneous user instructions are executed after the event han-dler returns and do not affect hanhan-dler performance.
The past few years have seen application and systems programs using events to manage routine and frequent tasks. For example, events are being used for software instruction set extension, software cache coherence protocols[2], and garbage col-lection[l]. The rise in event frequency requires fast, low overhead handling so as not to degrade program performance. Our discussion in this section has shown that asynchronous handling is more efficient than synchronous handling. However, the exact speedup depends on the available instruction slack.
Analytical Models
Figure 4: Plots of the percentage of time user code execution is stalled because of event handling. (a) and (b) show asynchronous and synchronous handling as a function of instruction slack and the number of operations between events. (c) depicts the situation where synchronous handling has the same setup and restoration latencies as that of asynchronous. (d) shows percentage of time user code execution is stalled in synchronous hand-ling as a function of the number of instructions that were in flight when the event was detected, and the number of operations between events.
I - r ;;;- 0 100 0 Slack (r) I" inn . R I '"pW 02000 I
Avg of Inst. bet Event ) 0 5(X) Inst. Slack (r) Avg 01 InSt. DetWeen Events (n
-(a) i 1; .1 9
d
Avg W ot nSL between Events tn)
(b) 100 R 80 i 60 5 40 1 0 120 0 0 P. ' 250 0 W) 8i(Z' - 40'AJ 1 1 10 10 1 o6d) #oflnst.inFlight(dw' Avg # of Inst. between Events (n) 'If Ing
(c) (d)
4.1 Instruction Slack
Sufficient instruction slack in a program is required to mask event handler latency. By overlapping the execution of low latency user code instructions with the execu-tion of the high latency event handler, we can effectively mask the total handler time and improve program performance. In this section we investigate the existence of instruction slack.
If we do not consider external events such as I/O device requests and program terminating events such as arithmetic exceptions, memory references are one of the largest sources of internal events, e.g. TB-miss events are commonplace in ost systems. However, adequate slack for memory references does not directly imply adequate slack for event handling. For example, servicing a cache miss in which there exists a TB translation incurs substantially less overhead than a cache iss with no translation entry. So, we must be careful to analyze theamount of available slack, and not merely the existence of slack for memory references.
Researchers have investigated the existence of slack for memory operations. Most of this work has been done in the context of compiler prefetching schemes. Prefetch is a method of retrieving data, which is not resident in cache, before it is actually needed so as to avoid a cache miss penalty[4]. The prefetch is usually initi-ated after the memory address has been computed, and the data is placed into cache before the memory operation queries the cache. Prefetch is only successful if while the data is being retrieved from main memory, other instructions can be run to mask the memory access latency. Clearly, the requirements to satisfy this condition are exactly the same as those to mask the latency of asynchronous event handling.
In 5], Selvidge analyzes the SPEC benchmark suite for the existence and amount of slack for memory operations. Since not all memory references result in a cache miss, he develops a model to speculate on which memory references are bad references (cause a cache miss) and which are good references (do not cause a cache miss). Using this model and dynamic dataflow graph analysis, Selvidge con-cludes that on average sufficient slack exists for bad references if code motion is allowed across basic blocks.
Selvidge quantifies the amount of slack by choosing various slack amounts and tallying the fraction of bad references around which that amount of slack exists. His data shows that nearly 100% of all bad references exhibit atleast 250 operations of
Analytical Models
slack, and most exhibit substantially more. The maximum slack amount Selvidge investigates is 512 operations. So, if the execution time of the event handler is less than the execution time for this number of operations, we may be able to com-pletely mask the handler time.
CHAPTER
In this chapter we discuss one implementation of asynchronous event handling. We begin by describing the overall system architecture of the machine, and then delve into the event subsystem.
5.1 Overview of the M-Machine
The M-Machine is an experimental multi-computer being developed to examine the trade-offs involved in devoting an approximately equal percentage of chip area to processing resources and to memory. It incorporates a collection of processing nodes which are interconnected by a bidirectional 3-D mesh network. Each node consists of a multi-ALU processor (MAP) chip and MegaBytes of memory. Each MAP is comprised of four clusters, 128 KiloBytes of cache, an external memory interface, and a network interface and router system[2].
The M-Machine is designed to extract and efficiently execute programs exhib-iting varying levels of parallelism. It uses a variant of the Processor Coupling
M-Machine Implementation map "I-OP SrACKSUARZ
m-OP
4
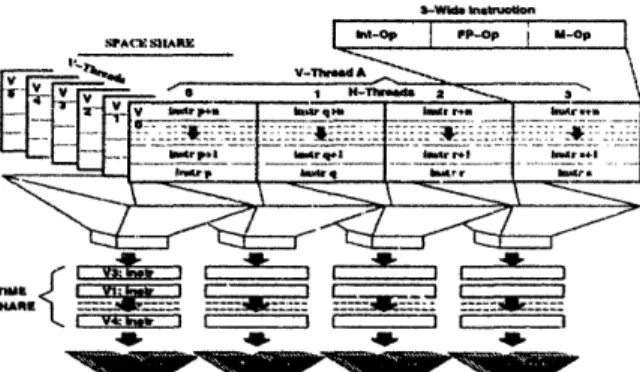
V - V-Thl-d A V.V V T.AK 4W 4W 406Figure 5: V-Thread and H-Thread organization of the M-Machine.
During each issue cycle, the dynamic scheduler on each of the four clusters chooses a HThread from the six possible V-Threads to issue. 'Me M-Machine's V- and HThread organization allows zero con-text-switching overhead.
inally described in 3] to organize and control up to four distinct user processes and two system processes on each node. In this framework, the compiler partitions and statically schedules a single instruction stream into four horizontal threads
(H-Threads) to be executed on each of the four clusters. In order to exploit instruction
level parallelism, each H-Thread is a VL1W instruction stream consisting of one integer operation, one memory operation and one floating-point operation) The M-Machine also defines vertical threads (V-Threads) which are a collection of four
H-Threads from the same process. Up to four user and two system V-H-Threads may
exist on a MAP at any time. At each issue cycle, a dynamic scheduler resident on each cluster of a MAP, chooses one H-7hread from the six possible V-Threads for execution. This organization takes advantage of process level parallelism and masks high latency instructions of one thread by executing instructions from other threads during the lag. Figure summarizes the situation.
It is important to notice that in the M-Machine, the system threads do not run on a separate execution unit from the user threads. Until now, our model of
chronous handlin- assumed two threads and two clusters. Given adequate instruc-tion slack, this allowed us to achieve zero handler cost. This is not possible in the M-Machine where different threads are interleaved over a common cluster. In this situation, we can never achieve zero cost, but we can lessen it by issuing user instructions during long latency handler operations. The M-Machine also provides significant hardware support to allow faster handling of events. We discuss this
next.
5.2 M-Machine Event Subsystem
In the M-Machine, when an event is detected, hardware creates an event packet and places it into an event queue. A dedicated event handler thread dequeues events from the queue and sequentially resolves them. The handler then completes the faulting instruction and stalls, ready to handle another event. In this section, we dis-cuss each of these phases in more detail.
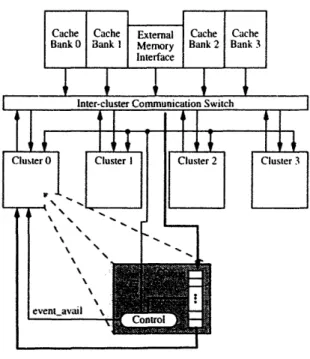
The event queue is physically located on cluster of the MAP. As shown in Figure 6 event packets can only be added to the queue by the inter-cluster commu-nication switch (C-switch), and they can only be delivered to the cluster execution pipeline. As the queue nears full capacity, the queue controller asks each of the clusters to stall all user threads so that no more events are generated. Only after the queue occupancy drops below a low watermark are user threads allowed to con-tinue.
A typical M-Machine event packet is shown in Figure 7 Each packet is at most four words and contains all of the information required to handle the event. The four lowest bits of the first word encode the event type. This field is used by the event handler to dequeue the appropriate number of words from the queue.
Fault-ing Operation reveals the operation which caused the event and contains such
M-Machine Implementation
Figure 6: The M-Machine's Event Queue Unit.
After an event is d,.ected. hardware creates an event packet and places it into the event queue via the Inter-cluster Communication Switch. The event queue unit informs the dynamic scheduled on cluster 0 that an event is available for handling. The dynamic scheduled then issues the event handier thread which reads the event packet from the queue. The event queue unit asserts the stall signal to notify the clusters. that the queue is neafing full capacity. The clusters are responsible for stalling user code so that no more events are generated.
the packet is a memory address for events which are caused by a memory reference. For example, this may be the target memory address for a store operation which TLB-missed. Operation Data is used by instructions which manipulate data. This may be the value to write into memory for a store instruction. The final word encodes the address for the memory-mapped target register for the operation.
As events are enqueued, cluster is notified of their availability. This immediately awakens the event handier resident on the cluster 0 H-Thread of the event V-Thread (one of the two system V-Threads). The handier removes the first word from the queue by simply accessing the register which is mapped to the front of the queue. After the event type is deciphered from the first word, the handier dequeues the
wordO: Faulfing Operation -F 5-t TYP,
word]: Memory Address
word2: Operation Data
wordI Mmory-Mapped-Register Address for Operation Target Register Figure 7 Typical M-Machine event packet.
The Faulting Operation field encodes ost of the original operation. Event 7pe is used by the handler to remove the appropriate number of words from the queue. The other fields are present only if they are needed to handle the event and complete the faulting operation.
remaining .words in the packet and starts to resolve the event.
Since all of the information required to handle the event is present in the event packet, the handler execution time is minimal. For example, a TB-miss handler simply uses the virtual memory address (second word of the event packet) to query the Page Table (PT), and makes a new virtual-to-physical translation entry in the TLB. The handler then completes the faulting operation and, if needed, writes the result into the memory-mapped-register address contained in the last word of the event packet. If we assume the faulting operation is a load, this means the handler fetches the requested data from memory and writes it into the target register. If there are no more events in the queue, the handler thread sleeps.
CHAPTER 6
In this chapter we evaluate the M-Machine's event handling subsystem on a num-ber of criteria.
6.1 Event Frequency
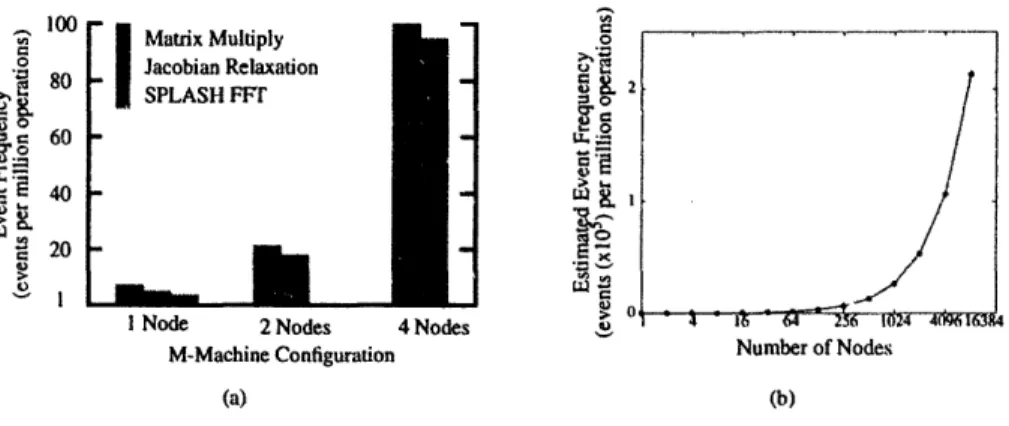
The M-Machine's distributed, shared memory and cache-coherence protocol pro-duce events frequently. Figure 8a shows event frequencies for three benchmarks running on various configurations of the M-Machine. It is clear that event fre-quency does not scale linearly with node count. In the single node configuration, TLB-miss events are the most prevalent. As more nodes are utilized by a program, the need for node-to-node communication and cache-coherence drastically propels the event frequency upwards.
Figure 8b shows an estimate of event frequency as a function of the number of M-Machine nodes used. The plot assumes a linear relationship between node count and event frequency. Since the plot shows a constant marginal increase in
M-Machine Experiments ---- WU .I 0 W 80 >1 0 = r- 0 60 9 40
t
2L - 20 lu S I I Node 2 Nodes E .2 >1 Vr. &
0 2 = C> T s LL. = 6 4) ' K I 'gc g E! _Z 1M W 0 -%) -0 M 16394 I 1 It 8 104M-Machine Configuration Number of Nodes (b)
Figure 8: Event Frequency Statistics.
(a) Event frequencies for various programs on three different configurations of the M-Machine. (b A conservative estimate of event frequency a a function of the number of M-Machine nodes used.
quency. it is a very conservative estimate. The rise in inter-node communication may increase the event frequency per node linearly, but the aggregate frequency may increase exponentially. Nonetheless, the plot shows a very high event fre-quency. For the M-Machine, which is theoretically scalable to 64,000 nodes, the ability to resolve events quickly and efficiently is a necessity.
6.2 Handier Latency
Although the presence of adequate instruction slack may lower the cost of asyn-chronous event handling, program performance will nonetheless be limited by the actual number of cycles needed to handle an event. As we saw in Chapter 4 this cycle count is simply the sum of:
• the number of cycles required to start the event handier after the event is detected by hardware,
• the number of cycles spent in the handier, and • the number of cycles to return from the handler.
Table I shows the number of cycles needed to resolve an event on the M-Machine. The data is based on an off-node memory write in which the remote block is
resi-dent in the local cache but the local node does not have write permission. This event is detected by the local cache and is called a block-status miss (BSM). The data presented in Table I assume that all memory references in the handier cache hit. If the event frequency is high, this is a reasonable assumption.
While the faulting operation is in the pipeline, it tries to execute a write to the memory block in the cache. The cache recognizes that the local node does not have write permission on that block and signals an event. The event is detected only 3 cycles after the operation was in the execute (EX) stage of the pipeline. Hardware creates an event packet and places it into the event queue within 3 more cycles. Assuming that the queue is empty, an event available signal is asserted by the queue I cycle later. As soon as the queue asserts that an event is available, the event han-dier thread is issued by the dynamic scheduler. The handler dequeues packets by simply referencing the general-purpose register which is mapped to the front of the queue. The handier thread is able to execute immediately after a packet is placed into the queue because the handier merely stalls when no events are present; there is no need for scheduling the thread when an event is infact available.
Thirty cycles after the first word of the event packet is removed from the queue, the first instruction of the BSM handler routine is issued. Most of these cycles are needed to reference a lookup table for the address of the BSM routine, and to setup the stack before the procedure call. We estimate that this cycle count can be reduced somewhat.
The cycle count for the BSM handler is misleadingly large currently due to the use of an experimental compiler on the M-Machine. We estimate that the compiler is generating approximately four times more code than necessary. The revised num-ber of cycles spent in the BSM handler routine is approximately 200. Finally, nine more cycles are needed to de-allocate the stack, return from the BSM handler rou-tine, and prepare to handle the next event (or stall, if none are available).
M-Machine Experiments
Cycle Description
0 Faulting operation in the EX pipeline stage. 3 Event detected by hardware.
6 Hardware enqueues first event packet. 7 Handler thread awakens,
Handler dequeues first word of event packet. 37 Handler setup completes,
BSM handler routine starts. 870 BSM handler routine finishes. 879 Handler finishes,
Handler stalls.
46 Round trip delivery of null handler. 833 Total BSM handler routine runtime.
879 Total event handler runtime.
Table 1: Relative number of cycles required for event handling on the M-Machine. Handler setup time includes the time to dequeue the event packet from the queue and to jump to the appropriate handler routine. The numbers shown are for a block-status miss (13SM) event. A BSM event is caused when the local node tries to modify a piece of remote data for which it does not have permission to do so. A BSM event is resolved by asking the home node of the data to give the local node permission to modify the data. The data also assumes that all memory references cache hit.
6.3 Instruction Slack with Multi-Threading
For asynchronous event handling to be effective, the instruction stream must exhibit considerable instruction slack. Although the compiler may, in some cases, be able to expand the slack, it will not be able to do so in all cases. And in the cases that it can lengthen the slack, it may not be able to expand it enough to obviate the need to halt the faulting thread.
Because the M-Machine multiplexes four different user H-Threads over each cluster it minimizes asynchronous event handling's dependence on instruction slack. Since there is no context-switch overhead, instructions from other threads (on that cluster) may be considered apart of the faulting thread's slack. The M-Machine's dynamic scheduler further decouples asynchronous event handling from instruction slack by its round-robin scheduling algorithm. If more than one user
Du 0 40 I ii User hread 1 User Thread I I I 6 U I 0 11 30j 0 = I .M0 20 M .Z, :3 10 I.-I i 7 User Thread 2 User Thread 3 Event Thread Thread Slot
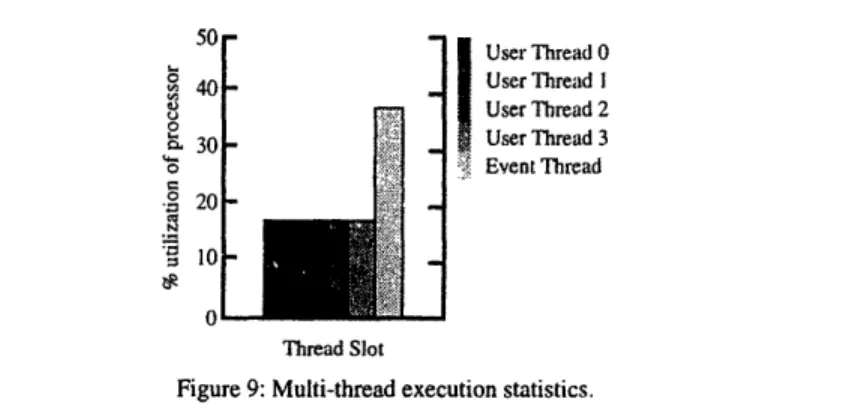
Figure 9 Multi-thread execution statistics.
Using multi-threading instead of instruction slack to mask operation latency while the event Landler runs. User thread is the faulting thread. The other user threads have infinite slack.
thread is ready to issue on a cycle, the scheduler gives equal preference to each thread. Thus, any long latency operations from the handler are masked by an equal number (if available) of instructions from each of the active user threads. This allows the cluster to be more fully utilized and increases throughput, although it may also increase latency for the faulting thread. If latency is an issue, the M-Machine allows setting priority levels for different user threads, e.g. a subset of the user threads may be set to have the same priority as the event thread.
Figure 9 shows the effectiveness of using multi-threading to mask operation latency while the event handler is running. The plot shows, as a percentage of the total number of event handler cycles, the number of cycles in which user code and handler instructions are issued. Of the 879 cycles the event handler took to execute, only about 36% were spent in issuing handler instructions and the remaining 64% were spent in issuing user instructions (evenly spread over the four user threads) to mask long latency handler operations. The figure assumes that the faulting thread has sufficient instruction slack and that three other user threads are also running. With these assumptions, the processor reaches 100 percent utilization. That is, an instruction is issued on each cycle.
M-Machine Experiments ' UU 100 ' 90 90 80 80 ,I, -- . --2.. ,,, 2.6 0 2 lu -60 - R '/U'> 77M -Q 60 - Z. , 50 - - .2 50 -8 - 12 '= 40 -0 1840 -N 30 - - * 30 -Z 20 20 -* lo
-
I
10 -. 2.4 bb i c22 >' .0 2 r: 72 Ila 'R.c > :3 4 1A 8 1.4 . i .( - M 7 fisca - 0 t M - vf"A (6gal
'2
M -Awnchranous vent 4andlinp- ____ .. .1 . .. 3 .4 03 .. .I O.. .4
Synchronous Event Handling Fraction of instructions executed that are event handier instructions.
(a) (b)
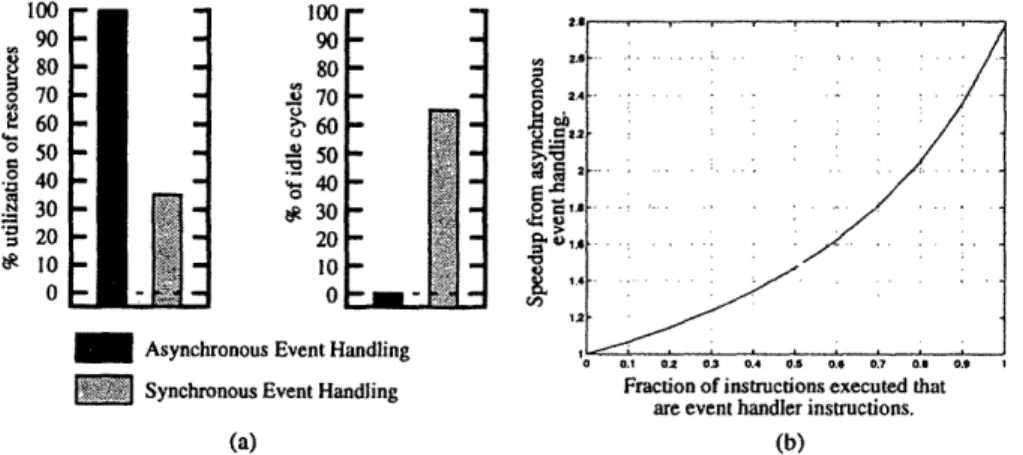
Figure 0: Speedup from asynchronous event handling over synchronous event handling. The graphs in (a) show that the event handler code does not exhibit enough parallelism to mask many of the long latency operations. This results in 64% idle time for synchronous event handling. In asyn-chronous event handling, since user code runs in parallel with the handler, user instructions can be used to mask long latency handler instructions, thus achieving a % idle time. The plot in (b) show, the program speedup fi-om asynchronous handling over synchronous handling, as event frequency increases (and the handier runs more often).
6.4 Synchronous Event Handling
The last section showed that by concurrently executing user code instructions with event handler
instructions
increases te efficiency of program execution. This was because the event handier instructions lacked adequate parallelism to mask long latency handler instructions. If the user code has enough instruction slack, user code instructions can be executed in between long latency handler instructions so that an instruction is issued in each cycle.Multiplexing user and handler instructions are not permitted with synchronous event handling. This restriction disallows filling long latency instruction slots while the handler is running, and lowers the efficiency and performance of synchronous handling. The graphs in Figure IOA show that while the handler is running, asyn-chronous handling is potentially able to issue an instruction on each cycle and achieves 100% utilization of resources and 0% idle cycles. Conversely,
synchro-nous event handling is not able to issue an instruction on every cycle and achieves only 36% utilization of resources and 64% idle cycle.
Figure 10b uses Amdahl's aw to plot the speedup from asynchronous event handling over synchronous event handling. The following modified version of Amdahl's Law is used:
speedupoveall (EO 3)
FractionAsynch
(I -Fraction
Mynch) +-SpeedUPAynch
Figure 10a shows that with asynchronous event handling only 36% of the total event handling cycles are spent issuing handier instructions. Since synchronous handling spends all of the total handler cycles issuing handler instructions (or wait-ing for previous instructions to complete), the speedup achieved by asynchronous
I
handling over synchronous handling is: SpeedupAYc = 036 = 278. The fraction
of the overall program which can benefit from this speedup is merely the fraction of event handler instructions to the total number of instructions in the program. Figure 10b varies the Fractioynch variable from 0.0 to .O. The overall speedup varies from a minimum of zero to a maximum of 2.78. It is important to note that the data presented in Figure 10b is conservative since it does not take into account the addi-tional overhead that synchronous handling incurs from context switching and from flushing the pipeline.
6.5 User Level Event Handling
The ability to detect the occurrence of a special situation in hardware and quickly run an user level routine is an useful one. Chapter 3 discussed using user level events for fast garbage collection and software instruction set extension. The
pri-M-Machine Experiments
mary concern of user level event handling is one of security. A single, faulty user level event handier routine can potentially deadlock the entire machine, and affect all other users.
The M-Machine can provide user level event handling with very minor modifi-cations to its runtime system. Currently, the event handler references a software lookup table to locate the address of the appropriate handler routine. By simply adding the ability for user threads to modify this table, the M-Machine can provide user level event handling. User level handling will marginally increase the handier overhead by approximately two cycles. With the M-Machine's target clock speed of IOOMHz, we expect it will provide the fastest user level event handling of any modern system that we know of.
CHAPTER 7
Conclusion
Events are increasingly being used to optimize application program and runtime system erformance. Fast events are important not only for parallel and distributed processors in which inter-node communication and thread synchronization are common, but also for more traditional processors where TB-misses and system calls must be resolved quickly. Unfortunately, although systems are utilizing events more frequently, they have not optimized handler performance. The situation only worsens as user level events become more common.
This thesis examined event handling mechanisms and their relationship to pro-gram performance. We introduced event handling models and sowed the substan-tial overhead and cost of synchronous handling. More importantly, we demonstrated the degradation of performance for programs running on machines which use synchronous handling, as event frequency increases. To address these deficiencies, we presented asynchronous event handling, which services events on a separate thread in parallel with the faulting thread.
Conclusion
handling. Its dedicated event thread and extensive hardware support for events pro-vide low overhead and low cost event handling, without the inflexibility and chip area trade-offs of purely hardware implementations. To the best of our knowledge, we expect that the M-Machine will provide the fastest general event handling per-formance of any modern system.
APPENDIX A
The Event Queue (EQ) Unit serves to buffer all events (except local TLB misses) in the MAP chip. It is logically located in cluster 0 but is physically located between the first and second clusters. Figure I I shows the EQ within the MAP chip. As events are placed into the EQ, they are resolved serially by the event handler run-ning in the Event Thread Slot on cluster 0.
A.1 Operation of the Event Queue Unit
Events are exceptions which occur outside of the MAP cluster. Block-status misses and memory-synchronizing faults are examples of Machine events. The M-Machine provides a dedicated event handler which pops events from the EQ and services them by concurrently multiplexing the handler code with non-event-dependent user code. This method results in low-overhead, fast event handling since it obviates the need to nullify instructions already in the pipeline and may not require halting user code execution.
The EQ accepts event packets from the C-Switch via burst-mode transfer and buffers them in a IFO to be read out by the event handier. Each word is maintained within the FO until an explicit pop pulse is given by the SZ stage to signal that the word has been read. Attempts to execute a pop when the FIFO is empty are ignored by the EQ. If the EX pipeline stage does not consume the event word on that cycle it can have the word restored to the queue by asserting the undo signal. undo must be asserted before the falling-edge of the cycle immediately following the cycle in which pop was asserted.
When te number of words in the FIFO reaches a high watermark, the SZ External
Memory
--- --
---t I t i
Cache Cache Memory Cache Cache Bank Bank Interface Bank 2 Bank
T
M-Switch
C.-Switch
luster 0 Cluster I Cluster 2 C I
Network
Output Input
MAP ch
---
---Ne
Figure I : The Event Queue Unit within the Multi-ALU Processor chip.
The controller module is located in cluster whereas the FIFO queue itself is located between clusters 0 and 3.
stage on each cluster is notified. The EQ then relies on the SZ stage to stall all user threads, so that no more events are generated, until more vacancy becomes avail-able in the FIFO. This guarantees that the event queue is avail-able to absorb all events outstanding in the system at any time.
Event packets may be sent by the External Memory Interface (EMI) and by the Configuration Space Controller. It is important to note that there is no explicit arbi-tration for enqueuing entries into the EQ. Since an event may only be added to the EQ through the C-Switch and since only one writer may access a given C-Switch target at any time, all requests to write to the EQ are serialized at the C-Switch.
A.2 Event Queue Unit Interface
The event queue unit communicates with the C-Switch, the SZ stage of all clusters, and the SZ/EX stage of cluster 0, as shown in Figure 12. The signals shown carry the following meanings:
Interface with the C-Switch
csw-data-vi: C-switch data packet.The following signals are contained within this packet.
- csw-tsiot: The destination thread slot must be 6 for the EQ to accept packets.
- c sw-x f r-type: This value must be set to Queue to trigger the EQ into accepting a burst-mode event packet from the C-Switch.
- csw-dav: The data available signal from the C-Switch.
Interface with the SZ pipeline stage
• event-av-vi: Asserted by the EQ when an event packet is available. It also implies that the qdata lines (leading to the EX stage) will carry a valid word before the next rising clock edge.
• wmark-2: Asserted by the EQ unit when the occupancy in the EQ buffer reaches a high watermark. When this line is asserted, the SZ stage must not issue any operations that may cause a new event.
'NEW IR W""M 5,,A -,_ : , ! "I , - Control , 1 11 I watermark 4 -M rlsize
pop__y2 A pulse asserted by the SZ pipeline stage when it has read the value from the front of the EQ.
Interface with the EX pipeline stage
• qdata-v2: Carries the data word from the front of the EQ buffer.
• undo-vi: Asserted by the EX stage to signal that the last event word was not consumed and that it should be restored to the front of the queue.
The expected handshake sequences are ilustrated in Figure 13.
A.3 Architecture of the Event Queue Unit
As is shown in Figure 15, the EQ is comprised of two main blocks -- a FIFO queue and a controller. The next two sections describe the datapath and control for the EQ in more detail. A a I 101 _X 9 . I III
-1
_ __j II CLt 0 Cist I Cls;t 2 Clst 3 Szl Sz Sz Sz undo gdata b EXFigure 12: Top-level diagram of the MAP Event Queue (EQ) Unit.
The EQ communicates with the C-Switch, EX pipeline stage of cluster 0, and SZ pipeline stage of all the clusters.
pl_M
_f
---M D M8Zb_____d=N
fflawb 11 I I I I I- II
F____1 F_____1 F_____1 F-____1 II i i .1k -- j-R_ ,L) ff-, -) --7- ___r_- 11
' ___T_ I I / I 1-1 .1 4 W.Idf- Th. - -d i. - -ftbf. .Figure 13: Handshake signals for reading from the Event Queue Unit.
Data from the C-Switch output port is presented to the EQ before the falling edge of the clock. The data is written into the FIFO at the rising edge of the clock, and the event available signal is asserted immediately thereafter. The first word is popped and consumed. The second word, however, is popped but it is not consumed. This word is restored to the FIFO, and is again popped a cycle lter.
Event Queue Datapath
The EQ FO is simply a 192 entry, I-read port/1-write port register file. Each entry consists of 65 bits of data and I memory synchronization bit. One-hot encod-ing is used for both the read and write addresses. Reads from the register file are combinational -- the data is placed onto the output bus a time delay after the read address is given. Writes, however, are synchronized with the rising edge of the clock. Data is written into the FIFO during the high period of every cycle. If no data is to be written, a null address (all zeroes) must be given. Figure 14 shows the EQ datapath interface.
Event Queue Control
The EQ control unit is composed of four submodules. These four control subrnod-ules, together with the EQ datapath, are shown in Figure 15. The MAINCONTROL submodule generates the event-av signal based on the current C-Switch packet
and from the contents of the FIFO. The QCOUNT subrnodule simply maintains the number of event words in the FIFO and asserts the wmark signal when the count
exceeds that of the
watermark register.The
PROGREG submodule contains theclk -A,4 A-MM T -
FE.
4 I-- I ___ read addr data-Out data-inFigure, 14: Event Queue Datapath Interface
Reads from the EQ Register F le are combinational -- a time delay after presenting the I -hot encoded read-addr, the data_out contains the data word from the FIFO queue. Writes. how-ever, are synchronous. The data in the data-in bus is written into te register file location pointed to by the I -hot encoded write-addr at the rising edge of clk. If no data is to be written into the queue, write-addr must contain a null address. Both the read and write addresses are changed, if necessary, by the EQ control unit at the falling edge of c 1 k.
nal, while qsize is used for FIFO queue wrap-around calculations. The water-mark register is programmable via the diag-chain, whereas the asize register is hard-wired and is not changeable.The REGCONTROL subrnodule maintains the
-I"I .9 E 9 -I 2 . I I .f rr.,Yad4
Figure 15: Top-level architecture of the MAP Event Queue Unit.
The dotted lines demarcate the datapath and control portions. The control portion also shows the four submodules contained within it.
45 -8 _W '00 '103 U N -. .C ' rl '. I I : . .:tv" aa in . , t .
.- 'Aje
I . I . . r. . . Ii=7 0 Z.R I-- . ,R... -I -Iread and write addresses, encodes them into a one-hot address, and passes them onto the register file.
I I ELLIS, J.R., LI, K., AND APPEL, A.W. Real-time Concurrent Collection on Stock Multiprocessors. Research Report 25, DEC Systems Research Center, 1988.
[2]FILLO, M., KECKLER, S. W., DALLY, W. J., CARTER, N. P., CHANG, A., GUREVICH, Y., AND LEE, W. S. The
M-Machine Multicomputer. In Proceedings of the 28th Annual International Symposium on Microarchitecture 1995), IEEE, pp. 146-156.
[3]KECKLER, S.W. AND DALLY, W.J. Processor Coupling: Integrating Compile Time and Runtime Scheduling for Parallelism. In Proceedings of the 19th Annual International Symposium on Computer Architecture (I 992), ACM, pp.
202-213.
[41AGARWAL, R.C., GUSTAVSON, F.G., AND ZUBAIR, M. Improving Performance of Linear Algebra Algorithms for Dense Matrices Using Prefetch. Technical Report 1871 1, IBM Research Center, 1993,
[51SELVIDGE, C.W. Compilation-Based Prefetching For Memory Latency Tolerance. Technical Report, MIT Laboratory for Computer Science, 1992.
[6]PowerPC 604, RISC Microprocessor User's Mmiual. Rev. I MPC604`UM/AD (Motorola Order Number) and
MPR604UMU-01 (IBM order number).
[71DALLY, W.J., FISKE, J.A., KEEN, JS., LETHIN, R.A. NOAKES, M.D., NUTH, P.R., DAVISON, R.E., AND FYLER, G.A. The Message-Driven Processor: A Multicomputer Processing Node with Efficient Mechanisms. IEEE Micro, Vol. 12,
No. 2 April 1992, pp. 23-39.
[8]ALVERSON, R., CALLAHAN, D., CUMMINGS, D., KOBLENZ, B., PORTERFIELD, A., AND SMITH, B. The Tera Computer System. International Conference on Supercomputing (I 990), pp 16.
[9]THEKKATH, C.A AND LEVY, H.M. Hardware and Software Support for Efficient Exception Handling. In Proceedings
of the 6th International Conference on Architectural Supportfor Programming Languages and Operating Systems (I 994),
ACM, pp. II 0- 19.
I 01OUSTERHOUT, J.K. Why Aren't Operating Systems Getting Faster As Fast As Hardware? In Proceedings of the Summer