HAL Id: hal-01268290
https://hal.archives-ouvertes.fr/hal-01268290
Submitted on 26 Apr 2019
HAL is a multi-disciplinary open access
archive for the deposit and dissemination of
sci-entific research documents, whether they are
pub-lished or not. The documents may come from
teaching and research institutions in France or
abroad, or from public or private research centers.
L’archive ouverte pluridisciplinaire HAL, est
destinée au dépôt et à la diffusion de documents
scientifiques de niveau recherche, publiés ou non,
émanant des établissements d’enseignement et de
recherche français ou étrangers, des laboratoires
publics ou privés.
Food powders: Surface and form characterization
revisited
Ingrid Murrieta-Pazos, C. Gaiani, Laurence Galet, Rachel Calvet, Bernard
Cuq, J. Scher
To cite this version:
Ingrid Murrieta-Pazos, C. Gaiani, Laurence Galet, Rachel Calvet, Bernard Cuq, et al.. Food powders:
Surface and form characterization revisited: Review. Journal of Food Engineering, Elsevier, 2012, 112
(1-2), pp.1 - 21. �10.1016/j.jfoodeng.2012.03.002�. �hal-01268290�
Food powders: Surface and form characterization revisited
I. Murrieta-Pazos
a,b, C. Gaiani
a,⇑, L. Galet
b, R. Calvet
b, B. Cuq
c, J. Scher
a aUniversité de Lorraine, LIBio, 2 Avenue de la forêt de Haye, B.P. 172, 54505 Vandœuvre-lès-Nancy, FrancebUniversité de Toulouse, Mines Albi, Centre RAPSODEE, CNRS, UMR 5302, Campus Jarlard, 81013 Albi Cedex 09, France
cMontpellier SupAgro INRA, UMR 1208 Unit for Emerging Technology and Polymer Engineering, 2, Place Viala, 34060 Montpellier Cedex 1, France
Keywords: Food powders Surface characterization XPS AFM ICG Functional properties
a b s t r a c t
The amount of interesting methods that allow surface characterisation of food powders, both those recently used and in development, are growing. Until now, a major problem facing researchers and man-ufacturers was the lack of a central source of information to provide practical knowledge focused only on food powder surfaces and form. The first goal of this review is to present recent and innovating method-ologies used to characterize the surface and form of various food powders. In addition, relationships between food powders surfaces (surface energy, composition, structure, etc.) as well as form and func-tional properties (wettability, caking, flowability, etc.) are highlighted.
Contents
1. Introduction . . . 2
2. X-ray photoelectron spectroscopy (XPS). . . 2
2.1. Use of XPS in the dairy powder field . . . 2
2.1.1. Reconstitution properties. . . 5
2.1.2. Caking phenomena . . . 7
2.1.3. Lipids oxidation . . . 7
2.1.4. Flowability . . . 7
2.2. Use of XPS for non-dairy food powders . . . 7
2.3. Interesting complementary technique . . . 8
3. Microscopy techniques making surface characterization possible . . . 10
3.1. Electron microscopy techniques. . . 10
3.1.1. Classical SEM characterization. . . 10
3.1.2. Interesting complementary methods . . . 10
3.2. Atomic force microscopy (AFM) . . . 11
3.3. Transmission electron microscopy (TEM) . . . 12
3.4. Confocal laser scanning microscopy (CLSM) . . . 12
4. Laser diffraction and dynamic image analysis . . . 13
5. Dynamic vapor sorption (DVS) . . . 13
6. Surface chemical extraction techniques . . . 14
7. Inverse gas chromatography (IGC) . . . 15
7.1. IGC and moisture adsorption isotherms to investigate interactions between humidity and food components . . . 15
7.2. IGC a technique used to study surface amorphous content . . . 16
⇑ Corresponding author. Tel.: +33 (0) 383595877; fax: +33 (0) 383595804. E-mail address:[email protected](C. Gaiani).
7.3. IGC to investigate interactions between flavor compounds and food components . . . 17
7.4. IGC to assess the modifications of surfaces after coating by emulsifiers. . . 18
8. Conclusion and perspectives . . . 18
Acknowledgments . . . 19
References . . . 19
1. Introduction
These last 10 years, a lot of food products have been devel-oped and commercialized in a powdered form. As a consequence, a new branch of science and engineering may be identified. Such discipline deals with the integration of fundamental scientific fields (process engineering, particle engineering, surface physics and chemistry, physico-chemistry) within some applied scien-tific fields (food biochemistry, food technology, functional properties, and food quality) (Cuq et al., 2011; Ortega-Rivas, 2009).
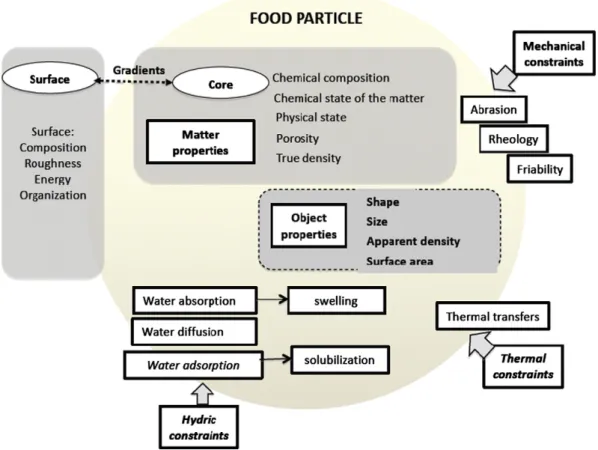
For the food industry, the interest with powder forms is mainly linked to their stability (chemical and microbiological), to the reduced transport costs and general convenience. In indus-try powders can be considered as end products (sugar, salt, coffee, spices, dried milk. . .) and also as intermediate products between several industries; for example, those producing pow-ders and alternatively those using powpow-ders as ingredients for food products (fruits, starch, eggs, milk, cereals, etc.). For consum-ers, quick and complete reconstitution of these products is one of the main quality indicators (Forny et al., 2011). Food powders represent a large variety of powder materials that differ in their chemical composition and physical characteristics. Sources of food powders are as diverse as food in general (Fig. 1), therefore differences in forms, structures, composition and behaviors of food powders can be better understood by knowing powders’ ori-gins (Cuq et al., 2011). It is important to remark that powders can also be a mix of ingredients making its composition and study more complex.
However, scientific and technical descriptions of the food powder properties remain incomplete. It is known that the characteristics and the properties of the particles (and more particularly the surface properties) play a central role in the mechanisms involved during powders production (milling, spray drying, or crystallization), and use (storage, flow, agglom-eration, dispersion, solubilisation. . .). Until now, the properties of food powders are classically described using bulk parame-ters. Nevertheless, it is being recognized that the functional properties of food powders are largely dependent of the surface composition and surface characteristics of the particles (Gaiani et al., 2006; Kim et al., 2002; Millqvist-Fureby et al., 2001). This is one of the reasons why several powder properties may be explained by a better knowledge and characterization of parti-cle surfaces and physical and/or chemical interactions among them and their environment (Gaiani, 2006; Kim, 2008). The characteristics of the particle surface may depend on different factors: bulk composition, operating conditions and storage conditions (Fig. 2).
Powder surface investigation requires very precise and elabo-rate techniques. Until now few investigations have been applied to food powder surfaces. Consequently research is still limited and this is the reason why the development of new surface charac-terization techniques may be an extensive field to exploit with considerable interest to the food industry.
This review is going to highlight the experimental techniques that enable the characterization of food powders surfaces and, when it is reported, to connect this information with their func-tional properties.
2. X-ray photoelectron spectroscopy (XPS)
XPS1 (also called ESCA or electron spectroscopy for chemical
analysis) is an analytical technique widely used in surface analysis (Briggs, 1994; Rouxhet and Genet, 2011). It provides elemental and chemical state data from the first nanometers of the surface of solid samples. The sample is placed in an ultra high vacuum and irradiated with photons from a soft X-ray source with a well defined energy. The method is based on surface irradiation which causes a complete transfer of photon energy to atomic electrons (Bosquillon et al., 2004). When the electron binding energy (Eb) is lower than the pho-ton energy (ht), the electron is emitted from the atom with a kinetic energy (Ek) equal to the difference between the photon energy and the binding energy, minus the spectrometer work function U:
Ek¼ h
t
" Eb"U
ð1ÞBecause XPS is an ultra high vacuum technique (10"8kPa), it may presents limitations for food with water present, but not for pow-dered food (James and Smith, 2009).
2.1. Use of XPS in the dairy powder field
The first developments using this equipment in the field of dairy powders were done byFäldt (1995). Then, the use of XPS was reg-ularly reported for the determination of the surface composition of dairy powders (Kim et al., 2002, 2009a–c; Gaiani et al., 2006, 2007; Gaiani et al., 2010, 2011a; Fureby et al., 2001; Millqvist-Fureby and Smith, 2007; Shrestha et al., 2007) and sugar mixed with dairy proteins powders (Jayasundera et al., 2010, 2011a–c) at an elemental level. From the C, O and N percentages, surface contents in protein, lactose and lipids were calculated with a ma-trix formula where the elemental composition in the sample is as-sumed to be a linear combination of pure components making up the sample (Kim et al., 2002; Gaiani et al., 2006; Jayasundera et al., 2009). Milk powders are generally composed of lipids, pro-teins and lactose but also vitamins and traces of mineral elements. By using the precedent matrix, only lactose, lipids and proteins were taken into account; other components were neglected (Fäldt, 1995; Gaiani et al., 2006; Kim, 2008).
One of the most important results obtained with this technique concerned the over-representation of some components at the powder surface in comparison with the bulk composition ( Shres-tha et al., 2007; Kim et al., 2002; Gaiani et al., 2006; Vignolles et al., 2009). Lipids and proteins (surface active components) were systematically found over-represented at the surface whereas lac-tose was less represented (Tables 1a, 1b and 1c). Indeed, when fat is present in the formulation, even in very low quantity, for
1Abbreviations: AFM, atomic force microscopy; CLSM, confocal laser scanning
microscopy; PL, phospholipids; CP, cream powder; DSC, differential scanning calorimetry; DVS, dynamic vapor sorption; EDX, energy dispersive X-ray spectros-copy; ESCA, electron spectroscopy for chemical analysis; GAB, Guggenheim–Ander-son–Boer; HPLC, high performance liquid chromatography; GC, gas chromatography; IGC, inverse gas chromatography; MPC, milk proteins concentrate; NMC, native micellar casein; NL, neutral lipids; NWI, native whey isolate; RH, relative humidity; SEM, scanning electron microscopy; SMP, skim milk powder; SMPG, skim milk powder granulated; SPI, soy protein isolate; TEM, transmission electron microscopy; ToF-SIMS, time of flight secondary ion mass spectrometry; WMP, whole milk powder; WMPG, whole milk powder granulated; XPS, X-ray photoelectron spectroscopy.
example the skim milk powder, the fat is still present at the sur-face. Alternatively, protein will govern the surface in absence of lipids or share the surface with the fat present. Nevertheless, the lipids cover the majority of the surface in the presence of both components. Finally, lactose was observed in the interior of the particle after free fat extraction (Table 1c).
This tendency to observe an overrepresentation of the lipids and then the proteins at the surface, is observed at all production scales, independent of the production conditions. Results for labo-ratory (Table 1a), pilot (Table 1b) and industrial (Table 1c) dryers are shown confirming this tendency.
Fig. 2. Factors affecting the powder surfaces properties.
Fruits and vegetables Cereals and leguminous Herbs, Flowers, Dairy Meat Eggs Mushrooms Salts Vegetal Animal Fungus Inorganic Principal raw materials origins Principal production Principal food powders
Flavors, Fruit powders, colorants, starches, tea, additives,
endulcorants, flours, Dairy powders, egg powder, meat powder,
Separation, Comminution, Aglomeration/Granulation,
Cristallisation/Prescipitation + drying, Mixing,
Minerals Yeasts
In laboratory conditions (Table 1a),Nijdam and Langrish (2006)
studied 2 drying temperatures and 6 formulations, mixing whole milk powder (WMP) and skim milk powder (SMP) in order to change the lipid concentration. A small change in the average fat content results in a large change in the surface fat coverage, how-ever, the surface fat coverage is less affected by increases in the average fat content at higher fat concentrations. Higher tempera-ture resulted in larger fat and lactose cover. Nevertheless, the
aug-mentation of lactose at the surface does not correspond to the protein-lactose proportion in bulk composition. Authors postulate that at lower drying temperatures, protein has more time to mi-grate to the surface of the droplet before sufficient moisture is evaporated to form a skin. Similar results in terms of lactose-pro-tein surface composition where observed by Shrestha et al. (2007)who studied powders conformed by mixtures of SMP and lactose. LaterKim et al. (2009c)studied 3 solid concentrations in
Table 1a
Bulk composition and surface composition obtained from XPS and linear equation relating elemental components to lactose, protein and fat in milk powders and milk sub-product powders obtained from lab scale spray dryers.
Powder system Feed solids (%)
Number of homogenization passes
Tin/Tout(!C) % Of surface
lactose (bulk)
% Of surface proteins (bulk) % Of surface fat (bulk)
References
WMP-SMP 1.1% fat 41.2 – 120/80 41*(59.6) 51*(39.3) 8*(1.1) Nijdam and Langrish (2006)
WMP-SMP 1.8% fat 41.2 – 120/80 35*(59.2) 45*(39.0) 20*(1.8) WMP-SMP 3.4% fat 41.2 – 120/80 31*(58.3) 38*(38.4) 31*(3.4) WMP-SMP 6.7% fat 41.2 – 120/80 29*(56.3) 33*(37.0) 38*(6.7) WMP-SMP 14.0% fat 41.2 – 120/80 23*(52.1) 24*(33.9) 53*(14.0) WMP-SMP 29.8% fat 41.2 – 120/80 19*(43.0) 21*(27.3) 60*(29.8) WMP-SMP 1.1% fat 41.2 – 200/125 52*(59.6) 31*(39.3) 17*(1.1) WMP-SMP 1.8% fat 41.2 – 200/125 42*(59.2) 29*(39.0) 29*(1.8) WMP-SMP 3.4% fat 41.2 – 200/125 36*(58.3) 28*(38.4) 36*(3.4) WMP-SMP 6.7% fat 41.2 – 200/125 35*(56.3) 24*(37.0) 41*(6.7) WMP-SMP 14.0% fat 41.2 – 200/125 27*(52.1) 24*(33.9) 49*(14.0) WMP-SMP 29.8% fat 41.2 – 200/125 20*(43.0) 16*(27.3) 64*(29.8)
SMP:Lac (3:1) 35 – 180/80 29 (63) 61 (26) 10 (1) Shrestha et al. (2007
SMP:Lac (1:1) 35 – 180/80 31 (75) 58 (17) 11 (0.8) SMP:Lac (1:3) 35 – 180/80 39 (88) 57 (9) 5 (0.25) SMP 10 – 145/85 10*(51.0) 46*(36.0) 44*(1.0) Kim et al. (2009c) SMP 20 – 145/85 16*(51.0) 48*(36.0) 35*(1.0) SMP 30 – 145/85 51*(51.0) 24*(36.0) 25*(1.0) SMP 10 – 205/105 18*(51.0) 48*(36.0) 34*(1.0) SMP 20 – 205/105 22*(51.0) 50*(36.0) 28*(1.0) SMP 30 – 205/105 29*(51.0) 51*(36.0) 20*(1.0) WMP 10 6 145/85 0*(36.6) 3*(27.9) 97*(26.6) WMP 20 6 145/85 0*(36.6) 3*(27.9) 97*(26.6) WMP 30 6 145/85 0*(36.6) 3*(27.9) 97*(26.6) WMP 10 6 205/105 0*(36.6) 3*(27.9) 97*(26.6) WMP 20 6 205/105 0*(36.6) 3*(27.9) 97*(26.6) WMP 30 6 205/105 0*(36.6) 3*(27.9) 97*(26.6) WMP 10 2 145/85 0*(36.6) 2*(27.9) 98*(26.6) WMP 20 2 145/85 0*(36.6) 2*(27.9) 98*(26.6) WMP 30 2 145/85 0*(36.6) 2*(27.9) 98*(26.6) WMP 10 2 205/105 0*(36.6) 2*(27.9) 98*(26.6) WMP 20 2 205/105 0*(36.6) 2*(27.9) 98*(26.6) WMP 30 2 205/105 0*(36.6) 2*(27.9) 98*(26.6) NMC 15 – –/70 0.8 (0.2) 93.9 (87.3) 5.3 (0.3) Gaiani et al. (2010) NWI 15 – –/70 0.1 (0.5) 66.1 (91.9) 33.8 (0.4) NMC + Lac 15 – –/70 14.3 (26.6) 76.8 (63.1) 8.9 (Tra) NWI + Lac 15 – –/70 9.5 (28.5) 62.9 (64.4) 27.6 (0.5) NMC + NWI 15 – –/70 0.3 (0.3) 89.6 (88.8) 10.1 (Tra) NMC 15 – –/80 0.6 (0.1) 99.4 (86.4) 0.0 (0.8) NWI 15 – –/80 0.0 (0.6) 69.8 (92.2) 30.2 (0.3) NMC + La 15 – –/80 16.0 (26.6) 79.3 (62.0) 4.7 (0.7) NWI + Lac 15 – –/80 12.7 (28.9) 66.3 (65.7) 21.0 (T) NMC + NWI 15 – –/80 0.0 (0.6) 95.6 (86.1) 4.4 (T) NMC 15 – –/110 2.2 (0.1) 97.8 (86.7) 0.0 (0.5) NWI 15 – –/110 0.0 (0.8) 88.6 (92.2) 11.4 (T) NMC + Lac 15 – –/110 16.5 (26.7) 83.5 (62.7) 0.0 (T) NWI + Lac 15 – –/110 18.8 (28.5) 81.1 (66.1) 0.1 (T) NMC + NWI 15 – –/110 0.2 (0.6) 94.3 (89.1) 5.5 (T) NMC 15 – –/130 1.5 (0.4) 98.5 (87.6) 0.0 (0.5) NWI 15 – –/130 0.0 (1.3) 88.1 (92.3) 11.9 (0.6) NMC + Lac 15 – –/130 19.7 (27.9) 80.3 (63.2) 0.0 (T) NWI + Lac 15 – –/130 20.8 (29.3) 79.2 (65.6) 0.0 (0.5) NMC + NWI 15 – –/130 0.0 (0.5) 92.9 (86.8) 7.1 (T) NMC 15 – –/150 3.5 (0.3) 96.5 (86.5) 0.0 (0.3) NWI 15 – –/150 4.0 (0.7) 85.4 (91.6) 10.6 (0.4) NMC + Lac 15 – –/150 19.7 (25.6) 80.3 (63.3) 0.0 (T) NWI + Lac 15 – –/150 19.2 (26.6) 77.0 (67.8) 3.8 (T) NMC + NWI 15 – –/150 0.8 (0.5) 99.2 (88.7) 0.0 (0.6)
Lac, lactose; NMC, native micellar casein; NWI, native whey isolate; SMP, skim milk powder; Tin/Tout, inlet temperature/outlet temperature; T, Traces; WMP, whole milk
powder. ⁄
spray drying feed solutions, 2 drying temperatures for SMP and WMP and 2 homogenization passes for WMP. The author postu-lated that higher feed solids content would give rise to more vis-cous droplets, preventing the migration of components and redistribution at the surface. The authors goes onto describe now lactose concentration is stronger at higher temperatures, agreeing withNijdam and Langrish (2006)proposal that the fat surface con-centration is reduce by high temperatures in SMP and does not present an important influence in WMP. In addition any difference is noted with the increase of homogenization passes performed in WMP feeding solutions.Gaiani et al. (2010)observed an enrich-ment of the surface in lipids and proteins regardless of the spray-drying temperature (the powder was dried at 5 different outlet temperatures) or the formulation obtained by combinations of Na-tive micellar casein (NMC), NaNa-tive whey isolate (NWI) and lactose. Furthermore, lipids enrichment is stronger in powders containing NWI than NMC and higher temperatures increase the protein-lac-tose surface content and reduce the surface fat content.
At pilot scale (Table 1b),Gaiani et al. (2006)produced and ana-lyzed the surface of particles of NMC, and mixtures of NMC with protein ultrafiltrate or lactose, consequently surface particles was modified. The nature of the ingredient added was determinant in the surface modification. Later the same authors (Gaiani et al., 2007) studied the effect of storage in NMC powder at 20 and 50!C, stoked in two different package (standard or watertight bags), the storage time was 15, 30 and 60 days each sample. Re-sults revealed significant surface changes only after 60 days of storage, when powder is stocked in watertight bags. When pow-ders are stored in standard bags, changes are registered after 30 days of storage. These results suggest that powder conservation is possible before 30 days of storage or more time if they are stocked in watertight bags. Temperature did not demonstrate an effect in surface composition modification.
At industrial scale (Table 1c), it was observed the surface com-position of WMP, SMP, cream powder (CP) and whey protein con-centrate (WPC) (Kim et al., 2002, 2005b). Later, the same author (Kim et al., 2009b), determined the effect of storage (6 months) for these powders, a migration of fat to the surface was systemat-ically observed in all the powders. WMP, SMP and instant milk power (IMP), were collected in different points of the spray drying and fluidized bed processes (Kim et al., 2009a). Surface did not present strong changes in the structure according to the collection point, results suggest that surface characteristics are developed in drying and they are not modified in the subsequently steps.
Murri-eta-Pazos et al. (2012)compared the surface composition of WMP and SMP with the agglomerated milk powder versions: WMP gran-ulated (WMPG) and SMP grangran-ulated (SMPG). A similar composi-tion was observed between WMP and WMPG, the same effect was observed between SMP and SMPG. The agglomeration process consists in the addition of fine particles before the drying step, then the suspension of fines and milk is dried. The study demonstrates that this supplementary step does not change the surface compo-sition.Fyfe et al. (2011)studied the effect of storage in milk pro-teins concentrate (MPC) after 14, 30, 60 and 90 days at 25 and 40!C. The powders were stocked in recipients with relative humi-lities at 44%, 66% and 84%. No significant changes to the surface composition were observed.
Finally different solvents and treatments are applied to fatty dairy powders (WMP, WMPG, CP) in order to extract the surface free fat (Kim et al., 2002; Murrieta-Pazos et al., 2012). The effi-ciency of the technics can be observed after analysis of surface composition in ‘‘surface fat free’’ powders, then these powders were used to evaluate the evolution of functional properties.
Different mechanisms of powder surface formation were pro-posed and discussed from these results summarized inTables 1a, 1b and 1c, they all agrees with the formation of a fat surface, then the drying of the next layer forming a skin with a subsequently drying of the core.
Recently, this technique (surface composition by XPS) has been successfully applied to investigate links between particle surface chemical composition and particle functional properties.
2.1.1. Reconstitution properties
By comparing casein powders containing variable combinations of hygroscopic material (lactose and/or minerals), the presence of lactose at the powder surface calculated by the matrix model from XPS results, was found to improve the wetting properties (Gaiani et al., 2010). NMC was dried at 5 different temperatures. After addition of 30% of lactose to the formulation, lactose present in the surface increase (Table 1a) and wetting time was reduced from 932 to 639 s and 623 to 201 s respectively. The same study was performed for NWI. After addition of 30% of lactose in the formula-tion, the surface lactose also increases, showing a wetting time improvement from 1498 to 1085 s and 991 to 499 s, respectively. Surface fat cover seems to have a very important influence in the powder wetting properties. For the 25 powders studied (Gaiani et al., 2010), a direct correlation between fat surface content and wetting time was observed. For example, for the surfaces with
Table 1b
Bulk composition and surface composition obtained from XPS and linear equation relating elemental components to lactose, protein and fat in milk powders and milk sub-product powders from pilot scale spray dryers.
Powder system Evaporation capacity (kg h"1) Tin/Tout(!C) % Of surface lactose (bulk) % Of surface proteins (bulk) % Of surface fat (bulk) References NMC 70–120 – 0.0 (0.4) 100.0 (86.7) 0.0 (0.3) Gaiani et al. (2006) NMC + Lactose 70–120 – 8.9 (22.1) 89.4 (66.3) 1.7 (0.4) NMC + Ultrafiltrate 70–120 – 3.4 (21.3) 91.3 (62.2) 5.3 (0.4) NMC – 215/70 0 (1.5) 94 (80.6) 6 (0.4) Gaiani et al. (2007) NMC-A15DS-20!C-WB – 215/70 0 (1.5) 94 (80.6) 6 (0.4) NMC-A30DS-20!C-WB – 215/70 0 (1.5) 94 (80.6) 6 (0.4) NMC-A60DS-20!C-WB – 215/70 0 (1.5) 89 (80.6) 11 (0.4) NMC-A15DS-20!C-SB – 215/70 0 (1.5) 94 (80.6) 6 (0.4) NMC-A30DS20!C-SB – 215/70 0 (1.5) 87 (80.6) 13 (0.4) NMC-A60DS20!C-SB – 215/70 0 (1.5) 83 (80.6) 17 (0.4) NMC-A15DS-50!C-WB – 215/70 0 (1.5) 94 (80.6) 6 (0.4) NMC-A30DS-50!C-WB – 215/70 0 (1.5) 94 (80.6) 6 (0.4) NMC-A60DS-50!C-WB – 215/70 0 (1.5) 86 (80.6) 14 (0.4) NMC-A15DS-50!C-SB – 215/70 0 (1.5) 94 (80.6) 6 (0.4) NMC-A30DS-50!C-SB – 215/70 0 (1.5) 88 (80.6) 12 (0.4) NMC-A60DS-50!C-SB – 215/70 0 (1.5) 83 (80.6) 17 (0.4)
Table 1c
Bulk composition and surface composition obtained from XPS and linear equation relating elemental components to lactose, protein and fat in milk powders and milk sub-product powders from industrial installations.
Powder system Storage conditions Solvent nature Extraction time (h) % Of surface lactose (bulk) % Of surface proteins (bulk) % Of surface fat (bulk) References SMP – – – 36 (51.0) 46 (36.0) 18 (1.0) Kim et al. 2002(2005b) WMP – – – 2 (36.6) 0 (27.9) 98 (26.6) CP – – – 1 (12.3) 0 (11.5) 99 (71.5) WPC – – – 6 (7.4) 41 (80.4) 53 (5.6) SMP – – – 27 (50.0) 61 (34.0) 12 (1.0) Shrestha et al. (2007)
SMP After 6 months – – 36 (51.0) 44 (36.0) 20 (1.0) Kim et al. (2009b)
WMP – – 1 (36.6) 0 (27.9) 99 (26.6)
CP – – 0 (12.3) 0 (11.5) 100 (71.5)
SMP-ASFB – – – 42*(51.4) 40*(35.0) 18*(0.8) Kim et al. (2009a)
SMP-A2VFB – – – 40*(51.4) 42*(35.0) 18*(0.8) SMP-A3VFB – – – 42*(51.4) 39*(35.0) 19*(0.8) WMP-ASDC – – – 97*(37.5) 0*(26.5) 3**(26.8) WMP-A3VFB – – – 98*(37.5) 0*(26.5) 2*(26.8) IWMP-ASDC – – – 98*(36.1) 0*(28.0) 2*(26.8) IWMP-A1VFB – – – 98*(36.1) 0*(28.0) 2*(26.8) IWMP-A2VFB – – – 98*(36.1) 0*(28.0) 2*(26.8) MPC – – – 1.8*(4.8) 68*(84.7) 30*(1.5) Fyfe et al. (2011) MPC-A14DS 20!C, 44RH% – – 1.6*(4.8) 67*(84.7) 32*(1.5) MPC-A30DS – – 1.2*(4.8) 69*(84.7) 30*(1.5) MPC-A60DS – – 1.6*(4.8) 68*(84.7) 30*(1.5) MPC-A90DS – – 3.6*(4.8) 68*(84.7) 28*(1.5) MPC-A14DS 40!C, 44RH% – – 1.2**(4.8) 66*(84.7) 32*(1.5) MPC-A30DS – – 1.5*(4.8) 69*(84.7) 29*(1.5) MPC-A60DS – – 1.6*(4.8) 70*(84.7) 28*(1.5) MPC-A90DS – – 3.0*(4.8) 69*(84.7) 28*(1.5) MPC-A14DS 20!C, 66RH% – – 3.0*(4.8) 67*(84.7) 30*(1.5) MPC-A30DS – – 1.8*(4.8) 67*(84.7) 32*(1.5) MPC-A60DS – – 2.2*(4.8) 67*(84.7) 30*(1.5) MPC-A90DS – – 3.2*(4.8) 67*(84.7) 29*(1.5) MPC-A14DS 40!C, 66RH% – – 1.5*(4.8) 65*(84.7) 33*(1.5) MPC-A30DS – – 2.2*(4.8) 67*(84.7) 30*(1.5) MPC-A60DS – – 1.0*(4.8) 69*(84.7) 30*(1.5) MPC-A90DS – – 3.5*(4.8) 67*(84.7) 29*(1.5) MPC-A14DS 20!C, 84RH% – – 1.6*(4.8) 66*(84.7) 33*(1.5) MPC-A30DS – – 1.7*(4.8) 64*(84.7) 33*(1.5) MPC-A60DS – – 1.2*(4.8) 75*(84.7) 24*(1.5) MPC-A90DS – – 4.6*(4.8) –*(84.7) –*(1.5) MPC-A14DS 40!C-84RH% – – 1.8*(4.8) 67*(84.7) 33**(1.5) MPC-A30DS – – 2.2*(4.8) 64*(84.7) 30*(1.5) MPC-A60DS – – 2.2*(4.8) 66*(84.7) 30*(1.5) MPC-A90DS – – 3.5*(4.8) 67*(84.7) 29*(1.5) WMP – – – 0.5 (52.0) 6.2 (37.1) 93.3 (1.4) Murrieta-Pazos et al. (2012) AWMP – – – 1.3 (36.7) 7.5 (26.2) 91.2 (27.3) SMP – – – 30.9 (52.0) 45.1 (37.1) 22.8 (1.4) ASMP – – – 36.3 (36.7) 39.3 (26.2) 23.2 (27.3)
SMP – Petroleum ether 0.17 45 (58) 50 (41) 5 (1) Kim et al. (2002)
– 24 44 (58) 55 (41) 1 (1) – 48 45 (58) 54 (41) 1 (1) WMP – Petroleum ether 0.17 5 (40) 9 (31) 86 (29) – 24 9 (40) 10 (31) 81 (29) – 48 10 (40) 22 (31) 68 (29) CP – Petroleum ether 0.17 23 (13) 10 (12) 67 (75) – 24 24 (13) 12 (12) 64 (75) – 48 26 (13) 15 (12) 59 (75) WPC – Petroleum ether 0.17 7 (8) 92 (86) 1 (6) – 24 9 (8) 90 (86) 1 (6) – 48 9 (8) 90 (86) 1 (6) SMP – Hexane 0.17 44 (58) 53 (41) 3 (1) – 24 59 (58) 41 (41) – (1) – 48 62 (58) 38 (41) – (1) WMP – Hexane 0.17 3 (40) 24 (31) 54 (29) – 24 63 (40) 18 (31) 19 (29) – 48 67 (40) 19 (31) 14 (29) CP – Hexane 0.17 4 (13) 0 (12) 96 (75) – 24 4 (13) 0 (12) 96 (75) – 48 5 (13) 0 (12) 95 (75) WPC – Hexane 0.17 8 (8) 92 (86) 0 (6) – 24 10 (8) 90 (86) 0 (6) – 48 10 (8) 90 (86) 0 (6)
higher fat content, values obtained by NWI dried at 70!C (33.8%) gave a maximum registered wetting time of 1498 s. The fastest wetting times were registered for NMC with addition in the formu-lation of 30% of lactose and spray dried at 110, 130 and 150!C; this gave 0% surface fat. These results agreed with those obtained by
Kim et al. (2002)studying WMP and CP. Here the wetting times for WMP and CP were higher than 900 s, and after free fat extrac-tion the wetting times were reduced to 35 and 100 s for WMP and CP, respectively.
Lecithination of powders is a practice recurrent in the food powder industry that improves wetting and rheology of powders.
Millqvist-Fureby and Smith (2007)added lecithin to SMP, WPC and lactose in order to adapt the method relating elemental anal-ysis of XPS to surface composition of powders covered with leci-thin. This adaptation was developed with a layer model indicating that lecithin would coat the whole particle surface. Sur-face composition for SMP + Lecithin, WPC + Lecithin and lac-tose + lecithin was 54.3%, 54.8% and 0% of proteins, 17.9%, 23.5% and 51.3% of lactose and 27.8%, 21.7% and 48.7% of lecithin respectively.
Authors attribute the low lecithin values to the thickness of the coverage. The lecithin layer thickness is estimated at approxi-mately 2.5 nm. This is thinner than the analysis depth (10 nm). From this value, estimation of the surface layer thickness for each powder was calculated: 1.6 nm for SMP + Lecithin, 0.8 nm for WPC + Lecithin and 1.9 for lactose + lecithin.
Another study related the wetting time of NMC powder with fat migration from the bulk to the surface during storage (Gaiani et al., 2007). Wetting values grew from 12 s in fresh powders to 35 s (watertight bag) and 73 s (standard bag) after 60 days storage at 20!C. Results were more drastic when the powder is stored at 50!C with 148 s (watertight bag) and 265 s (standard bag). This delay in the wetting time was attributed to a larger fat coverage.
For SMP the same phenomenon was observed. The fat surface coverage in fresh powder was determined at 18% and after 6 months of storage at room temperature (10–30!C), the fat cover-age shifted to 20%. For WMP and CP, the fat surface covercover-age was important even for fresh powder (98% and 99%). However no sig-nificant changes were observed after 6 months storage (Kim et al., 2009c).
In order to improve the reconstituted powder properties, others studied the effect of processing parameters on the powder surface. High spray-drying temperatures (Gaiani et al., 2010), high solid content and homogenization (Kim et al., 2009c), appear to produce powders with less surface fat (Tables 1a, 1b and 1c) allowing short-er wetting times as demonstrated in the work of Gaiani et al. (2010).
The influence of the protein denaturation (mainly whey pro-teins) on components repartition in the dry particle was also stud-ied byMillqvist-Fureby et al. (2001). A slight increase in surface fat was observed with the denaturation percentage whereas the lac-tose coverage was almost constant and the protein coverage de-creased. The wetting time was augmented from 21 to 40.2 s for
the corresponding degree of denaturation of 4% and 51% with a consequential increase in the surface fat content.
2.1.2. Caking phenomena
Caking is a prevalent situation that can cause problems in oper-ation, equipment surfaces or product yield (Adhikari et al., 2001).
Nijdam and Langrish (2006)related the degree of caking to the sur-face composition of milk powders presenting different fat contents. The results indicated that the degree of caking was high (>90%) for powders containing between 5% and 30% of surface fat. On the other hand, the caking was importantly reduced (<60%), when sur-face fat was less than 3%. Here there appears to be a strong corre-lation between the caking ability of the powder and the fat surface coverage.Hartmann and Palzer (2011)studied caking kinetics of water-soluble amorphous powders. For these powders, the sinter bridges created in the powders were measured.
2.1.3. Lipids oxidation
Surface fat also indicates a susceptibly to oxidation (Kim et al., 2002). For example, an oxidation ‘‘signature’’ may be potentially observed by XPS.Kim et al. (2002)compared the oxygen peak of various dairy powders to detect an oxidation at the surface. After 2 days storage at 40!C, the O1speak had significantly changed in all the powders (SMP, WPC, WMP and CP), with the biggest in-crease (1.5%) observed in the CP and the smallest observed in SMP. 2.1.4. Flowability
The flowability of a powder is an important property in han-dling and processing operations, such as storage, transportation, formulation, mixing, compression or packaging (Knowlton et al., 1994). Flowability is known to be highly dependent on particle size and distribution (Barbosa-Canovas et al. 1987), but also on surface chemical composition (Kim et al., 2005b). The angle of response was measured to reveal flow properties for different spray-dried powders: SMP, WMP, WPC and CP (Kim et al., 2005b). WMP and CP provided surfaces largely covered by fat. WPC gave a medium surface fat coverage and SMP a low surface fat coverage (Tables 1a, 1b and 1c). A regular flow was registered for skim milk powder (85!), the rest of the powders did not flow (0!). In order to find if flow difficulties came from lipid surfaces, free surface fat was ex-tracted. Powders that did not flow before extraction flowed cor-rectly after the procedure, presenting angles of response about 80! (WMP), 60! (CP) and 90! (WPC).Kim et al. (2009c)also found some differences in flowability of skim milk powder after 6 months of storage increasing the contact angle from 85! (fresh powder) to 90!.
2.2. Use of XPS for non-dairy food powders
The use of XPS in the field of vegetal powders was limited with accessibility onto to pour databases. XPS studies on starch permit elemental composition determination of the outer 5–10 nm of the granule surface. Russell et al. (1987) and Baldwin (2001) Table 1c (continued) Powder system Storage conditions Solvent nature Extraction time (h) % Of surface lactose (bulk) % Of surface proteins (bulk) % Of surface fat (bulk) References
WMP – Petroleum ether 5 % 0.83 19.3 (52.0) 18.1 (37.1) 62.5 (1.4) Murrieta-Pazos et al. (2012)
AWMP – Petroleum ether 5 % 0.83 18.4 (36.7) 8.1 (26.2) 72.8 (27.3)
AxVFB, after x vibrating fluidized bed (x = 1, 2 or 3); ASDC, after spray drying chamber; ASFB, after static fluidized bed; AWMP, agglomerated whole milk powder; ASMP, agglomerated skim milk powder; AxDS, after x days of storage (x = 14, 30, 60 or 90); CP, cream powder; IWMP, instant whole milk powder; MPC, milk protein concentrate; NWI, native whey isolate; RH, relative humidity; SMP, skim milk powder; Tin/Tout, inlet temperature/outlet temperature; T, Traces; WPC, whey protein concentrate; WMP,
whole milk powder.
deduced the percentage of protein surface coverage from nitrogen peak areas. Granule surfaces of cereal starches contain between 1% and 2% nitrogen, whereas potato starch surfaces contain only 0.01% nitrogen. Using the nitrogen peak area technique the percentage of protein surface coverage was revealed as 4–12.5% for cereal starches and around 0.5% for potato starches. This protein content apparently varies according to the botanical source of the starch.
Saad et al. (2009) performed XPS on wheat flour before and after re-grinding and related the surface flour composition to water sorption properties. After decomposition of oxygen O1s(O@C, O–C and H2O), carbon C1s (C–(C, H), C–(O, N), C@O and O–C@O) and nitrogen N1s(C–NH and C–NH3) peaks, C1speak appear induce a slight decrease of the C–(C, H) bond from 61% in native flour to 60%, 59% and 57%, respectively to first, second and thirst re-grind-ing passes. Concurrently the total of C–O functions (C–(O, N), C@O and O–C@O) increased. From the O1speaks, the O@C functions in-creased significantly whereas the O–C functions dein-creased from 82% in native flour to 77.5, 76.9 and 75.2, respectively to first, sec-ond and thirst re-grinding passes.
These results reflect a decrease in the number of hydrophobic bonds and a decrease in the number of hydrophilic bonds. The authors attribute this behavior to physical changes induced by re-grinding resulting in starch granule rupture.
The matrix formula developed for dairy powders (Fäldt, 1995) was derived for wheat powders (Saad et al., 2011a). Native flours as well as flours reconstituted from pure components were ana-lyzed in order to validate the method. Surface of reconstituted flours was calculated. For example, for a mix of 90% starch-10% protein, the surface composition resulted between 87.4% and 90.6% of starch and between 12.9% and 10.3% of proteins, depend-ing on the calculus method. These values were consequent with the mixture composition. A very different result was obtained for native powders, 5 native flours were analyzed: wheat flour stan-dard (F1), peeled flour of crusty wheat variety (F2), pearled flour of crusty wheat variety (F3), peeled flour of tiger wheat variety (F4) and pearled flour of tiger wheat variety (F5). Surface composi-tion obtained for flours F1, F2, F3, F4 and F5 was: 1.7, 1.2, "6.5, "1,3 and "5.7% of starch, 54.2%, 53.8%, 70.5%, 85.6% and 66.5% of protein and 44.5%, 45.3%, 36.6%, 28.9% and 39.6% of lipids, respec-tively. The composition of the native flour presents an over-repre-sentation of lipids and proteins, compared with the bulk composition (81.3% starch, 12.9% protein, 2.3% lipids). After com-parison of native and reconstituted flours, native powders were more complex materials with a heterogeneous distribution of the components. Authors concluded that surface composition is not a simple transposition of the bulk composition suggesting some mask interactions between the components. The lack of references for cereal products makes difficult to conclude on the reliability of this method applied to characterization of surface cereal products (Saad et al., 2011a). The surface of wheat flour fractions was also studied (Saad et al., 2011a), the same technique was used to deter-mine the surface composition of fractions. When analyzing frac-tions, the protein content decreases from 51.9% to 43.5% and the lipid content increases from 46.7% to 51.1%. With the augmenta-tion of the particle size, a clearest tendency is observed in ground flour sieved decreasing from 54.8% to 20.9% of protein and 46.3% to 63.4% of lipids with the size particle augmentation. In both cases, the starch content was relatively constant (Saad et al., 2011a).
The use of XPS in the field of other food powder is infrequent.
Stevens and Schroeder (2009)performed quantitative analysis of saccharides by XPS. They presented the spectra of various carbohy-drates. The accuracy of the analysis permits the distinction be-tween mono-, di-, and polysaccharides. Indeed, chemical shifts of the C–O and O–C–O groups increase on moving from monosaccha-rides to disacchamonosaccha-rides to polysacchamonosaccha-rides, actually the rates of Al
K
a
X-ray-induced degradation are significantly different, specifi-cally the O/C decrease and increase in the peaks at 285 and 289.1 eV. These authors also found a relationship between the caramelization tendency and time of exposure to XPS radiation. The database developed is now a useful tool for surface carbohy-drate analysis.Vega et al. (2005)adapted the matrix formula (Fäldt 1995) for spray dried ice cream mixes, different formulations were tested. Ice cream spray dried powders observed the same over-represen-tation of the fat at the surface (between 81% and 96%) in compar-ison with bulk composition (between 19.1% and 44.9% of fat content), powders without emulsifiers and containing casein re-duced surface fat (from 85% to 78%) at expense of higher protein coverage (6–11%), powers without emulsifiers not containing case-in also reduced fat cover (from 81% to 73%) exchangcase-ing this deficit by a gain in protein cover (from 8 to 15%).
Rouxhet et al. (2008) analyzed cake ingredients; the authors propose an elaborated model to relate atomic composition to bio-chemical molecules. In order to achieve this propose they extracted information on chemical functions and refine the results expres-sion in terms of molecular constituents. This model make possible distinguish among proteins, carbohydrates, phospholipids (PL) and neutral lipids (NL) in flour, eggs white, egg yolk and whole egg powders. The results agree with those obtained from the matrix model (Fäldt, 1995), surface molecule distribution is different from bulk composition. Results illustrating similitudes between the both methods are obtained for flour. This powder presents concentra-tions of PL and NL fewer than 2% in bulk composition in contrast to the surface with approximately 10% and 30% of PL and NL, respectively. Even when results are consequent with others publi-cations, this method is more detailed and permits to obtain finest information about the surface by discriminating different mole-cules of the same family (lipids).
2.3. Interesting complementary technique
The combination of time of flight secondary ion mass spectrom-etry (ToF SIMS) and XPS has proved to be a valuable tool for the analysis of surfaces. Until now, this combination had never been done for food powders. The ToF-SIMS uses a pulsed primary ion beam to desorb and ionize species from a sample surface. The resulting secondary ions are accelerated into a mass spectrometer and are then mass analyzed by measuring their time-of-flight from the sample surface to the detector. The application of ToF-SIMS in food analysis has been explored only very recently. For example, this method has been applied with success to analyze pesticides on the surface of olives (Focardi et al., 2006), the principal compo-nent presenting the strongest variance (90.3%) after analysis of 51 samples, was used to determine differences on the surface sam-ples. The study shown signals at m/z = 31 (CH3O+) and m/z = 147 (C6H14NOP+or C6H13NOS+) with higher intensities in native olives (1.12 % 10"4, 2.93 % 10"5, respectively) than olives covered with pesticide (4.23 % 10"4, 2.42 % 10"4, respectively). Cliff et al.
(2003), adapted the technique to monitoring and imaging clofaz-amine with dominant peaks m/z 184 [(CH3)3NCH2PO4H2] on the surface of yeast cells in the frozen-hydrated state. They demon-strated the absence of clofazamine within molecular information from a cell fractured in order to reveal the cell ultrastructure. In the therapeutic field,Grenha et al. (2007)characterized the surface and the internal structure of microsphere containing chitosan and mannitol. It was possible to investigate the repartition of the com-ponents in the particle surface by obtaining the characteristics peaks of each component m/z 193 (CH19P2N6O), m/z 249 (C10H18PO5), and m/z 281 (C4H21N14O), chitosan nanoparticles being successfully encapsulated in mannitol microspheres. All these works have demonstrated the power of ToF-SIMS spectral
Table 2 Surface characterization of food powders by scanning electronic microscopy. Methods Powder systems References Spray drying SMP SMP after free fat extraction (petroleum) SMP after free fat extraction (ethanol) Kim et al. (2002) WMP WMP after free fat extraction (petroleum) WMP after free fat extraction (ethanol) CP CP after free fat extraction SMP (spray dried at low temperature) SMP (spray dried at high temperature) Kim et al. (2009b,c) fresh NMC NMC after 60 days Gaiani et al. (2009) SMP aw = 0.23 SMP aw = 0.94 WMP aw = 0.23 WMP aw = 0.94 Murrieta- Pazos et al. (2011) MPC aw = 0.65 MPC aw = 0.65 after 90 days Fyfe et al. (2011) (continued on next page )
analysis and chemical imaging for the study of food and may be an interesting tool for food powders.
3. Microscopy techniques making surface characterization possible
3.1. Electron microscopy techniques 3.1.1. Classical SEM characterization
SEM apparatus uses a beam of electrons instead of light to form an image. In some cases, it may be necessary to cover the powders with a thin layer of carbon or gold to give it conductive properties. In food powders, SEM images could detail the particle shape and surface aspect. Powders suprastructure and organization have been widely studied in milk (McKenna et al., 1999) and milk– wheat flour mixtures (Al Mahdi et al., 2006). For dairy powders, surface dents have been widely registered (Gaiani et al., 2006; Millqvist-Fureby and Smith, 2007; Kim et al., 2009b; Haque and Roos, 2006). Lactose mixtures and milk models obtained by freeze-drying (Marabi et al., 2008) (Table 2), presents the same structure described byHaque and Roos (2006)(Table 2), who also noted more bright surfaces in higher surface fat content powders. Different spray dried milk powders (skim milk, whole milk, cream and whey protein concentrate) were treated with petroleum ether and ethanol in order to extract surface free fat (Kim et al., 2002). The SEM images obtained from powders before extraction show smooth surfaces and clearly dented surfaces after ethanol extrac-tion; a less affected surface was obtained with petroleum ether, (Table 2).Kim et al. (2009c)obtained milk powders at two spray-drying temperatures (145/85 and 205/105!C). More spherical par-ticles and smoother surfaces were obtained at the higher temper-ature (Table 2). It was also observed that particles bigger than 90
l
m are agglomerates. SEM was also used to characterize pow-der surfaces during storage, thusGaiani et al. (2009)noticed some pores at the surface of casein powders, (Table 2). Cross section analyses of milk and cream powders (Table 2) were also performed after free fat extraction (Kim et al. 2009b). Here the authors de-duced some capillary properties that may interact in the migration of fat into the surface.Murrieta-Pazos et al. (2011)observed the evolution of lactose crystals formed at the surface of WMP and SMP conditioned at different relative humidities (Table 2).Jenni (2007)observed a change in the shape and the surface as-pect of wheat flour particles as a function of their size; the particles became less and less rounded and more and more rough as size in-creased. Partial dissolution of particles surface was observed in MPC stored at 65% RH during 14 and 30 days (Table 2) byFyfe et al. (2011). The starch granule has been also widely studied. Fan-non et al. (1993)observed pores at the surface of starch granules of potato, corn and wheat deducing the formation of interior channels in the structure. Later,Gallant et al. (1997), observed starch from different botanical sources, meanly wheat and potato (Table 2). These particles were characterized as a golf ball shape, where nod-ules correspond to amylopectin-based blocklets suspended in an amylose-based supporting matrix.
3.1.2. Interesting complementary methods
Recently, SEM images were sometimes combined with energy dispersive X-ray spectroscopy (EDX) analyses. The EDX analysis system works as an integrated feature of a SEM apparatus and cannot operate on its own. Its characterization capabilities are due in large to the fundamental principle that each element has a unique atomic structure, thus X-ray energy emitted by the atoms after excitation with an electron ray is characteristic of each element’s atomic structure. Hence one element can be identified uniquely from one another. To stimulate the emission of
Table 2 (continued ) Methods Powder systems References Freeze drying Lactose + WPI Lactose + NaCa Lactose Haque and Roos (2006) Milk powder (0% fat) Milk powder (10% fat) Milk powder (45% fat) Marabi et al. (2008) Extraction Wh eat starch after enzymatic hydro lysis Potato starch after enzymatic hydrolysis Gallant etal. (1997) CP, cream powder; NaCa, sodium caseinate; MPC, milk protein concentrat e; NMC, native micellar casein; SMP, skim milk powder; WMP, whole milk powder; WPI: whey protein isolate.
characteristic X-rays from a specimen, a high-energy beam of charged particles is focused into the sample. The output of an EDX analysis is an EDX spectrum, which is a plot of how frequently an X-ray is received for each energy level. The higher a peak in a spectrum, the more concentrated the element is in the sample. This technique was used for identifying the elemental composition of the sample, or an area of interest thereof.
EDX has been used on vegetal material and food extracts. For example, EDX spectra showed mineral nutrients (P, K and Mg) stored in different tissues of quinoa seeds (Prego et al., 1998). Other authors analyzed some protein bodies in tissues of different rice grains by this technique and observed some micronutrients (Fe, Mn, Zn and Cu) and macronutrients (P, Mg and K) in specific rice genotypes (Prom-u-thai et al., 2008). Recently, this technique has also been used for the detection of irradiation treatment on basmati rice by the analysis of minerals extracts (Sanyal et al., 2009). In the field of food powder,Murrieta-Pazos et al. (2011, 2012), adapted the matrix model in XPS (Fäldt, 1995) in this case using EDX data to investigate the chemical composition of dairy powders at a depth of approximately 1
l
m. Surface composition was calculated for WMP and SMP. Protein, lactose and lipids con-tent were respectively for WMP = 34%, 16.8%, 46.4% and for SMP = 25.8%, 13.7%, 58.6% (Murrieta-Pazos et al., 2011). The same technique was performed to characterize the surface of granulated milk powders (GWMP and GSMP). Protein, lactose and lipids con-tent was for GWMP = 21.3%, 11.9%, 65.4% and for GSMP = 7.5%, 1.3%, 91.2%, respectively. Another analyze was performed for whole milk particles (WMP and GWMP), after extraction of the free fat at the surface. The surface composition of protein, lactose and lipids obtained was WMP = 30.0%, 11.3%, 55.5% and GWMP = 31.3%,13.1%, 52.3%, respectively. By comparing these surface composition with those obtained by XPS (Table 1c), an interesting gradient model of a milk powder particle was proposed (Murrieta-Pazos et al., 2012).
3.2. Atomic force microscopy (AFM)
In food science, application of the AFM is quite recent and mostly concerns the study of the structures of biopolymers (mostly polysaccharides including carrageenan, cellulose, pectin, xanthan) as film deposition onto a surface (Iijima et al., 2007; Kirby et al., 2008; Funami, 2010; Olivares et al., 2010; Lukasiewicz et al., 2007). As example, a model to explain the mechanism was de-duced from the observation of the pectin structure during acid hydrolysis (Round et al., 2010). AFM was also used for direct imag-ing of the inner surface topography of food objects like whole grains and starch granules.
In food powders, AFM can be used to investigate the surface topology of different botanical sources of starch granules at the nanoscale. Some examples are: wheat (Baldwin, 1995; Baldwin et al., 1998; Gallant et al., 1997), pea (Ridout et al., 2004) and also rice (Ohtani et al., 2000a). Some of these examples are illustrated in
Table 3. By comparing the difference between the highest and low-est points on a granule surface (measured at a scan size of 1000 nm2),Baldwin et al. (1998)reveals a flatter surface of Riband wheat starch compared to potato starch (Table 3). Ohtani et al. (2000b)observed starch by different methods of sample prepara-tion as microtome, enzymatic digesprepara-tion and physical destrucprepara-tion of starch granules, from five different botanical sources (corn, po-tato, rice, sweet potato and wheat). Images revealed different
Table 3
Surface characterization of food powders by atomic force microscopy.
Powder systems References
Native wheat sta Native potato starch Native potato
starch
Gallant et al. 1997
andBaldwin et al. 1998
Rice starch after destruction of granules
Corn starch after destruction of granules
Potato starch after destruction of granules
Ohtani et al. 2000b
Pea starch after exposure to water
Pea starch after drying Potato starch
gelatinized Ridout et al. 2004andAn et al. 2008
Tapioca starch mapped with – OH
Tapioca starch mapped with –OH after acid hydrolysis Tapioca starch mapped with – CH3 Wuttisela et al. (2009) Skim milk powder
Whole milk powder Murrieta-Pazos
surface roughness depending on the botanical source, but sup-ported a blocklet starch model. The structure of the starch granules after hydration have been studied and showed a banded-ring structure alternating amorphous and crystalline rings (Parker et al., 2008; Gunning et al., 2010). The gelatinization of starch (from different sources, pure or blended with other biopolymers, during heating) was also observed (An et al., 2008; Funami et al., 2008; Quiroga and Bergenståhl, 2007), some examples are pre-sented in Table 3. Some interesting scanning chemical force microscopic investigations have been reported recently, native and hydrolyzed tapioca starch have been imaged with functional-ized –OH and –CH3tip probes in order to study the relationship of the surface structure and the amylose/amylopectin ratio (Table 3). However the differences in the chemical domain of the starch were not determined by topographic images (Wuttisela et al., 2009).
The majority of food particle powders are multi-component and rough. In the studies reported in the literature, the food material samples are specially prepared for AFM imaging by either embed-ding into a resin, slicing, powdering or centrifuging in a suspension to then deposit or fix the sample onto a mica plate. To use the AFM techniques to image the surface of food particles and study their topology is still a challenge. Until now, AFM was rarely tested on flours (Jenni, 2007) or dairy powders (Murrieta-Pazos et al., 2011) and/or others food powders than starch (Waduge et al., 2010; Tomoaia-Cotisel et al., 2010). Recently, Murrieta-Pazos et al. (2011)demonstrated the precision of the technique to char-acterize the surface of two dairy powders presenting low and high fat surface coverage (Table 3). AFM images were in agreement with those obtained by SEM, revealing a flat surface for skim milk pow-der (SMP) and a rough surface for whole milk powpow-der (WMP). In addition, the average surface roughness was determined and was respectively found around 306 nm for SMP and 146 nm for WMP for a definite surface area (10 % 10
l
m). AFM was also recently used to study the structure of MPC particles as a function of the storage in reconstituted milk (fresh and after ageing 30 days at 25!C and 65% RH) (Fyfe et al., 2011). The AFM measurements per-mit to conclude that the surface modification of the aged MPC and the increase of the surface hydrophobicity contribute to the de-crease of the MPC solubility during storage.3.3. Transmission electron microscopy (TEM)
In TEM, an image is formed from a beam of electrons trans-mitted through an ultra thin specimen and consequently forms an image at the receiving device. The beam of electrons interacts
with the specimen as it passes through. The application in food powders is not very extensive. Nevertheless, specific details about protein–protein and protein–fat interactions can be ob-served in milk powder samples (Vignolles et al., 2009). The microstructure of four commercial whole milk powders and their insoluble residuals were observed. Differences were observed depending on the processing conditions (McKenna et al., 1999; Qi, 2007).
TEM has permitted the understanding of the suprastructure of the starch granules. These studies started withWhistler and Turner (1955). ‘‘Blockets’’ of granules were later observed in the starch surface structure (Baldwin et al., 1997), and more recently, a tech-nique was performed that oxidized the surface of amorphous re-gions in order to attach silver particles. The silver helps highlight the starch superstructure (Table 4) and so a model has been devel-oped (Gallant et al., 1997).
Rayas-Duarte et al. (1995)used gold-labeling to detect a specific polypeptide by TEM, both in the surface and inside the starch gran-ule in wheat endosperm.
3.4. Confocal laser scanning microscopy (CLSM)
Recently, CLSM was shown to be a helpful tool for internal microparticles characterization. CLSM enables the production of 3-dimensional optical plan images. It can provide information about particle morphology and the location of fat at the surface of whole milk particles (McKenna, 1997). The work ofMcKenna et al. (1999)for different commercial whole milk powders, was complemented by CLSM observations of differences in fat droplet size and distribution across the surface under different process conditions. CLSM was also performed on high-fat milk powders after a 6 month storage period, with and without homogenization (Table 5) byVignolles et al. (2009). Differences in fat droplet size were also associated to the process conditions. The distribution of fat within and on the milk powder was also studied by Kim et al. (2002), results are presented in Table 5. Chanvrier et al. (2005)observed the protein structure in corn flour (Table 5). The influence of drying temperatures was investigated by Paramita et al. (2010)on microencapsulated limonene. The increase of the feed temperature increased the wall thickness and decreased the diameter of hollow particles. This is found favorable to avoid flavor release and to resist the penetration of both oxygen and water from the surrounding environment. Paramita et al. (2010) have also employed the CLSM technique for studying the morphology of spray-dried microcapsules.
Table 4
Characterization of food powders by transmission electron microscopy (TEM).
Methods Powder systems References
Spray drying McKenna et al. (1999)
Instant whole milk powder CM: Casein Micelles FG: Fat Globules
Instant whole milk powder Arrows: Interactions Fat Globules–Casein Micelles
Extraction Gallant et al. (1997)
Wheat starch after enzymatic hydrolysis Potato starch after enzymatic hydrolysis
Natural state Rayas-Duarte et al. (1995)
Wheat endosperm
4. Laser diffraction and dynamic image analysis
Until recent years, shape analyses were performed by image processing techniques obtained by CLSM and/or SEM (Du and Sun, 2004). Nowadays, laser diffraction systems coupled with im-age processing have been developed and permit on line measuring of size and shape in a very high number of particles. A great num-ber of qualitative terms may be used to give some indication of particle shape (Saad et al., 2011b). For example, the circularity or sphericity is defined as the ratio of the perimeter or the silhouette and the circumference of a disk that has de same area as the silhou-ette and the convexity is the ratio of the value obtained by project-ing a particle area fillproject-ing concave zones and the real area. This describes the compactness of a particle (Hentschel and Page, 2003).
Saad et al. (2011b)developed a quantitative method to evaluate shape factors (elongation, circularity, compactness and convexity) of wheat powder particles. The powders studied were, Native Flour, Sieved Flour <125
l
m, 125–160l
m and >160l
m, Native semolina and Semolina Sieved <315l
m and >315l
m. Wheat par-ticle display values of elongation between 2.04 and 2.11, circularity from 1.13 to 1.17, compactness between 0.690 and 0.707 and final-ly convexity from 0.902 to 0.873.The wetting behavior of a solid particle may be influenced by the particle size. The wettability time was systematically shorter (88–115 s) for large (&400
l
m) particles in the case of casein pow-ders (Gaiani et al., 2005). Indeed, faster wetting (4.1 s studying 4 g of sieved skim milk powder) is often recorded with large particles (>1000l
m) doe to the formation of large pores, high porosity and small contact angles between the powder surface and the pene-trating water (Freudig et al., 1999). Very little work has been car-ried out for food powders on particle morphology (Gaiani et al.,2011b; Perea et al., 2009) whereas the literature was very fur-nished for minerals powders (Ulusoy, 2008; Chau et al., 2009). Nevertheless,Perea et al. (2009)found some relationships between the morphology of milk powder agglomerates and their rehydra-tion properties. An increase of the solubility and the wettability was related with an increase of the particle compactness and shape factor. The study ofGaiani et al. (2011b)showed, for the first time, a correlation between powder rehydration properties and particles shape, in addition to the particle size and color (mainly related to chemical composition). The sphericity was the shape parameter demonstrating a stronger influence in rehydration properties, sphericity values were registered between 0.5 and 0.9 for dairy powders (NMC, NWI, SMP, WMP and Semi-SMP), small particles presenting high sphericities values (&0.9) obtained lower wetting times, SMP = 1750 s, Semi-SMP = 1650 s, NMC = 2500 s. Further-more, a regression model was developed to replace time-consum-ing measurements for dispersibility and solubility.
5. Dynamic vapor sorption (DVS)
The DVS apparatus provides fully automated, rapid and accu-rate measurements of gravimetric moisture uptake in solid materi-als at a wide temperature range using dynamic environment control and ultra-sensitive recording microbalance. Sorption iso-therms were performed for casein powder during storage byGaiani et al. (2009). By applying the model of Guggenheim–Anderson– Boer (GAB), after 60 days of storage, a decrease of the monolayer capacity was registered from 0.0632 to 0.0617 kg/kg at 20!C and from 0.0632 to 0.0524 kg/kg at 50!C. This decrease in the water affinity was related to the surface fat increases during storage. It was hypothesized that a layer of fat may progressively cover the
Table 5
Characterization of food powders by confocal laser scanning microscopy (CLSM).
Methods Powder systems References
Spray drying
Instant whole milk powder
Instant whole milk powder McKenna et al. (1999)
Whole milk powder Kim et al. (2002)
Milk model with low free fat
Milk model with low free fat after free fat extraction
Vignolles et al. (2009)
Milk model with high free
fat Milk model with high free fat after free fatextraction
Milling Proteins in corn flour Chanvrier et al.
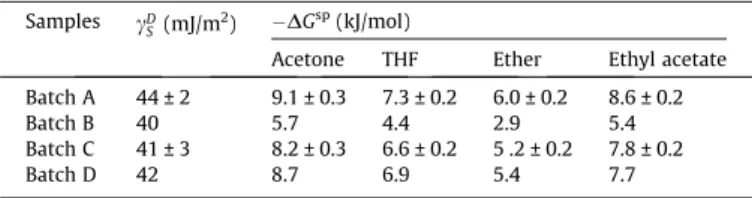
surface making it more hydrophobic, the appearance of this fat layer was confirmed by XPS (Tables 1a, 1b and 1c). Wheat flour iso-therms were also registered bySaad et al. (2009). Isotherms were fitted to GAB model, the values shown a slightly increase in the monolayer capacity, from values obtained in native flour (0.085 kg/kg) to those registered after first pass re-grinding (0.084 kg/kg), second pass re-grinding (0.085 kg/kg) and thirst pass re-grinding (0.0864 kg/kg), even when XPS presents a decrease in the number of hydrophobic bonds in contrast to hydrophilic bonds. Authors attributed the higher water affinity to a starch granule rupture caused by the re-grinding process.Mathlouthi and Rogé (2003)correlated the water vapor adsorption isotherm to the cak-ing and flowability of sieved and/or pulverized sucrose, studdcak-ing from amorphous and/or crystalline (RH > 86%) forms. Flowability measured as friability angle was registered from 35–55! at HR = 30% to 90! at HR = 90% for all the sizes. The caking of crystal-line forms does not allow to decaking the powder because of an agglomeration phenomena. Murrieta-Pazos et al. (2011) related data obtained from the sorption isotherm to the powder surface composition (EDX, AFM and XPS). The curves of diffusivity were di-rectly correlated to the chemical state of lactose crystallized (HR > 54%) or amorphous (HR < 54%), during water uptake and its localization at the surface. The protein, lactose and lipids composi-tion registered in the first micrometers (by EDX at &1
l
m) was SMP = 34.0, 16.8 and 46.4, respectively and WMP = 25.8, 13.7 and 58.6, respectively, the composition of the first nanometers (by XPS at &10 nm) is shown inTable 1c.The DVS method could not give direct information about the surface but may be used to obtain the following data: monolayer capacity, water binding energy, specific surface area. These data were in turn related to the particle surface characteristics.
6. Surface chemical extraction techniques
Different extraction techniques have been developed to obtain surface fat from dairy powdersTable 6.Vignolles et al. (2009) en-hanced one technique by varying the solvent hydrophobicity, the number of extractions, the solvent/powder ratio, the agitation mode and intensity, and also the extraction time. Kim et al. (2009a)precisely described a procedure to selectively collect sur-face free fat, inner free fat, encapsulated fat and total fat.
After fat extraction, it may be of interest to obtain information about the extracted fractions. DSC and high performance liquid chromatography (HPLC) are the most used in order to compare to-tal fat with surface fat properties.
DSC is one of the most widely used thermal analytical techniques in food research (Farkas and Mohácsi-Farkas, 1996).Vignolles et al. (2009)adapted protocols of DSC to measure the thermal profiles of fat in situ directly in powder samples, and in anhydrous bulk fat ex-tracted from the powders. In a low free fat dairy powder, i.e. less than 5% of the total fat, the crystallization profile of fat in the powder after free fat extraction had a second exothermic peak which enthal-py was higher than in the powder before free fat extraction.
The crystallization curves obtained were different and attributed to a difference in fat suprastructure and fat composition. On cooling, different melting profiles were also observed and attributed to dif-ferent fatty acid organization in total and free fat. Kim et al. (2005a), Murrieta-Pazos et al. (2012)andVega et al. (2005)studied dairy powders and ice cream mixture powders and they did not found differences in the melting profiles of free fat and encapsulated fat. It was explained by the need of a very different fatty acid profile to obtain a different melting profile.
Kim et al. (2005b)suggested a tendency present among the dif-ferent milk fat fractions studied by GC, high-melting triglyceride species (saturated fatty acid C6–C18) seem slightly more concen- Table
6 Variable fat extraction techniques and quantities extracted in milk powders and milk sub-product powders. Powders Free fat Surface free fat Inner fat Encapsulated and total fat References Quantity (gg " 1) Extraction method Quantity (gg " 1) Extraction method Quantity (gg " 1) Extraction method Quant ity encap sulated fat (g g " 1) Quantity total fat (g g " 1) Extraction method WMP – – 0.007 Buchheim (1978) -Hexane 0.015 Kim et al. (2005a) -Hexane 0.235 0.266 Kim et al. (2005a) Hexane/isopropanol Kim et al. (2005a) CP 0.266 0.211 0.228 0.715 WMP 0.028 Buma (1971) Petroleum ether –– –– – – – Kim et al. (2005b) SMP 0.001 CP 0.490 WPC 0.002 WMP after spray drying chamber 0.019 Kim et al. (2009a) Hexane 0.009 Kim et al. (2005b) Hexane –– – – – Kim et al. (2009a) WMP-A3VFB 0.018 0.007 IWMP after Static fluidized bed 0.012 0.010 IWMP-A1VFB 0.012 0.009 IWMP-A2VFB 0.016 0.012 WMP after 6 months – Buma (1971) Hexane 0.010 – 0.034 Kim et al. (2005a) -Hexane 0.208 0.261 Kim et al. 2005a Hexane/ isopropanol Kim et al. (2009b) CP after 6 months – 0.509 0.097 0.0 33 0.679 WMP 0.021 Vignolles et al. (200 9) Petroleum ether – – – – 0.217 0.237 Röse-Gottlieb Petroleum ether Murrieta-Pazos etal. (2012) Agglomerated WMP 0.030 0.206 0.252 AxVFB, after x vibrating fluidized bed (x = 1, 2 or 3); CP, cream powder, IWMP, instant whole milk powder; SMP, skim milk powder; WMP, whole milk powder; WPC, whey protein concentrate.