READ THESE TERMS AND CONDITIONS CAREFULLY BEFORE USING THIS WEBSITE.
https://nrc-publications.canada.ca/eng/copyright
Vous avez des questions? Nous pouvons vous aider. Pour communiquer directement avec un auteur, consultez la
première page de la revue dans laquelle son article a été publié afin de trouver ses coordonnées. Si vous n’arrivez pas à les repérer, communiquez avec nous à [email protected].
Questions? Contact the NRC Publications Archive team at
[email protected]. If you wish to email the authors directly, please see the first page of the publication for their contact information.
NRC Publications Archive
Archives des publications du CNRC
This publication could be one of several versions: author’s original, accepted manuscript or the publisher’s version. / La version de cette publication peut être l’une des suivantes : la version prépublication de l’auteur, la version acceptée du manuscrit ou la version de l’éditeur.
Access and use of this website and the material on it are subject to the Terms and Conditions set forth at
3-D Data Acquisition for Indoor Environment Modeling Using a
Compact Active Range Sensor
Elgazzar, Shadia; Liscano, Ramiro; Blais, François; Miles, A.
https://publications-cnrc.canada.ca/fra/droits
L’accès à ce site Web et l’utilisation de son contenu sont assujettis aux conditions présentées dans le site LISEZ CES CONDITIONS ATTENTIVEMENT AVANT D’UTILISER CE SITE WEB.
NRC Publications Record / Notice d'Archives des publications de CNRC:
https://nrc-publications.canada.ca/eng/view/object/?id=d56d1608-4359-4643-af75-2f2441d9c4da https://publications-cnrc.canada.ca/fra/voir/objet/?id=d56d1608-4359-4643-af75-2f2441d9c4daIEEE Instrumentation and Measurement Technology Conference
Ottawa, Canada, May 19-21, 1997
3-D Data Acquisition for Indoor Environment Modeling
Using a Compact Active Range Sensor
*S. Elgazzar, R. Liscano, F. Blais and A. Miles
Institute for Information Technology National Research Council of Canada
Ottawa, Canada K1A 0R6
A b s t r a c t - This paper investigates modeling indoor environments using a low-cost compact active range camera, known as B I R I S , mounted onto a pan and tilt motor unit. The BIRIS sensor, developed at the National Research Council of Canada, is a rugged small camera with no moving parts. The contributions of this paper are mainly in three areas: it demonstrates the viability of the use of a low-cost range sensor in the domain of indoor environment modeling; it presents the results of processing 3-D data to build a v i r t u a l e n v i r o n m e n t f o r n a v i g a t i o n a n d visualization; and, it analyses and outlines the advantages and limitations encountered when scanning large indoor environments.
I. INTRODUCTION
The long term objective of this research is to build the necessary tools and to develop the required algorithms to model indoor environments. The first step towards achieving this objective is to assemble, build and/or develop the necessary hardware and software tools for data acquisition and model construction.
Data acquisition implies the use of a sensor that can provide reasonable accuracy for the application and which can give a good coverage of the environment in one scan. A compact active range camera, known as BIRIS, is used for this purpose [1]. The outputs of the camera are two single-column arrays of registered range and intensity data. To obtain a BIRIS Scanning System that covers larger views of the environment, the camera
was mounted on a pan and tilt unit (PTU) [2]. The camera is rotated as acquisitions of the sensor are taken, resulting in two perfectly registered images of range and intensity.
Research in the domain of modeling using 3-D data has primarily focussed on the extraction of 3-D surfaces and volumetric primitives for the purpose of either object recognition or creating more precise models from 3-D sensory data of machined parts [3, 4]. These types of objects can easily be carried and placed in a controlled environment and scanned using a high resolution range sensor. This is significantly different than modeling large indoor environments where it is necessary to bring the sensor to the environment, changing the characteristics of the sensed data dramatically. Because of the larger domain in which the sensor is operating, research on the modeling of indoor environments has primarily focussed on the incremental synthesis of sensor views and/or position estimation of the sensor [5-8] using either 3-D active sensing or stereo vision.
In modeling large environments the need for detail diminishes and the challenge becomes one of trying to extract from the sparse sensory data an overall concept of shape and size of the structures within the environment. Previous attempts in this domain [9-11] have integrated intensity data with range data to help define the boundaries of surfaces extracted from the 3-D data, and then used a set of heuristics to decide what surfaces should be joined. For this application, it becomes necessary to develop algorithms that can hypothesize the existence of surface continuity and intersections among surfaces [12] and the formation of
more composite features from the surfaces [13].
The paper starts with a description of the BIRIS scanner, the tests performed to check the consistency of the PTU controller and a description of the data acquisition and scanning modes. The preliminary processing of the data is presented. Different data processing algorithms: filtering stray pixels and data above a certain range, region growing, segmentation of the images, and extraction of the boundaries are described. Some results are presented and analyzed. The display of the results is formed of a set of planar surfaces, represented as polygons, in 3-D space. These polygons are defined using the Virtual Reality Markup Language (VRML) and any VRML viewer can be used to view the model.
II. DESCRIPTION OF THE BIRIS RANGE SCANNER
To obtain range measurements, BIRIS uses active laser triangulation techniques. Like many advanced sensor systems, BIRIS relies on sophisticated processing to extract precise range data.
i. The Camera
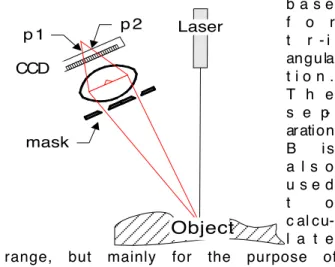
The BIRIS head [1,5] uses a standard CCD video camera, a laser line projector and a modified lens, Fig. 1. A double aperture mask introduced inside a conventional camera lens (Bi-IRIS) produces two distinct intensity peaks, p1 and p2, on the CCD sensor, of a single target point illuminated on the object surface. Both the centre position of the laser points, A = (p1 + p2) / 2, and their separation, B = p2 - p1, are used to calculate the distance of the camera to the object. The processing software uses the distance s p 2 Laser CCD 11111111 11111111 00000000 00000000
Object
p 1 maskeparating the laser projector and the point A as the b a s e f o r t r -i an gu la t i o n . T h e s e p-ar ati on B i s a l s o u s e d t o c al c u-l a t e the range, but mainly for the purpose of
Fig. 1. Triangulation using BIRIS.
validation. In perfect registration with the range data is the intensity data that is obtained by measuring the amount of laser light reflected back to the CCD. A realtime dedicated electronic board is used to compute the range and intensity data for every point on the projected laser line, providing an exact 3-D profile of the object at the speed of the CCD camera.
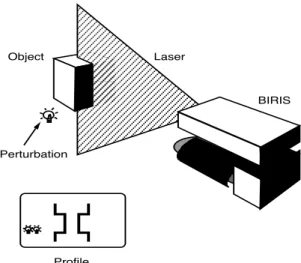
This arrangement offers a number of advantages: high immunity to ambient illumination and background interference due to its ability to discriminate false measurements, Fig. 2; compactness and reliability; sub-pixel resolution by matching the shape of the light intensity on the CCD array to determine the position of the reflection; speed, where 3-D profiles are generated at the frame rate of the CCD camera, 256 points per profile, 60 profiles per second; registered intensity and range images which give complementary information for image interpretation; and finally low cost implementation. Furthermore, BIRIS allows flexible configurations. It is possible to customize the BIRIS sensor to adapt to the required field of view, distance, resolution, speed, and to have multiple heads with overlapping fields of view. The maximum range attainable by BIRIS is
limited mainly by the error on the measurement at that range and the laser power. The maximum rate of acquisition is mainly defined by the frame transfer rate of the CCD camera and the application software. Appendix A summarizes the characteristics of the prototype used in this research.
ii. The Scanning System
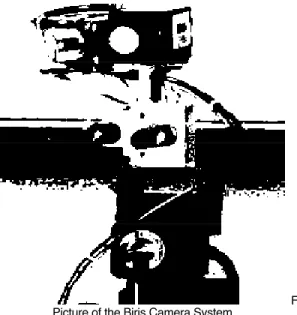
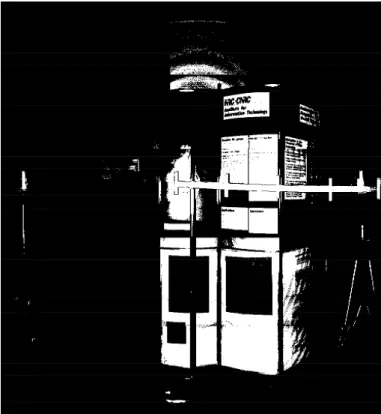
As mentioned above, one acquisition produces one line of 256 data points. To be able to scan an environment, the camera was mounted on a pan and tilt unit (PTU) [2], Fig. 3, and the whole assembly
111111 111111 111111 111111 111111 111111 111111 111111 000000 000000 000000 000000 000000 000000 000000 000000 Profile BIRIS Laser Object Perturbation
Fig. 3. Picture of the Biris Camera System
interfaced to the Biris software. Parameter files were written for the pan and tilt instructions. These defined the maximum and minimum angles of rotation and the velocities in both directions. A home command is also available.
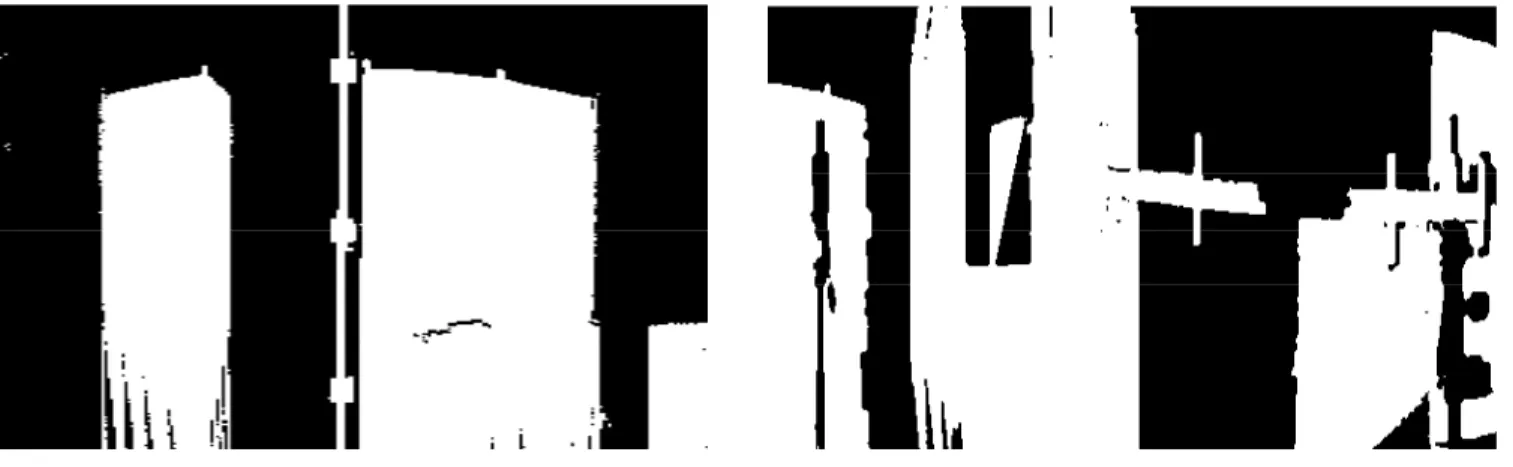
A simple experiment, outlined in Fig. 4 (a), was set up and scanned, Fig. 4 (b), in order to test the PTU controllerÕs acceleration and velocity capabilities. This was necessary to ensure the scans were of adequate quality for analysis. The figure depicts a part of a room, the background showing two partitions and a door. The foreground shows three tri-pods and a ruler with markers equally spaced along it. Processing the data representing the targetsÕ position showed good matching velocity and acceleration results.
III. DATA ACQUISITION
To scan a large environment, two modes of scanning were tested. In the first mode the camera system was kept at the same position (no translation) and was rotated
Q
degrees for every tilt angle, whereQ
is a user defined pan angle. The second mode consisted of a set of scans taken from different positions; this is required when it is desirable to take different viewpoints of the same scene so that occluded views are captured. In both cases, the camera position is saved with the corresponding data. The camera position is obtained either from the odometry data (of the mobile vehicle carrying the camera) or by photogrammetric methods. The results presented in this paper follow one example0° 60° -60° +5° -12° -30° -48° -66° Camera position 1.44 m 1.44 m Target Targets x y z (a) (b)
Fig. 4. Experimental set up: (a) Sketch of set-up; (b) Intensity data.
of the first type.
The tilt angle is incremented according to the breadth angle of the camera. By breadth angle we mean the interior angle of the plane of light. To determine the breadth angle of the BIRIS scanner, a ruler, larger than the field of view along the x axis, was scanned (see Fig. 5). Along the ruler a set of reflectors were attached at equal intervals. From the pixel position of the top and bottom markers and the value of the spacing between the reflectors, the distance/pixel was calculated to be 2.1739 mm/pixel. This is equivalent to a breadth angle of 17.448 degrees.
IV. MODEL CONSTRUCTION
As mentioned above, two primary steps are followed to obtain a model of the environment: surface extraction where a sequence of algorithms is applied to the data to
Fig. 5. Data used to calculate breadth angle.
find surfaces and surface registration where surfaces are manipulated to obtain a full model that can be displayed. A brief description is included below.
i. Surface extraction
Raw filtering: This is the basic preprocessing applied to
the acquired data. The algorithm starts by transforming the data from a cylindrical coordinate system to a world coordinate system and recording the position of the scan. Then, it checks all range acquisitions and removes the ones that are above a certain user specified range (usually ranges over the calibrated maximum range). The filtering algorithm also removes stray pixels from the image. This entails checking the neighbours of each pixel to determine whether the pixel is surrounded by null values. A decision is then made to remove or keep the pixel.
Data segmentation: Segmentation removes
superfluous data and groups it into regions. The algorithm used on our data is the one published in [6, 7]. After finding the discontinuities in the image, the segmentation of the data proceeds and two files are generated, a label file and a graph file. The label file stores region and intensity information whereas the graph file stores the parametric equations defining the regions in space. Also stored in the graph file are the following values: number of points of the region; itÕs centre of mass; the covariance matrix; the invariant coefficients; the approximation error; and, a list of adjoining neighbours. Fig. 6 depicts the label map after segmentation was applied to the image in Fig. 4. A total of 30 regions were extracted. Each shaded region is defined to be a label and has a corresponding label number. Each label number has a corresponding parametric equation defined in the graph file. Together the two files represent the 3-D image (range and
Fig. 6. Label map, after segmentation, of Fig. 4.
intensity). Since the parametric equations are planar, the image is transformed into a set of planar patches in space.
Region Growing: A program was written to apply
morphological principles to improve the quality of a label image, that is, filling ÔholesÕ or null values that may be present in an image without changing the bitmap characteristics. The null spaces are filled in such a way that the labelled pixels that border them are grown by assuming the value of a neighbouring pixel. To not degrade some of the boundaries that border larger null areas a shrinking process is also used. This is known as dilation followed by erosion (or closing).
Boundary extraction: An edge tracking algorithm is
applied, Fig. 7, to each of the surfaces depicted in the labelled image of the surfaces, Fig. 6. The edge tracking algorithm is an extension of the one developed in [8] in that it computes an estimate for the curvature of the edge as it is tracking the boundary of a surface. The curvature along the edge is computed as a difference in a running average of the gradient values along the
boundary. Currently this filter uses the average of 3 pixel gradient values and appears to be able to filter the majority of large changes in the gradient values which are due primarily to the discretization of the image.
The high curvature points are used to define polygons that will represent the 3-D surfaces. Any sequential set of high curvature points is replaced by a straight line defined by the first and last high curvature points in that segment. The result is a set of polygons whose corners are high curvature points connected by straight lines or low curvature edges. This procedure can be justified by the fact that in most cases these sets of points are associated with fictitious boundaries where the returned signal is not strong enough to be registered. The primary reason for applying this procedure is to reduce the number of points required to represent the boundaries (sometimes by as much as a factor of 10). This leads to an improved performance in visualization and reasoning among the surfaces.
ii. Multi-view Registration
As was mentioned above, indoor environments are large with respect to the field of view of the scanner. Thus multiple images of the environment had to be taken. Ideally, one would like to produce an algorithm that automatically registers the images without significant errors and would eliminate data duplication in the overlapping areas. Much research is presently being done at different organizations, including ours [18 - 23], to achieve this objective.
To obtain a display of the resulting images, we resorted to two methods. The first was to manually position the different images of the environment using a small overlap as guidance. The second method was used when the camera position information was considered accurate (measured by photogrammetric methods, for example). This information was used to calculate the transformation of each image with respect to the previous one and automatically register them. The manual method was used on the results displayed in the next section.
V. RESULTS
Throughout this paper the results of the data processing have been presented using figures. In this section, results of processing 3-D data to build a virtual environment for navigation and visualization are presented. The display of the results is composed of a set of planar surfaces, represented as polygons, in 3-D
space. These polygons are defined using the Virtual Reality Markup Language (VRML).
A set-up in the laboratory that included different partitions and many objects was scanned from three positions 120 degrees apart, covering 360 degrees pan. Each pan position had a corresponding series of 5 tilt scans taken, hence totalling 15 scans. Each set of pan scans ranged from 70 to -70 degrees thus overlapping the adjacent images by 10 degrees. A few degrees of overlap (2 to 3 degrees) also existed between most of the tilt scans. The intensity image from a single pan position and five tilt positions (five images total) is shown in Fig. 8. Each image consists of 256 x 512 data points.
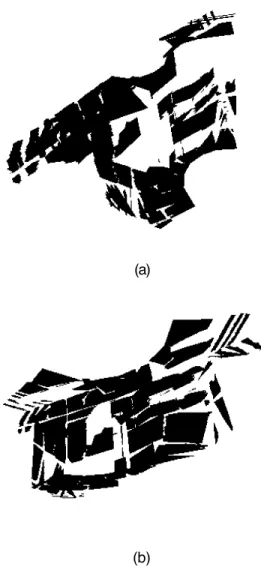
The five images of Fig. 8 were processed (i.e. surfaces extracted), manually registered and formatted in VRML. Fig. 9 (a) displays the resulting image from a point of view that shows the part of the floor that was scanned by the camera; the back of the ceiling can also be seen as the dark surfaces on the top. Fig. 9 (b) displays the same image but from a point of view that shows the part of the ceiling that was scanned; in this case, the back of the floor can be seen. Fig. 10 shows the three processed and registered images of the middle section of the room. The polygons in Fig. 9 and 10 were intentionally left at different levels of gray to better display the results to the reader.
(a)
(b)
Fig. 9. Polygonal representation of five (vertically) registered images showing (a) the floor and (b) the ceiling.
Fig. 10. Polygonal representation of three (horizontally) registered images showing the layout of the lab.
VI. DISCUSSION AND CONCLUSION
BIRIS as a low-cost, medium accuracy, real-time range sensor was found to be a viable sensor for modeling indoor environments. This application requires modeling of large structures and does not need to model intricate details in objects. In addition, BIRIS, with its high immunity to ambient illumination eliminates the problems associated with optically cluttered environments.
The real challenge in indoor environment modeling is in reducing the amount of information that the sensor detects by extracting the key features in the sensory data and grouping the surfaces into larger surfaces with less details. Fig. 9 and 10 are examples of surfaces that have not been grouped together. It is clear from these figures that algorithms are needed to group surfaces that belong to a common plane. Grouping surfaces within an image is an important problem that we are investigating. For an environment modeller to become a viable tool for Computer Aided Design, it is necessary to develop approaches that hypothesize the formation of more composite features from the surfaces. At minimum, it is essential to determine some measure of proximity between non-adjoining surfaces [12] and the possibility of surface to surface intersection so that a better approximation of the surface boundaries can be performed. Also, in environments that are cluttered with objects, it is important to hypothesize on the continuation of surfaces. Previous attempts in this domain have used a set of heuristics to decide what surfaces should be joined. In most circumstances these heuristics are a set of rules with pre-defined thresholds that determines if the surfaces should be joined. Currently we are investigating the use of Bayesian Networks [13] to manage the uncertainty associated with such decisions. A Bayesian Network offers a unified approach to the specification of relationships among surfaces as well as a method for computing a belief value in the existence of a compound feature given the evidence from the sensory data.
Scanning large environments in 3-D allows their representation in a manageable number of images. But this also has its limitations. Since the accuracy of the sensor degrades with distance, the resolution of the acquired data, when scanning a large environment, will differ substantially within a single image and from one image to another. One of the technical problems that still needs to be solved satisfactorily is how to fuse multiple resolution data from different views. Although some manual and semi-automatic solutions exist for
multi-view registration, robust solutions are needed for multi-view registration with sensory error.
APPENDIX A
Characteristics of the prototype of the BIRIS range sensor used for this research are:
Measurement range: 0.5 - 4 m Accuracy (rms): 1 mm @ 1.2 m
2 mm @ 2 m Focal length: 30 mm Field of view 18 deg Acquisition time 1/60 sec Points per line 256 Laser power 24 mW Eye safe distance > 50 cm
ACKNOWLEDGMENT
The authors would like to thank P. Boulanger, D. Green and D. Taylor for their support and helpful discussions.
REFERENCES
[1] F. Blais, M. Rioux, and J. Domey, ÒOptical range image acquisition for the navigation of a mobile robot,Ó IEEE International Conference on
Robotics and Automation, Sacramento, CA. April 9-11, 1991, Vol. 3,
pp. 2574-2580. NRC 31787.
[2] Directed Perception, Inc. (1994), Computer Controlled Pan-Tilt Unit
(Model PTU) UserÕs Manual , Version 1.07 b (Preliminary), Directed
Perception publication, Burlingame, CA.
[3] H. Freeman, editor, Machine Vision for Three-dimensional Scenes, Academic Press, New York, 1990.
[4] M. Suk and S. M. Bhandarkar, Three-dimensional Object Recognition from range images, Computer Science Workbench, Springler-Verlag, New York 1992.
[5] N. Ayache, Artificial vision for mobile robots: stereo vision and
multisensory perception, MIT Press, Cambridge, MA, 1991.
[6] H. Yao, R. Podhorodeski, and Z. Dong, ÒA cross-section based multiple-view range image fusion approach,Ó Proceedings of the SPIE:
Sensor Fusion and Aerospace Applications, Vol. 1956, pages
212--223, 1993.
[7] Z. Zhang and O. D. Faugeras, 3-D Dynamic Scene Analysis: A Stereo
Based Approach , Springer Series in Information Sciences,
Springer-Verlag, Berlin,1992.
[8] V. Conan, P. Boulanger, and S. Elgazzar, ÒRobust position estimation of a mobile vehicle,Ó Proceedings of Europto Conference , Frankfurt, Germany, June 20-24, 1994, Vol. 2247, pp. 37-46. NRC 37130.
[9] F. Nashashibi and M. Devy, Ò3-D incremental modeling and robot localization in a structured environment using a laser range finder,Ó
Proceedings of the 1993 IEEE International Conference on Robotics and Automation, pp. 20-27, Atlanta, GA, May 1993.
[10] V. Sequeira, J. G. M. Goncalves, and M. I. Ribeiro, Ò3-D scene modelling from multiple view,Ó Proceedings of SPIE:
videometrics IV, Vol. 2598, pp. 114-127, Philadephia, Pa., October
25-26, 1995.
[11] J. Hoshino, T. Uemura, and I. Masuda, ÒRegion-based reconstruction of an indoor scene using an intergration of active and passive sensing techniques,Ó IEEE Third International Conference
on Computer Vision , pp. 568--572, Osaka, Japan, December 4-7.
1990.
[12] R. Liscano, S. Elgazzar and A.K.C. Wong, Ò A Proximity compatibility function among 3-D surfaces for environment modeling,Ó unpublished (IASTED Fifth International Conference on
Robotics and Manufacturing, Cancun, Mexico, May 29-31, 1997).
[13] R. Liscano, S. Elgazzar and A.K.C. Wong, ÒUse of belief networks for modeling indoor environments,Ó Vision Interface '97 , Kelowna, B.C., Canada, May 19-23, 1997, in press. NRC 40174.
[14] F. Blais, M. Lecavalier and J. Bisson, ÒReal-time processing and validation of optical ranging in a cluttered environment,Ó International
Conference on Signal Processing Applications & Technology,
Boston, MA, USA, October 7-10, 1996, Vol.2, pp. 1066-1070. NRC 40147.
[15] P. Boulanger and F. Blais, ÒRange image segmentation, free space determination, and position estimate for a mobile vehicle,Ó SPIE
Proceedings on Mobile Robots VII, Boston, MA, USA, November
18-20, 1992, Vol. 1831, pp. 444-455. NRC 35042.
[16] P. Boulanger and P. Cohen, ÒViewpoint invariant computation of surface curvatures in range images,Ó Vision Interface '94, Banff, Alberta, Canada, May 16-20, 1994, pp. 145-154. NRC 37120. [17] Q. Gao and A.K.C. Wong, ÒCurve detection based on perceptual
organization,Ó Pattern Recognition, 26(7), 1993, pp. 1039-1046. [18] G. Godin, M. Rioux, and R. Baribeau, Ò3-D registration using range
and intensity information,Ó SPIE Proceedings, Videometrics III,
International Symposium on Photonic and Sensors and Controls for Commercial Applications, Boston, MA, October 31 - November 4,
1994, Vol. 2350, pp. 279-290. NRC 38303.
[19] N. Burtnyk and M. Greenspan, ÒMultiple view registration of range data using signature search,Ó Proceedings of the American Nuclear
Society Sixth Topical Meeting on Robotics and Remote Systems,
Monterey, CA, February 5-10, 1995, Vol. 2, pp. 745-753. NRC 38316.
[20] G. Godin and P. Boulanger, ÒRange image registration through viewpoint invariant computation of curvature,Ó ISPRS
Intercommission Workshop: From Pixels to Sequences , Zurich,
Switzerland, March 22-24, 1995, pp. 170-175. NRC 38361. [21] D. Laurendeau, G.Roth, and L.Borgeat, ÒOptimisation algorithms for
range image registration,Ó Proceedings of Vision Interface '96 , Toronto, Ont. May 21-24, 1996, pp. 141-151. NRC 39238.
[22] E. Gagnon, J.-F.Rivest, M. Greenspan, and N. Burtnyk, ÒA computer assisted range image registration system for nuclear waste cleanup,Ó Proceedings of the IEEE Instrumentation, Measurement
and Technology Conference (IMTC '96), Brussels, Belgium, June
4-6, 1994-6, Vol.1, pp.106-110. NRC 40156.
[23] G. Godin, M. Soucy, and P. Boulanger, ÒRange image integration for direct replication of objects,Ó Proceedings of SPIE: Rapid Product
Development Technologies, Boston, MA, USA, November 18-19