Publisher’s version / Version de l'éditeur:
ASHRAE Transactions, 108, Pt. 2, pp. 849-857, 2002
READ THESE TERMS AND CONDITIONS CAREFULLY BEFORE USING THIS WEBSITE. https://nrc-publications.canada.ca/eng/copyright
Vous avez des questions? Nous pouvons vous aider. Pour communiquer directement avec un auteur, consultez la Questions? Contact the NRC Publications Archive team at
PublicationsArchive-ArchivesPublications@nrc-cnrc.gc.ca. If you wish to email the authors directly, please see the first page of the publication for their contact information.
NRC Publications Archive
Archives des publications du CNRC
This publication could be one of several versions: author’s original, accepted manuscript or the publisher’s version. / La version de cette publication peut être l’une des suivantes : la version prépublication de l’auteur, la version acceptée du manuscrit ou la version de l’éditeur.
Access and use of this website and the material on it are subject to the Terms and Conditions set forth at
Preliminary investigations of smoke movement through HVAC systems
and duct smoke detectors
Lougheed, G. D.; McCartney, C. J.; Carpenter, D. W.
https://publications-cnrc.canada.ca/fra/droits
L’accès à ce site Web et l’utilisation de son contenu sont assujettis aux conditions présentées dans le site LISEZ CES CONDITIONS ATTENTIVEMENT AVANT D’UTILISER CE SITE WEB.
NRC Publications Record / Notice d'Archives des publications de CNRC:
https://nrc-publications.canada.ca/eng/view/object/?id=0810b2bf-5141-441a-af81-101ad0af5cca https://publications-cnrc.canada.ca/fra/voir/objet/?id=0810b2bf-5141-441a-af81-101ad0af5ccaPreliminary investigations of smoke movement
through HVAC systems and duct smoke detectors
Lougheed, G.D.; McCartney, C.; Carpenter, D.W.
NRCC-46405
A version of this document is published in / Une version de ce document se trouve dans :
ASHRAE Transactions, v. 108, pt. 2, 2002, pp. 849-857
© 2002, American Society of Heating, Refrigerating and Air-Conditioning Engineers, Inc. (www.ashrae.org). Reprinted by permission from ASHRAE Transactions 2002, Volume 108, Part 2. This paper may not be copied nor distributed in either paper or digital form without ASHRAE's permission.
ABSTRACT
A project was initiated to investigate concerns regarding the application of duct smoke detectors (ASHRAE RP-1079). The objective of the research was to investigate the effects of driving forces, dilution, aging, smoke stratification, filters, and sample tube efficacy on smoke detector response. As one part of this project, a series of full-scale fire tests were conducted in a ten-story facility. This paper describes the full-scale test facility and provides preliminary results regarding smoke movement through an HVAC system and the operation of duct smoke detectors.
INTRODUCTION
The fire hazards associated with air moving systems in buildings and the underlying approaches for fire safety of heat-ing, ventilatheat-ing, and air-conditioning (HVAC) systems were reviewed by Klote (1993). In principle, protection is needed from the spread of fire and smoke due to fires both inside and outside of the HVAC system. Various smoke management approaches to minimize fire spread through the HVAC system and to limit smoke production and smoke transport are provided in NFPA 90A (1999), NFPA 92A (2000a), and NFPA 92B (2000b). Detailed design considerations and engineering principles for smoke management systems are given in Klote and Milke (1992).
The National Board of Fire Underwriters (NBFU 1939) recommended the shutdown of the HVAC system during a fire. For many years, this was the standard approach for preventing smoke transport by the HVAC system. In recent years, the operation of the HVAC system as a smoke control system has become a common alternative (Klote 1993).
NFPA 90A (1999) requires that duct smoke detectors be installed in HVAC systems. The purpose of the duct smoke detector is to provide for the shutdown of the HVAC system in the event of a fire to avoid actively recirculating smoke through a building.
Extensive research has been conducted in the area of fire detection (Grosshandler 1995, 1997; Mulholland 1995; Schi-filiti et al. 1995). Nevertheless, little work has been conducted into the effectiveness of duct smoke detectors. In light of the lack of research, there has been only anecdotal evidence of their efficacy (Wolin et al. 2001). Recently, a project was initi-ated to investigate concerns regarding the application of duct smoke detectors (ASHRAE RP-1079). The objective of the research was to investigate the effects of driving forces, dilu-tion, aging, smoke stratificadilu-tion, filters, and sample tube effi-cacy on smoke detector response. As part of this project, a literature review, small-scale fire tests, and modeling studies were conducted. Wolin et al. (2000) and Milke et al. (2002) provide results from these studies.
Also, as part of the project, the National Research Council Canada (NRC) conducted a series of full-scale fire tests in its ten-story facility. This paper describes the full-scale test facil-ity and provides preliminary results regarding smoke move-ment through the HVAC system and the operation of duct smoke detectors.
TEST
The full-scale fire tests utilized a ten-story tower facility that is part of the full-scale fire test facilities located near Almonte, Ontario. This facility was designed to represent conditions of a high-rise building. It has been used extensively for studies on smoke movement (Said and McDonald 1991; Hokugo et al. 1995; Lougheed and Carpenter 1997) and smoke control systems (Klote and Milke 1992; Tamura 1994).
Preliminary Investigations of Smoke
Movement Through HVAC Systems and
Duct Smoke Detectors
Gary D. Lougheed, Ph.D.
Cameron McCartney
Don W. Carpenter
Member ASHRAE
Gary Lougheed is a senior research officer, Cameron McCartney is a technical officer, and Don Carpenter is a senior technical officer in
the Fire Risk Management Program, Institute of Research in Construction, National Research Council of Canada, Ottawa, Ontario.
850 ASHRAE Transactions: Symposia
This ten-story facility includes an experimental tower and an attached observation tower. The typical floor height is 2.4 m except for the first and second floors, which are 3.4 m. Both towers are constructed of 200 mm thick monolithic reinforced concrete. A plan view of a typical floor is shown in Figure 1. The observation tower contains a freight elevator, stair-way, and a workspace for instrumentation and data acquisi-tion. It is protected from the experimental section by a firewall and fire doors with small fixed wired-glass windows. An inde-pendent air system maintains a comfortable temperature in winter and pressurizes the observation tower to prevent ingress of combustion products from the experimental tower. The experimental tower contains all the shafts and other features necessary to simulate air and smoke movement patterns in the center core of a typical multistory building, including the elevator, stair, smoke exhaust, service, and supply and return air shafts. The elevator and stair shafts are full-sized, but the elevator shaft has no car or hoisting appa-ratus. The stair shaft is equipped with a standard staircase.
A surrounding corridor isolates the shafts from the exte-rior walls, creating a typical building center core (Figure 1). All joints in the concrete structure were sealed to minimize uncontrolled air leakage. The exterior walls and walls of verti-cal shafts were provided with variable openings that can be set to provide leakage areas of typical buildings.
A separate structure, adjacent to the tower, houses the air moving and heating plant; the air ducts are connected under-ground to the main test facility through a short tunnel. Two separate HVAC systems are available. The first system handles the main air supply and heating load and includes all the elements of a building HVAC system, including return and supply fans, filters, etc. This system normally operates in the recirculation mode, but it can be operated with 100% outside air and used to pressurize the entire building.
The second air-handling system supplies outside air either to the experimental stair and elevator shafts or to the vestibules located between the entrances to these shafts and the fire test area. This system was not used as part of this project.
The airflow rates in the air ducts were measured with either multipoint self-averaging total pressure tubes and their associated static pressure taps or with an orifice plate. All were calibrated using the pitot traverse method.
For this project, only the first air-handling system was used. This system includes a variable-speed return air fan with a maximum capacity of 17 m3/s, which was connected to the return airshaft in the test facility. A variable-speed supply air fan with a maximum capacity of 14 m3/s was connected to the supply airshaft in the building. These shafts are located on the north side of the center core (see Figure 1).
TEST CONFIGURATION FIRE FLOOR
The tower facility has been used predominantly for inves-tigations related to smoke control systems. As such, the mechanical systems were primarily set up to supply or exhaust air from various parts of the building such as the stair shaft or the elevator shaft. These test arrangements were used to simu-late operating smoke control systems.
In the basic configuration for smoke control investiga-tions, the supply and return airshafts were linked to each floor through simple openings in the shaft walls. For this project, supply and return air ducts were installed in the corridor on the first floor. (The first and second floors have nominal ceiling heights of 3.4 m compared with 2.4 m on all other floors. This provides room to install ductwork and a drop ceiling at the 2.6 m height simulating a corridor in an office building.)
A fire room was set up at the south end of the east corridor (Figure 2) on the first floor of the test facility. The fire test room was approximately 4.1 m by 2.3 m by 2.6 m high, simu-lating a standard office.
The fire room was connected to a corridor (Figure 2) through a 0.93 m by 2.13 m high doorway. The corridor extended around three sides of the center core of the test facil-ity. It was approximately 1.2 m wide and had a total length of 25 m. A suspended ceiling was installed at the 2.6 m height. The floor area and the volume of the fire room and the corridor are given in Table 1.
Supply and return air ducts were installed above the suspended ceiling in the corridor. These two duct systems were connected to the building supply and return shafts.
Air was supplied to the fire room from the supply duct through an outlet at the center of the ceiling. No return air inlet was provided in the test room. This simulates a typical arrangement for an HVAC system in buildings with separate offices. That is, a system in which air is supplied to the office space and the inlets for the return air system are in the common corridor connecting the offices.
Secondary ducts were connected to the supply duct in each section of the corridor. These ducts extended through the ceiling and had outlets located approximately 550 mm above the floor. These ducts were used to simulate airflow reaching the corridor through vents in office doors.
Return air inlets were located in the corridor ceiling in each section of the corridor and connected to the return air duct. The return air inlets and the supply air outlets were equi-spaced in each corridor. However, their locations were offset to ensure mixing of the air in the corridor.
TEST CONFIGURATION NONFIRE FLOORS
The test facility consists of ten floors. However, two floors (Floors 2 and 7) were fire-hardened for previous test programs. As a result, it was difficult to access the HVAC shafts on these floors and they were not included in the final test setup. These floors also contained significant amounts of particulate matter from previous testing that may affect the duct smoke detectors.
Floors 3 through 6 and 8 through 10 were used as the nonfire floors. The floor area and volume for each floor are given in Table 1. The total floor area and volume for the test arrangement, including the two HVAC shafts, are also shown. Ductwork was not installed on the nonfire floors. The openings in the shaft walls were used to provide airflow to and from each floor. The door in the north corridor (Figure 1) was closed for all the tests ensuring the airflow mixed throughout each floor. Dampers on the fire floor supply ducts were used to balance the supply airflow evenly throughout the floor area. The openings to the shafts on each floor were then adjusted to provide a balanced airflow to each nonfire floor.
DETECTOR LOCATIONS
Seven models of commercially available duct smoke detectors were used in the project. They included two ioniza-tion, two photoelectric, one photoelectric/thermal, one inte-grated (ionization, photoelectric, and thermal), and one sampling. Duct smoke detectors were located at three primary locations in the HVAC system ductwork:
1. Measuring Station 1. Measuring Station 1 (MS1) was
located in the return air duct on the fire floor at the connec-tion to the return shaft. This locaconnec-tion was used to provide information on the ability of the detectors to detect smoke on the fire floor. An ionization and a photoelectric detector were mounted at this location.
2. Measuring Station 2. Measuring Station 2 (MS2) was
located in a section of the return air duct in the mechanical room. A sample of each detector model and type used in the project was mounted at this location.
3. Measuring Station 3. Measuring Station 3 (MS3) was
located in a section of the supply air duct. A sample of each detector model and type was used at this location. 4. In addition to the detectors located at the three primary
measuring stations, ten detectors (identical model and type) were located in a straight section of the return air duct in the mechanical room. These detectors were at five locations along the length of the duct starting upstream of an elbow. The sampling tubes for the two detectors at each location were on the vertical and horizontal centerline of the duct, respectively. These detectors were used to investigate the effect of smoke stratification.
INSTRUMENTATION
The following instrumentation was used in the full-scale fire tests:
1. Temperature in fire room. Two thermocouple trees were
located in the fire room to measure the temperature profiles during the test. The thermocouples were located 450, 770, 1050, 1650, 1940, 2240, and 2550 mm above the floor. In addition, four thermocouples were mounted 150 mm below the ceiling at the room quarter points, and one thermocou-ple was at the center top of the doorway 40 mm below the top of the opening.
2. Temperature in the corridor. Three thermocouple trees
were located at the midpoint of each section of the corridor. The thermocouple heights were the same as those used in the fire room.
3. Pressure differences. Pressure differences were measured
at the following locations: (a) south wall of the fire room 150 mm below the ceiling (average of three equispaced taps), (b) first floor corridor 150 mm below ceiling, (c) first floor corridor at 1.2 m height, (d) supply duct leading to the fire room, (e) return duct at the shaft connection, (f) supply duct at the shaft connection, (g) exterior of the building in
TABLE 1
Floor Area and Volumes in Test Arrangement
Location Floor Area (m2)
Volume (m3)
Fire room 9.4 27.3
Corridor fire floor 28.9 77.8 Total fire floor 38.3 105.1
Nonfire floor 69.5 169.4 HVAC shafts 4.0 119.0 Total test arrangement 532.8 1528.9
852 ASHRAE Transactions: Symposia
the west wall, (h) return shaft at second floor level, and (i) return shaft at the tenth floor. These measurements will be used to investigate the relative effect of the pressures produced by the fire on smoke movement compared with smoke movement due to the HVAC system.
4. Air velocities and temperatures in ducts. Bidirectional
probes were used to measure the velocities in the return duct on the fire floor and the return duct in the mechanical room and in the main supply duct). Bidirectional probes were also installed in the supply duct to the test room and the supply duct at the connection to the main supply shaft. These probes were oriented to measure the velocity in the opposite direction to the normal airflow (i.e., they measure smoke flow produced in the duct by the fire). The temperature was also measured at all locations at which pitot static probes were installed.
5. Smoke obscuration. Smoke density meters were used to
measure the smoke optical density in the ductwork at Measuring Stations 1 and 2.
6. Carbon dioxide concentration. Gas analyzers were used to
measure the concentration of carbon dioxide in the fire room doorway and at Measuring Stations 1 and 2. In addi-tion, an oxygen analyzer was used to measure the concen-tration of oxygen at Measuring Station 1. This measurement was used to estimate the heat release rate for the test fires.
A data acquisition system was used to record the data from the instrumentation noted above. In addition, the analog outputs of the duct smoke detectors were recorded using data acquisition systems and software provided by the detector manufacturers.
FIRE SOURCES
The test arrangement discussed in this paper was devel-oped specifically to investigate smoke movement in the HVAC system and issues related to the effectiveness of duct smoke detectors. In order to provide baseline data on smoke move-ment in the test arrangemove-ment and in the HVAC system, a set of propane burners was used for a series of initial tests. The propane burner system was selected since it could provide steady well-controlled heat release rates over an extended time period. These tests also provided data for use in investigating the relative magnitude of pressures that affect smoke move-ment in the test facility.
Based on the results from the propane burner tests, it was determined that steady fires with a heat output of approxi-mately 100 to 200 kW would produce fire conditions appro-priate for this study. Initial tests were conducted using a calorimeter facility to investigate potential fuels, including paper, clothing, polyurethane foam, and heptane pan fires that could be used for the full-scale tests. Based on these tests, it was determined that relatively steady fires with a duration of 10 to 20 min and with heat release rates of 100 to 200 kW could be obtained using clothing or polyurethane foam as a fuel. These fuels were used for the tests in the tower facility discussed in this paper.
The fuel sources for the tests are shown in Table 2.
PROPANE BURNER FIRE TESTS
Five tests were conducted using propane burners as the fire source. The test arrangement for the HVAC system for these tests is summarized in Table 3.
For Tests 8 and 9 with the propane burner and Tests 12 to 15 with other fuel sources, the openings in the return and supply shafts on the nonfire floors were adjusted to provide a balanced airflow to these floors. It was also intended that the same airflow be provided to the fire floor. However, a prelim-inary analysis of the test data indicated that the airflow on the fire floor was lower than expected. This was confirmed with measurements using a hot-wire anemometer. The airflow shown in Table 3 for Tests 8 and 9 are the measured capacities. For subsequent tests with the propane burner and other fuels (Tests 16-23), the airflow to all floors, including the fire floor, were measured using a hot-wire anemometer to provide a balanced airflow to all floors.
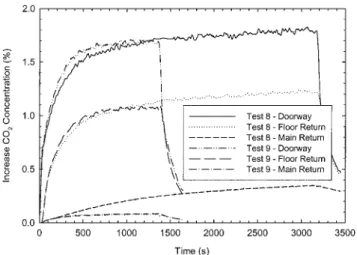
In both Tests 8 and 9, the propane burner was used to provide a steady heat release rate of 100 kW for extended test durations. In Test 8, the HVAC system was operated in full recirculation mode. In Test 9, the system was operated with 100% exhaust of the return air and 100% fresh air for the supply system.
The CO2 concentrations measured in the doorway of the
fire room and at Measuring Stations 1 and 2 are shown in Figure 3. The background CO2 concentration was subtracted
from the measured results. The plots shown in Figure 3 are the increase in CO2 concentrations due to the propane fire.
TABLE 2 Fuel Sources for Tests
Test Fuel 7-9, 12, 16, 19, 23 Propane 13, 17, 21 Clothing 14, 18, 20, 22 Polyurethane foam 15 Heptane TABLE 3
HVAC Flow Rates for Tests
Test Fire Floor Nonfire Floor Total (m3/s) (m3/s) (m3/s)
8-15 0.36 0.66 4.95
16-18 0.67 0.61 4.95
19-21 0.45 0.45 3.61
For Test 9, there was an initial increase in the gas concen-trations at the three locations. Subsequently, the CO2
concen-trations reached steady state.
Figure 4 shows a regression fit to the CO2 concentrations
measured in the return system in Test 9 using a two-parameter exponential rise to a maximum (Equation 1).
C = A(1-e-Bt)(1) where C = CO2 concentration, %; A = maximum CO2 concentration, %; B = time constant, s-1; t = time, s.
The calculated parameters for the two regression fits shown in Figure 4 are given in Table 4.
The ratio of the maximum concentrations measured at Measuring Stations 1 and 2 (AMS1/AMS2) is approximately 13.
This is equivalent to the relative rate of air provided by the HVAC system to the seven nonfire floors to that provided to the fire floor. That is, the difference in CO2 levels measured at
the two locations is the result of dilution with fresh air in the return airshaft, resulting in a 92.4% reduction in the CO2
levels.
The CO2 concentrations measured in Test 8 are also
shown in Figure 3. There was a continual increase at all three locations until the propane burner was shut off. However, the most noticeable effect was in the CO2 levels measured in the main HVAC return duct in the mechanical room.
The relative impact of the recirculated fire gases is also demonstrated by the calculated parameters given in Table 4 for fits using Equation 1. For the concentrations at Measuring Station 1, the fit parameters for Test 8 are comparable to those for Test 9. The small differences in the calculated parameters are consistent with the recirculation of relatively dilute fire gases back to the fire floor.
The fit parameters calculated for the concentrations measured in the main mechanical system indicate a slow increase in CO2 levels throughout the test. At the end of the
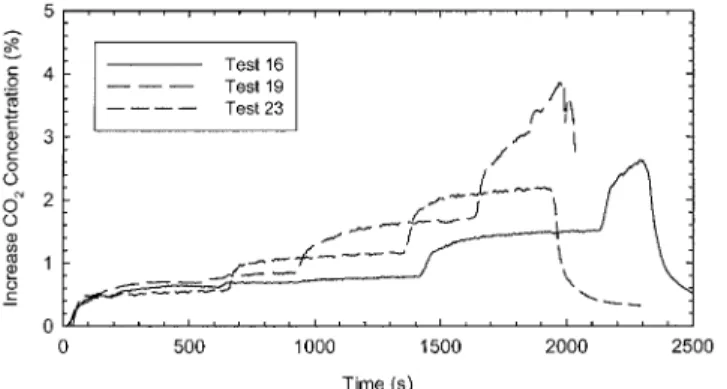
test, the concentration in the main return system has reached approximately 32% of that measured in the return duct on the fire floor compared with 7.6% in the initial stages of the test. Tests 16, 19, and 23 were also conducted with the propane burner. In these tests, the fire size was varied during the test to produce three steady-state heat release rates of 100, 250, and 500 kW. In addition, the total airflow provided by the HVAC system was varied.
In Test 16, the airflow was the same as that used in Tests 8 and 9. However, in this test, the same airflow was provided to all floors (Table 3). For Tests 19 and 23, the total HVAC airflow was decreased and increased by 27% and 35%, respec-tively, compared with Test 16.
The increase in CO2 measured at Measuring Stations 1
and 2 are shown in Figures 5 and 6, respectively. In addition, the calculated parameters AMS1 and BMS1 for exponential increase to a maximum are given in Table 5. These parameters were calculated using the data for the initial 500 s of the test. Some general trends are as follows:
1. With increased airflow to the fire floor, the CO2 levels at
Measuring Station 1 decreased (a similar decrease was also noted in the levels measured in the doorway). These results suggest that, with lower ventilation rates for the fire floor, both fresh and contaminated air was drawn into the fire
Figure 3 Increase in carbon dioxide concentrations for Tests 8 and 9.
Figure 4 Regression fits to CO2 concentrations for Test 9.
TABLE 4
Parameters for Exponential Increase of CO2 Concentration at Measuring
Stations 1 and 2 for Tests 8 and 9
Test AMS1 BMS1 AMS2 BMS2 (%) (s-1) (%) (s-1)
8 1.08 0.0043 0.488 0.0005 9 1.07 0.0048 0.08 0.0038
854 ASHRAE Transactions: Symposia
room to produce increased CO2 concentrations. This effect
is also shown in the higher heat release portions of Test 19, resulting in more rapid increases in CO2 levels (Figure 5). 2. Also, with increased airflow to the fire floor, steady
condi-tions were reached earlier, as indicated by the higher values for BMS1.
3. The increase in CO2 levels at Measuring Station 2 followed the changes in heat release rate and the increase in CO2 levels measured in the floor duct. Initially, the amount of CO2 at Measuring Station 2 was approximately 14% of the
levels at Measuring Station 1. This is consistent with the level of dilution in the main return shaft for these tests. Although the total airflow was varied, the ratio of airflow to the nonfire floors versus the airflow to the fire floor was approximately 7:1 in all tests.
4. Subsequent to the initial increase in CO2 levels with
changes in the fire size, there was a continuous increase in the concentrations at Measuring Station 2 as the contami-nated air was recirculated throughout the test facility. During the steady heat release rate periods, the increase in CO2 levels was comparable in the three tests (Figure 6).
FIRE TESTS WITH CLOTHING AND POLYURETHANE FOAM
Fire tests were conducted using clothing and polyure-thane foam as fuel sources (Table 2). The setup of the HVAC system for the tests is shown in Table 3. All tests were conducted with the HVAC system operating in the full recir-culation mode.
By using thick fuel beds, these fuel sources provided extended fire duration with relatively steady heat release rates and smoke production. The heat release rates were approxi-mately 100 and 200 kW for polyurethane foam and clothing fires, respectively.
Identical ionization and photoelectric detectors were located at the three measuring stations in the HVAC system. The detector responses measured at these three locations for tests with polyurethane foam and clothing are shown in Figures 7 and 8. (Each detector model has a different output. To facilitate data analysis, the detector responses were normal-ized. First, the baseline output was subtracted from the detec-tor data. Subsequently, the data were divided by the difference between the maximum and baseline outputs to determine the detector response as a percent of the maximum output.)
Figure 5 Increase in CO2 concentrations in return duct on fire floor for Tests 16, 19, and 23.
Figure 6 Increase in CO2 concentrations in main HVAC return duct for Tests 16, 19, and 23.
TABLE 5
Parameters for Exponential Increase of CO2 Concen-tration at Measuring Station 1 for Tests 16, 19, and 23
Test AMS1 BMS1
(%) (s-1)
16 0.63 0.0092
19 0.71 0.0093
23 0.53 0.0124
Figure 7 Response of detectors at Measuring Stations 1, 2, and 3 for Test 14 with polyurethane foam.
For the polyurethane foam fire (Test 14), the peak outputs for both detectors were at or near 100% in the return duct on the fire floor (MS1). With the dilution in the main return shaft, the outputs were reduced to 20% to 30% (MS2). There was a further reduction in the output to 12% to 20% for the detectors in the supply duct (MS3) . (The tests were conducted with commercial fiberglass filters installed in the HVAC system between the MS2 and MS3.)
For Test 14, slightly higher initial responses were measured with the ionization detectors. Also, these detectors were slower in decreasing to minimal response after the fire. For the clothing tests, the initial response of the ionization detector was significantly higher than that for the photoelec-tric detector in the return duct on the fire floor (MS1). However, the initial outputs at the other two locations were comparable. In fact, the output of the photoelectric detector was higher than that for the ionization detector in the main return duct (MS2).
After 400 s, the outputs for the detectors in the main HVAC system showed a steady increase. This can be attributed in part to the recirculation of smoke through the HVAC system. However, in the later stages of the test, the output of the photoelectric detector increased more rapidly than the ionization detectors with the detector at MS1 eventually reaching the 100% level at approximately 1700 s. Since a simi-lar change in response occurred for all of the photoelectric detectors, it can be assumed it was due to changes in the test dynamics.
As noted above, there were some differences in the responses of the two types of detectors. However, in general, the responses of the ionization and photoelectric detectors were comparable, particularly for the diluted smoke in the main HVAC system.
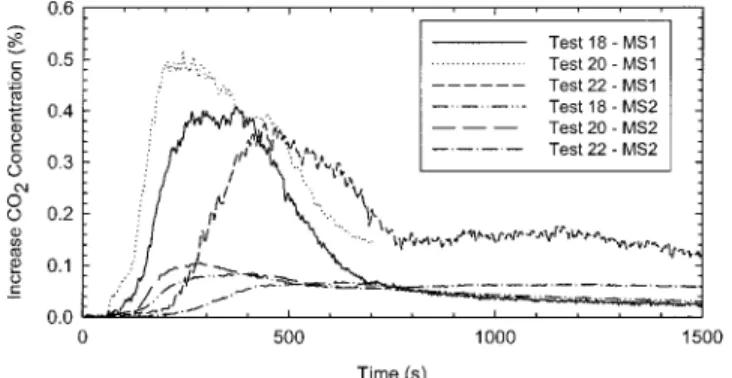
Figures 9 and 10 show the photoelectric detector responses in the return duct on the fire floor (MS1) and in the main return duct (MS2) for tests with polyurethane foam. The CO2 concentrations measured at these two locations for Tests
18, 20, and 22 are shown in Figure 11. Also, the smoke optical density measured in the main return duct is shown in Figure 12.
The CO2 levels in the main return duct were approxi-mately 15% to 20% of that measured in the return duct on the fire floor (Figure 11). This is consistent with the expected change due to the approximately 7:1 dilution factor (86% decrease).
Figure 8 Response of detectors at Measuring Stations 1, 2,
and 3 for Test 13 with clothing. Figure 9
Response of photodetectors at Measuring Station 1 for tests with polyurethance foam.
Figure 10 Response of photodetectors at Measuring Station
856 ASHRAE Transactions: Symposia
The detector responses shown in Figures 9 and 10 were consistent with the test-to-test variations in the fire and HVAC system:
1. The highest change in detector response at the two measur-ing locations was for Test 14 in which the smoke dilution in the main return shaft was approximately 13:1.
2. The fire development in Test 22 was affected by the air supply through the inlet in the ceiling of the fire room. With the higher supply airflow used in this test, there was direct airflow onto the fuel surface. This resulted in a slower development of the fire and a delay in smoke production that was reflected in the detector responses.
3. Less fuel was used in Test 14, resulting in shorter test dura-tion. This resulted in more rapid decrease in the output of the detector on the fire floor. The continued output for the detector in the main return duct can be attributed to the recirculation of the smoke through the test facility.
The responses of the detectors located in the main return duct were also consistent with the smoke optical density results shown in Figure 12. Specifically, the maximum detec-tor response depended on the test-to-test variation in optical density. Also, the general dynamics of the smoke detector response was similar to the optical density results.
For the tests with polyurethane foam, the maximum detector responses ranged between approximately 20% and 60%. For these same tests, the measured optical density ranged between approximately 0.02 and 0.08 m-1. Using the relationship between visibility and optical density given by Tamura (1994) for front illuminated signs,
Visibility (m) = 1/optical density (m-1) , (2) the visibility in the smoke in the main HVAC system in these tests ranges from 12.5 m to 50 m.
CONCLUSIONS
For the tests discussed in this paper, a ten-story test facil-ity was set up to simulate smoke movement through a building HVAC system. In order to minimize parameters, the test arrangement was reduced to four primary components: 1. the fire room
2. the corridor on the fire floor 3. the HVAC system
4. compartments on seven nonfire floors
The only path for smoke and airflow between the fire floor and the other floors was through the HVAC system.
Steady heat release tests were conducted with a propane burner to investigate smoke movement in the test arrangement. These tests indicated that the fire size and the airflow rate provided by the HVAC system affected the smoke dynamics on the fire floor. With low HVAC airflow, there was increased contamination of the air in the corridor, resulting in higher CO2 levels in the return duct on the fire floor. With higher airflow, the contaminated air was mixed more rapidly into the return duct on the fire floor. However, the maximum concen-trations were lower as a result of higher dilution in the corridor. The CO2 concentrations measured in the main return duct initially increased at the same rate as in the return duct on the fire floor. However, the air from the seven nonfire floors diluted the contaminated air, reducing the concentrations. With the HVAC system operated in full recirculation mode, the concentrations in the main HVAC system continued to increase as the contaminated air mixed throughout the facility. The results of tests with polyurethane foam and clothing indicate that there were some differences in the responses produced by photoelectric and ionization detectors. However, for the diluted smoke in the main HVAC system, the outputs of the two detectors were comparable.
For the tests with polyurethane foam, the outputs of the detectors varied with the changes in fire dynamics and the HVAC setup. In particular, the detector responses were consis-tent with the variations in the smoke optical density. The
Figure 11 CO2 concentrations in return duct fire floor (MS1) and in main return duct (MS2) for tests with polyurethane foam.
Figure 12 Smoke optical density in main return duct (MS2)
results indicate that the detectors are responding to smoke with visibility in the range of 10 to 50 m. This visibility range over-laps with the visibility levels suggested for smoke control and smoke management applications (Tamura 1994).
ACKNOWLEDGMENTS
This work was funded by the Fire Detection Institute (FDI). The suggestions, comments, and contributions of John Cholin and the FDI members are greatly appreciated. As part of the FDI project, the University of Maryland conducted a literature review, small-scale fire tests, and modeling studies that provided invaluable information for the full-scale fire tests undertaken in this project. The authors would also like to acknowledge the support of Mickey Ryan, Michael Wright, Vic Fortington, and Bruce Taber in setting up the test arrange-ment and conducting the tests.
REFERENCES
Grosshandler, W.L. 1995. Proceedings of the 1995 Workshop
on Fire Detector Research, NISTIR-5700. Gaithersburg,
Md.: National Institute of Standards and Technology. Grosshandler, W.L. 1997. Progress report on fire detection
research in the United States, U.S./Japan Government Cooperative Program on Natural Resources (UJNR), 13th Joint Panel Meeting, March 13 – 20, 1996, Gaith-ersburg, Md., Vol. 2, Beall, K.A., ed., pp. 363-369. Hokugo, A., D. Yung, and G.V. Hadjisophocleous. 1995.
Experiments to evaluate the NRCC smoke movement model for risk-assessment. Proceedings of the Fourth
International Symposium, International Association for Fire Safety Science, Ottawa, pp. 805-816.
Klote, J.H. 1993. Air moving systems and fire protection, NISTIR 5227, Gaithersburg, Md.: National Institute of Standards and Technology.
Klote, J.K., and J.A. Milke. 1992. Design of Smoke
Manage-ment Systems. Atlanta: American Society of Heating,
Refrigerating and Air-Conditioning Engineers, Inc. Lougheed, G.D., and D.W. Carpenter. 1997. Full-scale fire
tests for sprinklered offices in a high rise building.
Pro-ceedings Second International Conference on Fire Research and Engineering, Gaithersburg, Md., pp.
475-488.
Milke, J.A., J.L. Torero, and F.W. Mowrer. 2002. Use of optical density-based measurements as metrics for smoke detectors. ASHRAE Transactions, Volume 108.
Mulholland, G.W. 1995. Smoke production and properties.
SFPE Handbook of Fire Protection Engineering, 2d ed.,
Quincy, Mass.: National Fire Protection Association. NFPA. 1999. NFPA 90A, Standard for the installation of air
conditioning and ventilating systems. Quincy, Mass.:
National Fire Protection Association.
NFPA. 2000a. NFPA 92A, Recommended practice for
smoke-control systems. Quincy, Mass.: National Fire
Protection Association.
NFPA. 2000b. NFPA 92B, Guide for smoke management
sys-tems in malls, atria, and large areas. Quincy, Mass.:
National Fire Protection Association.
NBFU. 1939. Smoke hazards of air-conditioning systems.
NFPA Quarterly 33: 113-122.
Said, M.N.A, and R.A. MacDonald. 1991. An evaluation of a network smoke control model. ASHRAE Transactions 97: 275-282.
Schifiliti, R.P., B.J. Meacham, and R.L.P. Custer. 1995. Design of detection systems. SFPE Handbook of Fire
Protection Engineering, 2d ed. Quincy, Mass.: National
Fire Protection Association.
Tamura, G.T. 1994. Smoke movement & control in high-rise
office buildings. Quincy, Mass.: National Fire Protection
Association.
Wolin, S.D., N.L. Ryder, F. Leprince, J.A. Milke, F.W. Mow-rer, and J.L. Torero. 2001. Measurements of smoke characteristics in HVAC ducts. Fire Technology 37: 363-395.
DISCUSSION
Sam Gillie, Senior Tech. Engineer, Hawaiian Electric Company, Honolulu, HI: (1) What type of smoke density
meter was used? (2) Was the density across the duct measured in a grid so that cross section of the duct could be measured for density?
Gary Lougheed: (1) Since smoke detectors are sensitive to
relatively low smoke optical densities (<0.1 OD/m) compared to the levels normally measured in fire tests, a smoke meter system was developed specifically for this project. The system used an LED source that produces light in the visible portion of the spectrum. This source simulates the light sensitivity of the human eye. The system was calibrated using neutral density filters. The output of the system was linear with opti-cal density over the range of 0 – 0.2 OD/m (2) Because of the size of the HVAC system ducts, it was not possible to set up a grid system to measure the smoke optical density over the duct cross-section. For the smoke optical density measurements, a smoke sample was taken from the centre of the duct.