HAL Id: hal-02323525
https://hal.archives-ouvertes.fr/hal-02323525
Preprint submitted on 16 Nov 2020HAL is a multi-disciplinary open access
archive for the deposit and dissemination of sci-entific research documents, whether they are pub-lished or not. The documents may come from teaching and research institutions in France or abroad, or from public or private research centers.
L’archive ouverte pluridisciplinaire HAL, est destinée au dépôt et à la diffusion de documents scientifiques de niveau recherche, publiés ou non, émanant des établissements d’enseignement et de recherche français ou étrangers, des laboratoires publics ou privés.
To cite this version:
Pierre Laville, Juliette Martin, Guillaume Launay, Leslie Regad, Anne-Claude Camproux, et al.. A non-parametric method to compute protein–protein and protein–ligands interfaces. Application to HIV-2 protease–inhibitors complexes. 2018. �hal-02323525�
A non-parametric method to compute protein–protein and
protein–ligands interfaces. Application to HIV-2
protease–inhibitors complexes
Pierre Laville1, Juliette Martin2, Guillaume Launay2, Leslie Regad1,
Anne-Claude Camproux1, Sjoerd de Vries1 and Michel Petitjean1,3,∗ 1Universit´e Paris Diderot, MTi, INSERM UMR-S 973, Paris, France.
2Universit´e Lyon 1, IBCP, MMSB, CNRS UMR 5086, Lyon, France.
3Universit´e Paris Diderot, E-pˆole de g´enoinformatique, Institut Jacques Monod,
CNRS UMR 7592, Paris, France.
∗To whom correspondence should be addressed.
Motivation: The accurate description of interfaces is needed to identify which residues interact with another molecule or macromolecule. In addition, a data structure is required to compare interfaces within or between families of protein–protein or protein–ligands complexes. In order to avoid many unwanted comparisons, we looked for a parameter free computation of interfaces. This need appeared at the occasion of bioinformatics studies by our research team focusing on HIV-2 protease (PR2) resistance to its inhibitors. Results: We designed the PPIC software (Protein Protein Interface Computation). It offers three methods of computation of interfaces: (1) our original parameter free method, (2) the Voronoi tessellation approach, and (3) the cutoff distance method. For the latter, we suggest on the basis of 1050 dimers protein–protein interfaces that the optimal cutoff distance is 3.7 ˚A, or 3.6 ˚A for a set of 18 PR2–ligand interfaces. We found at most 17 contact residues with PR2 ligands.
Availability: Free binaries and documentation are available through a software repository located at http://petitjeanmichel.free.fr/itoweb.petitjean.freeware.html
Contact: petitjean.chiral@gmail.com,michel.petitjean@univ-paris-diderot.fr
1
Introduction
As noticed byVangone and Bonvin (2015), the number of connections between each pair of proteins is a strong predictor of how tightly the proteins connect to each other. According to Janin et al. (2008), de Vries and Bonvin (2008) and Dequeker et al. (2017), there are three main methods to compute interfaces between protein chains:
1. The cutoff method (implemented in PPIC).
2. The loss of ASA (accessible surface area) upon binding. 3. The Voronoi tessellation method (implemented in PPIC).
The cutoff method assumes that two residues are in contact when they have a pair of heavy atoms separated by a distance smaller than the cutoff distance. This cutoff distance may be set to 4.5 ˚A between non H atoms (Gao and Skolnick,
2010; Esque et al., 2011; Triki et al., 2018), to 5 ˚A from side-chain centers of mass (Viloria et al., 2017), or to 8 ˚A between Cα atoms (Esque et al., 2011). The choice
of the cutoff can significantly influence the result (de Vries and Bonvin,2008). This method critically relies on the choice of atomic radii, which strongly depend on how they are defined (Bondi, 1964; Allinger et al., 1994). The values recommended in the literature (Gavezzotti,1983) induce the existence of intersections of 6 spheres or more. These intersections above 3 or 4 spheres are ignored by a number of published methods, inducing in turn large errors in surface calculations (Petitjean,1994,2013). In its original variant, the Voronoi tessellation method is parameter-free (Cazals et al., 2006; Bouvier et al., 2009). It was implemented in PROVAT (Gore et al.,
2005). The full mathematical presentation of Voronoi diagrams and their calcula-tion algorithms are out of the scope of this paper (see Edelsbrunner, 1987). We may just say that each atom lies inside a convex polyhedral cell having its polygonal faces located at mid distance from its neighbouring atoms. Thus, two atoms are neighbours if their Voronoi cells share a common face. Extensions taking in account atomic spheres were proposed (Esque et al., 2011; Mahdavi et al., 2012), but these latter are no more parameter-free.
2
Methods
Our original method, which is implemented in PPIC, is a variant of the one of
Cerisier et al.(2017). The input is a complex with two partners (molecule or macro-molecule), A and B. The algorithm has no parameter. It has two steps:
1. Generate the interface in A as the non-redundant set of all nearest neighbours in A of the atoms of B.
2. Generate the interface in B as the non-redundant set of all nearest neighbours in B of the atoms of A.
The interface has two parts, one in A and one in B. Each one is a subset of the interface that would be output by the Voronoi tessellation method (proof: see
Eppstein et al., 1997). However our method is much simpler that the latter, and it does not generate neighbours at long distances in the interface, while large Voronoi cells can induce such long distances. Furthermore, looking at interacting atom pairs among the nearest neighbours makes more sense that looking at interacting atom pairs at farther distances that the nearest neighbours.
3
Results and discussion
We considered the dimers set ofMartin et al.(2008), containing 1050 protein homo-and heterodimers. We compared the 1050 couples of interfaces with the ones ob-tained with the cutoff distance method, for a cutoff ranging from 2 to 6 ˚A. For the full database, computing these interfaces took about 288 min on a workstation Ubuntu 18.04 (16 Intel R
Xeon R
CPUs, 3 GHz). This computing time was roughly the same for the three methods implemented in PPIC. The subsets of atoms defining the interfaces were compared with the symmetric difference metric (Deza and Deza,
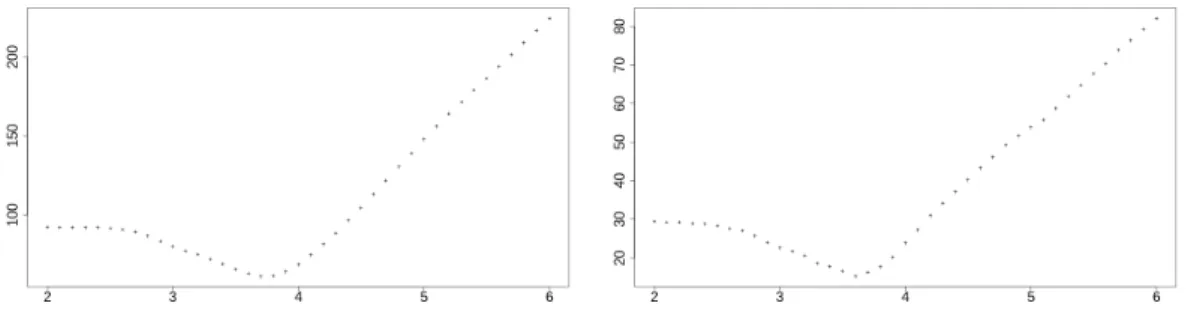
2009). Similarly, we compared the 36 couples of interfaces for the set of 18 PR2– ligand interfaces fromTriki et al. (2018). Figure 1shows that the closest results for
the two methods were observed at a cutoff of 3.7 ˚A for the dimers set, and at 3.6 ˚A for the PR2 complexes set. This is a remarkable agreement since these two data sets are of different nature. It suggests an optimal cutoff value of 3.6–3.7 ˚A between heavy atoms. This optimal value is in agreement with the statistical analysis of
McDonald and Thornton (1994): the distance donor–acceptor should be less than 3.9 ˚A and the distance hydrogen–acceptor should be less than 2.5 ˚A. So, assuming a covalent H bond length of 1.1 ˚A, the distance donor–acceptor should be in fact at most 2.5 + 1.1 = 3.6 ˚A, which is our suggested value. For the Voronoi tessel-lation method, the closest results were observed at the respective cutoffs of 5.1 ˚A and 4.6 ˚A. In the case of distances between heavy atoms, these cutoff values are too large, as predicted in section 2.
For the PR2 complexes, we found that at most 17 residues are in contact with the ligands: Arg 8, Leu 23, Asp 25, Gly 27, Ala 28, Asp 29, Asp 30, Ile 32, Ile 46, Val 47, Gly 48, Gly 49, Ile 50, Phe 53, Pro 81, Ile 82 and Ile 84. All were found in the binding pocket computed by the consensus method ofTriki et al.(2018) based on a 4.5 ˚A cutoff distance. This confirms the pertinence of our parameter-free method.
Figure 1: Mean symmetric difference distances in function of the cutoff value, for the 1050 dimers data set (on the left) and for the 18 PR2 complexes (on the right).
References
Allinger,N., Zhou,X., Bergsma,J. (1994) Molecular mechanics parameters. J. Mol. Struct., 312, 69–83.
Bondi,A. (1964) Van der Waals volumes and radii. J. Phys. Chem., 68, 441–451.
Bouvier,B., Gr¨unberg,R., Nilges,M., Cazals,F. (2009) Shelling the Voronoi interface of protein–protein complexes reveals patterns of residue conservation, dynamics, and com-position. Proteins, 76, 677–692.
Cazals,F., Proust,F., Bahadur,R.P., Janin,J. (2006) Revisiting the Voronoi description of protein–protein interfaces. Prot. Sci., 15, 2082–2092.
Cerisier,N., Regad,L., Triki,D., Camproux,A.-C., Petitjean,M. (2017) Cavity versus ligand shape descriptors: Application to urokinase binding pockets. J. Comput. Biol., 24, 1134–1137.
Dequeker,C., Laine,E., Carbone,A. (2017) INTerface Builder: A fast protein–protein in-terface reconstruction tool. J. Chem. Inf. Model., 57, 2613–2617.
de Vries,S.J., Bonvin,A.M.J.J. (2008) How proteins get in touch: Interface prediction in the study of bio-molecular complexes. Curr. Prot. Peptide Sci., 9, 394–406.
Deza,M.M., Deza,E. (2009) Encyclopedia of Distances. Springer, New-York, p.46.
Edelsbrunner,H. (1987) Voronoi Diagrams. In: Brauer,W., Rozenberg,G. and Salomaa,A. (eds), Algorithms in Combinatorial Geometry. Springer-Verlag, Berlin, chap. 13, pp. 293–334.
Eppstein,D., Paterson,M.S., Yao,F.F. (1997) On nearest-neighbor graphs. Discrete Com-put. Geom., 17, 263–282.
Esque,J., Oguey,C., de Brevern,A.G. (2011) Comparative analysis of threshold and tessel-lation methods for determining protein contacts. J. Chem. Inf. Model, 51, 493–507. Gao,M., Skolnick,J. (2010) iAlign: a method for the structural comparison of protein–
protein interfaces. Bioinformatics, 26, 2259–2265.
Gavezzotti,A. (1983) The calculation of molecular volumes and the use of volume analysis in the investigation of structured media and of solid-state organic reactivity. J. Am. Chem. Soc., 105, 5220–5225.
Gore,S.P., Burke,D.F., Blundell,T.L. (2005) PROVAT: a tool for Voronoi tessellation anal-ysis of protein structures and complexes. Bioinformatics, 21, 3316-3317.
Janin,J., Bahadur, R.P., Chakrabarti,P. (2008) Protein-protein interaction and quaternary structure. Quarterly Rev. Biophys., 41, 133–180.
Mahdavi,S., Mohades,A., Yazdi,A.S., Jahandideh,S., Masoudi-Nejad,A. (2012) Computa-tional analysis of RNA-protein interaction interfaces via the Voronoi diagram. J. Theor. Biol., 293, 55–64.
Martin,J., Regad,L., Etchebest,C., Camproux,A.-C. (2008) Taking advantage of local structure descriptors to analyze interresidue contacts in protein structures and protein complexes. Proteins, 73, 672–689.
Martin,J. (2014) Benchmarking protein–protein interface predictions: Why you should care about protein size. Proteins, 82, 1444–1452.
McDonald,I.K., Thornton,J.M. (1994) Satisfying hydrogen bonding potential in proteins. J. Mol. Biol., 238, 777–793.
Petitjean,M. (1994) On the Analytical Calculation of van der Waals Surfaces and Volumes: Some Numerical Aspects. J. Comput. Chem., 15, 507–523.
Petitjean,M. (2013) Spheres unions and intersections and some of their applications in molecular modeling. In: Mucherino,A., Lavor,C., Liberti,L., Maculan,N. (Eds.), Dis-tance Geometry: Theory, Methods, and Applications, Springer, New-York, chap. 4, pp. 61–83.
Triki,D., Cano Contreras,M.E., Flatters,D., Visseaux,B., Descamps,D., Camproux,A.-C., Regad,L. (2017) Analysis of the HIV-2 protease’s adaptation to various ligands: char-acterization of backbone asymmetry using a structural alphabet. Sci. Rep., 8, 710. Vangone,A., Bonvin,A.M.J.J. (2015) Contacts-based prediction of binding affinity in
protein–protein complexes. eLIFE, 4, e07454.
Viloria,J.S., Allega,M.F., Lambrughi,M., Papaleo,E. (2017) An optimal distance cutoff for contact-based protein structure networks using side-chain centers of mass. Sci. Rep., 7, 2838.