HAL Id: hal-03011641
https://hal.archives-ouvertes.fr/hal-03011641
Submitted on 25 Nov 2020
HAL is a multi-disciplinary open access archive for the deposit and dissemination of sci-entific research documents, whether they are pub-lished or not. The documents may come from teaching and research institutions in France or abroad, or from public or private research centers.
L’archive ouverte pluridisciplinaire HAL, est destinée au dépôt et à la diffusion de documents scientifiques de niveau recherche, publiés ou non, émanant des établissements d’enseignement et de recherche français ou étrangers, des laboratoires publics ou privés.
Biomechanical response of the CNS is associated with
frailty in NPH-suspected patients
A. Vallet, N. del Campo, E. Hoogendijk, A. Lokossou, O. Balédent, Z.
Czosnyka, L. Balardy, P. Payoux, P. Swider, Sylvie Lorthois, et al.
To cite this version:
A. Vallet, N. del Campo, E. Hoogendijk, A. Lokossou, O. Balédent, et al.. Biomechanical response of the CNS is associated with frailty in NPH-suspected patients. Journal of Neurology, Springer Verlag, 2020, 267 (5), pp.1389-1400. �10.1007/s00415-019-09689-z�. �hal-03011641�
OATAO is an open access repository that collects the work of Toulouse
researchers and makes it freely available over the web where possible
Any correspondence concerning this service should be sent
to the repository administrator:
tech-oatao@listes-diff.inp-toulouse.fr
This is an author’s version published in:
https://oatao.univ-toulouse.fr/
2
5380
To cite this version:
Vallet, Alexandra and Del Campo, Natalia and Hoogendijk, Emiel O. and Lokossou, Armelle and Balédent, Olivier and Czosnyka, Zofla and Balardy, Laurent and Payoux, Pierre and Swider, Pascal and Lorthois, Sylvie and Schmidt, Eric Biomechanical response of the CNS is associated with frailty in
NPH-suspected patients. (2020) Journal of Neurology, 267. 1389-1400. ISSN
0340-5354.
Official URL:
https://doi.org/10.1007/s00415-019-09689-z
Biomechanical response of the CNS is associated with frailty
in NPH-suspected patients
A. Vallet1•2. N. Del Campo3 • E. O. Hoogendijk4. A. Lokossou5 • O. Balédent5 • Z. Czosnyka6 • L. Balardy3 •
P. Payoux2•3. P. Swider 1 • S. Lorthois 1. E. Schmidt2•3
Recelved: 2 September 2019 / Revlsed: 20 December 2019 / Accepted: 23 December 2019 © Sprlnger-Verlag GmbH Germany, part of Sprlnger Nature 2020
Abstract
Frailty is known to predict dementia. However, its link with neurodegenerative alterations of the central nervous system (CNS) is not well understood at present. We investigated the association between the biomechanical response of the CNS and frailty in older adults suspected of normal pressure hydrocephalus (NPH) presenting with markers of multiple co-existing pathologies. The biomechanical response of the CNS was characterized by the CNS elastance coefficient inferred from phase contrast magnetic resonance imaging and intracranial pressure monitoring during a lumbar infusion test. Frailty was assessed with an index of health deficit accumulation. We found a significant association between the CNS elastance coefficient and frailty, with an effect size comparable to that between frailty and age, the latter being the strongest known risk factor for frailty. Results were independent of CSF dynarnics, showing that they are not specific to the NPH neuropathological condi tion. The CNS biomechanical characterization may help to understand how frailty is related to neurodegeneration and detect the shift from normal to pathological brain ageing.
Keywords Biomechanics · Frailty · Normal pressure hydrocephalus · Lumbar infusion test · Phase contrast magnetic resonance imaging · Neurodegenerative CNS changes
S. Lorthois and E. Schmidt jointly supervised this work.
igj A. Vallet
alexandra. vallet@imft.fr
igj E. Schnùdt
schmidt.e@chu-toulouse.fr
Institut de Mécanique des Fluides de Toulouse (IMFf), Université de Toulouse, CNRS, Toulouse, France 2 ToNIC UMR 1214,INSERM, Toulouse.France
4
6
Centre Hospitalier Universitaire de Toulouse, Toulouse, France
Department ofEpidenùology and Biostatistics, Amsterdam Public Health Research Institute, Amsterdam UMC, VU University Medical Center, Amsterdam, The Netherlands
CHIMERE EA 7516, Anùens, France
Acadenùc Neurosurgical Unit, Cambridge University Hospital, Cambridge, UK
Introduction
It is well established that the accumulation of neurodegen erative brain pathologies occurs years before the onset of clinical symptoms [l]. This long preclinical stage represents a unique opportunity for preventive therapeutic strategies [2]. A major unresolved challenge is the identification of mechanisms that can be quantified before clinical signs become significant.
Frailty is conceived as an acceleration of the ageing pro cess leading to an increased risk of negative health-related outcomes [3] including dementia. Even if it is not brain specific, frailty bas been demonstrated to predict Alzhei mer's disease (AD) and related dementia [4-6], and has been associated with cognitive impairments [7-9], structural brain abnormalities [10, 1 1], cortical brain infarcts [10] and sub clinical levels of brain neuropathologies [12]. It is thought that frailty and pathological brain ageing share common underlying neurobiological processes. Quantifying these brain-specific processes rnight open a window of opportu nity for the prevention of neurodegenerative diseases.
The recent application of biomechanical models in neuro-degenerative diseases has provided ground-breaking insights into the brain [13], related, for example, to the interstitial fluid transport in the parenchyma [14] or the occlusion of capillaries in AD [15]. It allows the dynamic response of a system to mechanical stressors to be quantified and therefore provides information on its mechanical resilience.
The objective of the present study was to explore the potential of the biomechanical approach to better charac-terize the brain-specific processes shared by both brain pathological ageing and frailty. We hypothesized that the biomechanical response of the CNS could be associated with frailty in older patients presenting with neurodegenera-tive pathologies. This hypothesis was tested on a cohort of patients suspected of normal pressure hydrocephalus (NPH) as (1) these patients often present with co-existing neuro-degenerative diseases [16, 17] and (2) the lumbar infusion test, which is performed as part of their clinical assessment [18], is suitable for measuring the biomechanical response of the CNS.
Methods
Study populationOne hundred patients suspected of NPH (46 women and 54 men aged 52–92 years) were included in the PROLYPHIC cohort between 2013 and 2015 at Toulouse University Hos-pital. The suspicion of NPH was based on established guide-lines [19], i.e. the presence of (1) clinical symptoms of gait or balance disturbance, cognitive impairment or urinary dis-orders, (2) neuroimaging evidence of ventriculomegaly (i.e. Evans Index > 0.3) and (3) narrow callosal angle, temporal horn enlargement or periventricular signal changes.
Standard protocol approvals, registrations and patients’ consent
The study was approved by the competent authority and registered at ClinicalTrials.gov under no NCT0179864. The local ethics committee approved the study. All patients gave their written informed consent.
Clinical evaluation and experimental procedures
All patients underwent a structured clinical evaluation that included the following rating scales: Unified Parkinson’s Disease Rating Scale (UPDRS), Mini Nutritional Assess-ment (MNA) [20], modified Score of Emergency Geriat-ric Assessment (SEGAm) [21], and International Prostate Symptom Score (IPSS) [22]. Blood and lumbar CSF sam-ples were collected for fluid biomarker assessment. Patients
received an infusion test where the intracranial pressure (ICP) was recorded during a constant rate lumbar saline injection in order to characterize their cerebrospinal fluid (CSF) dynamics [18]. A majority of patients also under-went phase contrast (PC) magnetic resonance imaging (MRI). Combined with the ICP data, PCMRI data allowed a parameter characterizing the biomechanical response of the CNS, the CNS elastance coefficient, to be assessed, thus making this cohort unique for the purpose of our study. Finally, most patients underwent [123I]FP-CIT dopamine transporter (DAT) single-photon emission computed tomog-raphy (SPECT) imaging and FLAIR MRI.
In vivo markers of neurodegenerative pathologies
The presence of AD pathology was examined based on the ratio between CSF tau and amyloid beta 42 (Aβ42) peptides using a cut-off of 0.215 [23]. CSF levels of tau and Aβ42 peptides were measured with standard commercial immuno-assays. Presynaptic dopamine deficiency, which is a charac-teristic of Parkinsonian syndrome, was examined visually by an expert neurologist using [123I]FP-CIT DATSPECT. The presence of white matter lesions was ascertained on FLAIR MRI images using the Fazekas scale [24] with a cut-off of ≥ grade 2. Finally, abnormal CSF dynamics was quantified via the CSF outflow resistance R0 derived from the lumbar infusion test [18] described in detail below. A threshold of
R0>12 mmHg/mL/min was chosen as a marker of altered CSF dynamics and increased risk of NPH. Although the above in vivo markers do not, by themselves, corroborate the clinical diagnosis of neurodegenerative diseases, they do flag an increased risk of having or developing them. For each marker, the prevalence of patients at risk was calculated only in patients with available data.
Assessment of the biomechanical response of the CNS
PCMRI protocol and image analysis
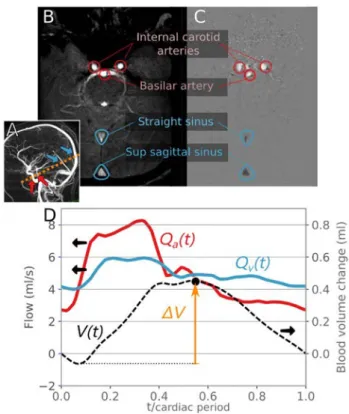
The 2D PCMRI was used as a non-invasive technique to quantify intracranial blood flows as reported elsewhere [25]. Patients who could not undergo PCMRI were excluded from the study. Other participants were imaged in a 3.0 T mag-netic resonance (MR) scanner (Philips Achieva, Philips, Best, Netherlands) with a commercial 32-channel head coil. Retrospective cardiac-gated PCMRI sequences were performed with a plethysmograph set on the subject’s fin-ger to synchronize the acquired images with the subject’s heartbeat. The selected segment was perpendicular to the intracranial internal carotids, basilar artery, straight sinus and sagittal sinus vessels. The acquisitions were made with an encoding velocity of 80 cm/s and 32 time points were
sampled for each cardiac cycle. Preprocessing steps, includ-ing velocity aliasinclud-ing correction, noise reduction and vessel segmentation, were performed by a person blinded to the biomechanical data and using the dedicated Flow Analysis software, version 2018-12-12 [25]. Data identified by an independent reviewer as non-reliable due to poor image or segmentation quality were excluded from the study.
The instantaneous intracranial arterial flow Qa(t) was
defined as the sum of blood flows in the intracranial internal carotid and basilar arteries. The instantaneous intracranial sinus flow Qs(t) was defined as the sum of blood flows in
the straight and sagittal sinuses. It was assumed that dur-ing the whole cardiac cycle, the blood volume enterdur-ing the cranial cavity through arteries was equal to the blood volume exiting it through veins. However, the straight and sagittal sinuses are not the only exit routes for blood. A correction factor was therefore defined to take the unde-tected blood volume exiting the cranial cavity into account:
𝛼
corr=∫ T
0Qa(t)dt∕∫ T
0Qs(t)dt , where T is the cardiac cycle
period. The total instantaneous venous flow was then esti-mated as Qv(t) = 𝛼corrQs(t).
The instantaneous blood volume change was
V(t) =∫t0Qa(t)dt −∫ t
0Qv(t)dt . The maximal blood volume
change was defined as ΔV = max{V(t)}t∈[0,T]− min{V(t)}t∈[0,T] . Figure 1 shows a typical sample of PCMRI data and the associated arterial blood flow, venous blood flow and volume measurements.
Infusion test protocol and intracranial pressure analysis
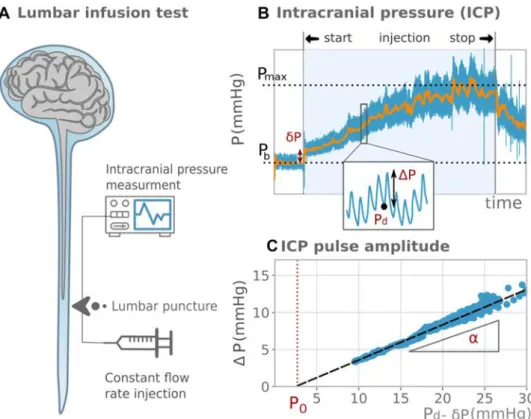
Patients were awake and lying horizontally in the left lateral recumbent position. A lumbar puncture was performed with a needle connected to an infusion pump and to a pressure transducer (Fig. 2a). The CSF pressure, once zeroed at the third ventricle level, is a surrogate marker of ICP [26]. Fast ICP components are strongly coupled to the blood pres-sure and therefore have a pulsatile behaviour at the heart rate frequency. The ICP was digitized with a sampling frequency of 100 Hz and stored in a computer for offline analysis. First, the ICP was measured for 5 min at baseline, where the mean pressure was noted as Pb . Then, the lumbar
subarachnoid space was infused with saline solution at a rate of 1.5 mL/min. Subsequently, ICP increased until a plateau was reached where the mean pressure was noted as Pmax . The resistance R0 was calculated from the ICP mean curve as R0= (Pmax− 𝛿P − Pb)∕If [18], where 𝛿P is an artefact
due to the needle resistance, which was easily measured on the ICP curve (Fig. 2b). For patients with elevated R0 , the test was sometimes stopped if ICP came close to the safety threshold of 40 mmHg even if the plateau had not been reached. In this case, Pmax was extrapolated from a sigmoid curve fit prediction.
CNS elastance coefficient assessment
At each cardiac cycle, the pulsating blood flow induces a blood volume change ΔV and an ICP change ΔP . Clini-cal observations showed that in a patient at rest with constant blood pressure and cardiac stroke volume, the change in pressure ΔP was proportional to the mean ICP [27]. The mathematical model proposed by Marma-rou [28] provides the corresponding linear relationship ΔP = [exp(E.ΔV) − 1][Pd− 𝛿P − P0] , where E is the CNS elastance coefficient (1/mL), Pd is the local diastolic
pres-sure, and P0 is the reference pressure (mmHg). The CNS elastance coefficient characterizes the biomechanical response of the CNS and measures its ability to adapt to a change of volume (see “Discussion”).
From the infusion test data and at each cardiac cycle, the ICP amplitude, ΔP , was measured as the difference between the local maximum systolic pressure and local minimum diastolic pressure, Pd . A linear regression of
ΔP versus Pd dataset was performed to assess the slope
Fig. 1 Phase contrast MRI, typical blood flow measurements and analysis. Panel A: indication of the position of the 2D PC section on angiogram. Panel B: phase contrast angiogram used to determine acquisition location and level. Panel C: velocity-encoded MR images of the internal carotid arteries, basilar artery, straight sinus and supe-rior sagittal sinus. Panel D: blood arterial flow Qa(t) (red curve), venous flow Qv(t) (blue curve), blood volume change V(t) (black dashed curve) and maximal blood volume change ΔV (orange arrow) extracted from the PCMRI data. The left axis shows flow values; the right axis shows volume values
𝛼= [exp(E.ΔV) − 1] and the abscissa axis intersect P
0 (Fig. 2c). The regression used the random sample consensus algorithm [29], which gave robust regression, insensitive to the outliers induced by measurement artefacts or patients’ movements. Fits with an R2 score lower than 0.9 were con-sidered as non-reliable measures. The CNS elastance coef-ficient E = ln(𝛼 + 1)∕ΔV was deduced from the slope, 𝛼 , of the linear fit and from the blood volume change, ΔV , previously calculated from PCMRI data.
Frailty assessment
Frailty was quantified by means of a frailty index (FI) based on the deficit accumulation approach, which has been widely validated across many settings and populations [30, 31]. The FI was defined as the ratio, ranging from 0 (not frail) to 1 (very frail), between the number of health deficits presented by the individual and the total number of deficits considered. A total of 40 variables were selected to measure the deficits in (1) executive functioning, (2) mentation, behaviour and mood, (3) gait, (4) rigidity and agility of extremities, (5) blood laboratory tests of markers related to kidney function, metabolic function and inflammatory conditions, which are of particular importance in older adults [32], (6) urinary symptoms, (7) nutrition and (8) history including medica-tion intake and the presence of previously diagnosed hyper-tension or diabetes mellitus. Table 1 presents the variables and thresholds for deficit status. Following the guidelines
of Searle et al. [30] for creating a frailty index, we did not include variables that had more than 5% missing data and less than 1% of participants meeting criteria for the deficit. Patients presenting more than 10% of missing data on the 40 health deficits considered were excluded.
Statistical analysis
Statistical analyses were performed using STATA ver-sion 15 (College Station, TX). Descriptive analysis of the frequency distribution of all variables was performed. To ascertain normality, continuous variables were inspected through histograms and Skewness–Kurtosis tests. Depending on the distribution of the variables, the variable characteristics were presented as mean ± SD or median with interquartile ranges (IQRs), the group dif-ferences were tested with a t-test or Wilcoxon rank-sum test and correlations were assessed by Pearson analysis or Spearman’s rho analysis. The association between FI, age and the CNS elastance coefficient was further deter-mined with a linear regression analysis. Three models were tested: one model (A) including age adjusted for sex, one model (B) where the CNS elastance coefficient was added, and a final model (C) where the CSF resist-ance to outflow R0 was added as it seemed to be the prin-cipal covariate in a population suspected of NPH. For each model, regression coefficients, normalized effects
Fig. 2 Lumbar infusion test, typical intracranial pressure measurements and analysis. Panel A: lumbar infusion test scheme: The intracranial pres-sure (ICP) is meapres-sured while a saline fluid is injected at a constant flow rate through a lumbar puncture. Panel B: ICP evolution during the infusion test. Blue line: ICP measure-ment; orange line: smoothed ICP (low-pass filter). The mean pressure at plateau, Pmax, and
the mean pressure at baseline, Pb, are indicated in black dotted lines. The pressure artefact induced by the needle, δP, the ICP amplitude, ΔP, and the diastolic pressure, Pd, are indicated in red. Panel C: ICP amplitude, ΔP, versus the diastolic pressure, Pd. Circles: measured values; black dashed line: linear regression. The reference pressure, P0, and the
Table 1 Variables used in the
construction of the frailty index No Variable Condition for deficit Deficits (%) Missing data (%)
Executive functions
1 Dependence for dressing UPDRSa item score ≥ 2 35 0
2 Dependence for hygiene UPDRS item score ≥ 2 35 0
3 Handwriting UPDRS item score ≥ 2 37 0
4 Speech UPDRS item score ≥ 2 12 0
5 Transferring (into and out of bed or chair) UPDRS item score ≥ 2 62 0
6 Chewing and swallowing UPDRS item score ≥ 2 7 0
7 Doing hobbies and other activities UPDRS item score ≥ 2 50 0
Mood and cognition
8 Cognitive impairment UPDRS item score ≥ 2 47 0
9 Depressed mood SEGA item > 1 7 0
10 Apathy UPDRS item score ≥ 2 93 0
11 Self-reported health compared to others SEGA item > 1 42 0
12 Night-time sleep problems UPDRS item score ≥ 2 23 0
13 Anxious mood UPDRS item score ≥ 2 30 0
Gait
14 Walking and balance UPDRS item score ≥ 2 65 0
15 Freezing UPDRS item score ≥ 2 23 0
16 Gait UPDRS item score ≥ 2 83 0
17 Global spontaneity of movement UPDRS item score ≥ 2 17 0
Rigidity and agility of extremities
18 Tapping fingers UPDRS item score
left + right > 2 13 0
19 Tapping toes UPDRS item score
left + right > 2 32 0
20 Rigidity upper extremities UPDRS item score
left + right > 2 17 0
21 Rigidity lower extremities UPDRS item score
left + right > 2 10 0
22 Hand movements UPDRS item score
left + right > 2 17 0
23 Leg agility UPDRS item score
left + right > 2 23 0
Laboratory blood test
24 Urea blood level < 2.9 mmol/L or > 8.2 mmol/L 17 0
25 Creatinine blood level Cockroft-Gault
for-mula < 60 mL/min/1.73 m2 32 2
26 C-reactive protein blood level >3 mg/L 32 0
27 Triglyceride blood level >2.25 mmol/L 8 0
28 Glycated haemoglobin >5.7% 62 5
29 Cobalamin < 300 pg/mL 28 5
30 Sodium < 136 mmol/L or > 142 mmol/L 13 0
Urinary symptoms
31 Need to urinate every 2 h IPSS item ≥ 2 35 0
32 Nocturia IPSS item ≥ 2 15 0
33 Leakage IPSS item ≥ 2 57 0
34 Sensation of bladder not empty IPSS item ≥ 2 15 0
Nutrition
35 Body mass index < 18.5 or > 25 65 2
36 Loss of appetite MNA ≤ 2 10 2
(beta) and p-values were reported. Skewness and kurtosis of standardized residuals were examined to ensure that assumptions of homoscedasticity were satisfied.
Data availability
Any qualified investigator may contact the principal investigator (E. S.) with details about (1) his qualifica-tions, (2) the resources requested and (3) the proposed research question. All requests will be reviewed for avail-ability and scientific merit.
Results
Characteristics of the study population
After careful evaluation, 40 patients were excluded from the initial cohort of 100 patients, for various reasons: miss-ing data or low-quality PCMRI (n = 26), failure of the lin-ear fit of ΔP versus Pd dataset (n = 9) to fulfil the quality
requirements (R2 > 0.9), or more than 10% missing values in the FI (n = 5). This resulted in a final analytical sample of 60 patients, with statistical characteristics of demographic variables, frailty and biomechanical parameters as shown in Table 2.
a UPDRS Unified Parkinson’s Disease Rating Scale b SEGA Score of Emergency Geriatric Assessment c IPSS International Prostate Score Symptom d MNA Mini Nutritional Assessment
Table 1 (continued) No Variable Condition for deficit Deficits (%) Missing
data (%) History
38 Drugs history More than four drugs 55 0
39 Hypertension Present 43 0
40 Diabetes mellitus Present 27 0
Table 2 Demographics and characteristics of variables
* Results are considered as significant for p < 0.05
a Patients having a CSF outflow resistance > 12 mmHg/mL/min b Patients having a CSF outflow resistance ≤ 12 mmHg/mL/min
c p value of the test to reject the null hypothesis that the difference in dynamics alteration between samples
with and without CSF dynamics disorders is due to random sampling Study sample Patients with CSF
dynamics disordersa Patients without CSF dynamics disordersb p value c Sample size 60 34 26 – Demographics Age (y) 74 [71,78] 74 [71,79] 74 [73,77] 0.41 Female, n (%) 50 50 50 0.89 Frailty FI 0.33 ± 0.15 0.34 ± 0.15 0.31 ± 0.14 0.57 Biomechanics Elastance coef. (/mL) 0.52 ± 0.13 0.52 ± 0.14 0.51 ± 0.12 0.69 PCMRI characteristics ΔV (mL) 0.74 [0.58, 0.99] 0.68 [0.56, 0.94] 0.78[0.6, 1.1] 0.21 ICP characteristics Baseline pressure (mmHg) 10 [7.6, 11] 10 [9.2, 12] 8.7 [6.9, 10] 0.02* Pmax (mmHg) 30 [23, 35] 34 [31, 42] 22 [19, 26] < 0.001* R0 (mmHg/mL/min) 13 [9.2, 16] 16 [14, 20] 8.6 [7.4, 10] < 0.001* P0 (mmHg) 4.2 ± 3.2 4.3 ± 3.1 4 ± 3.2 0.84 𝛼 0.46 [0.36, 0.56] 0.44 [0.36, 0.55] 0.48[0.38, 0.6] 0.29
The baseline pressure was 15 % higher (p = 0.02) and the maximum pressure Pmax during the infusion test was 54%
higher (p < 0.001) in the group of patients with elevated CSF outflow resistance ( R0> 12 mmHg/mL/min). No significant differences appear on the other variables between the two groups. The linear regression was not much affected by add-ing the CSF outflow resistance to the model (Table 3, model C).
Discussion
We found a significant association between the CNS elastance coefficient and frailty in a cohort of older adults suspected of NPH and presenting multiple comorbid neu-ropathological conditions. This association was maintained even after adjustment for CSF outflow resistance, showing that it was not primarily driven by CSF dynamics abnor-malities that are characteristic of NPH. Our findings provide the first evidence that altered biomechanical response of the
CNS is associated with global health deficits in older adults undergoing pathological brain ageing.
Neurodegenerative diseases are usually characterized according to their distinct clinical and pathological fea-tures. However, recent evidence suggests that age-related neurodegenerative diseases are often accompanied by mul-tiple, partly overlapping, pathological brain changes [33,
34]. In this context, the association found here between the CNS elastance coefficient and the FI can be interpreted as a characteristic of pathological ageing of the brain, which is not specific to any neurodegenerative disease in particu-lar, for four following reasons. (1) Although the patients of our study were suspected of NPH, not all presented CSF dynamic alterations (43% had normal CSF outflow resist-ance and were not shunted). (2) The regression model of frailty remained unchanged when the CSF outflow resistance was considered. Neither the frailty nor the CNS elastance coefficient differed between patients with or without increased CSF resistance to outflow. Therefore, the results were not specific to altered CSF dynamics. This suggests
Table 3 Regression analysis of frailty
* Results are considered as significant for p < 0.05
FI Model A Model B Model C
N 60 60 60
R-squared (%) 15 23 24
Variables Coef. Beta P > |t| Coef. Beta P > |t| Coef. Beta P > |t|
Elastance coef. (/mL) – – – 0.33* 0.3* 0.012* 0.33* 0.3* 0.012*
Age (y) 0.0084* 0.37* < 0.01* 0.0082* 0.36* < 0.01* 0.0083* 0.36* <0.01*
Sex −0.013 − 0.046 0.71 −0.014 − 0.05 0.68 − 0.014 − 0.048 0.68
R0 (mmHg/mL/min) – – – – – – −0.002 −0.093 0.43
Fig. 4 CNS elastance coefficient and age relationships to the compo-nents of frailty. The relative difference of mean CNS elastance coef-ficients (a) and mean ages (b) in the samples with and without deficit
are indicated for each FI variable as labelled in Table 1. Significant differences (p < 0.05) are indicated with stars.
the idea that factors weakly associated with neurodegenera-tive disorders can, when taken together, still contribute to a global condition leading to neurodegenerative diseases. This suggests that the CNS biomechanical alterations, asso-ciated with general health deficits, might set up conditions of increased vulnerability that lead to the onset and progression of neurodegenerative diseases.
Given that age-related neurodegenerative diseases are often characterized by multiple brain alterations combining lesions of several, partly overlapping, neuropathologies [44], it is essential to capture multi-factorial causes. It has recently been suggested that dynamic indicators of the response of physiological systems to stimuli can add value to the static FI measurements of health deficits [45]. The dynamic approach indeed gives additional information on the systemic resil-ience and the recovery potential of a patient. Altogether, the above results suggest that the CNS elastance coefficient, being a quantitative indicator of the CNS response to blood pulsatility, could be a dynamic indicator that would improve frailty assessment. More generally, the CNS biomechani-cal characterization may be a relevant modality, in addition to conventional clinical and imaging techniques, to identify pathological changes in the brain. It could therefore help to identify the shift from normal to pathological brain ageing as recent studies have shown the benefits of multi-modal approaches for this purpose [46, 47]..
This study had some limitations. First, our results relied on the assumption that the blood volume change ΔV was
the same during the PCMRI examination and the infusion test, which were not performed at the same time. However, PCMRI flux measurements have been reported to be repro-ducible [48], indicating that the haemodynamics remains unchanged when patients are in similar conditions. Here, the patients were lying horizontally in both examinations, had small cardiac frequency differences between the two occasions (6±5%), and were examined within a short time interval (3 ± 6 days). Second, the cross-sectional design of the study did not allow the directionality of the asso-ciation between frailty and the CNS elastance coefficient to be resolved. Third, variables not considered in the pre-sent study may be responsible for the apparent relationship between frailty and CNS elastance coefficient. Noteworthy, we checked that the main confounder related to our NPH-suspected population, the resistance to CSF outflow (R0), is not such a confounder variable. Fourth, our study does not provide information on the relevance of our approach in the preclinical stage as all patients presented clinical symptoms. The absence of an age-matched control group did not allow exploring whether the CNS elastance coefficient can distin-guish pathological from normal brain ageing. The invasive-ness of the lumbar puncture limits such a wider applicability of our approach. A range of alternative non-invasive ICP monitoring techniques are emerging, including monitoring of the optic nerve sheath diameter or of the tympanic mem-brane displacement [49]. These techniques will surely be improved in the near future to eventually provide reliable quantification tools of biomechanical markers. This will allow the predictive value of CNS biomechanical markers for dementia to be explored using longitudinal designs in larger samples of community-dwelling older adults. Such studies are needed to resolve the directionality of the asso-ciation between frailty and the CNS elastance coefficient and to explore the preclinical stage.
Conclusions
There is an urgent need to identify new quantitative markers of the shift from normal to pathological brain ageing. Pre-ventive intervention strategies, including health-promoting life choices, are thought to be our best chance of avoiding or delaying the onset and development of neurodegenerative diseases. This study shows that the biomechanical response of the CNS is associated with the FI, which is known to pre-dict dementia. By quantifying the CNS response to mechani-cal stressors such as the blood pulsatility, the biomechanimechani-cal characterization of the CNS provides dynamic information that goes beyond the FI static measurement of health defi-cits. Hence, the CNS biomechanical characterization, as a complementary tool to the FI, may help the early detection
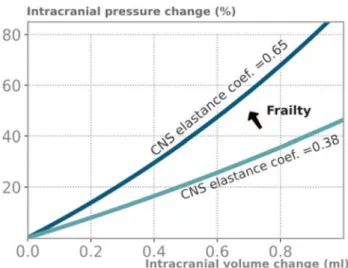
Fig. 6 Higher CNS elastance coefficient increases vulnerability to mechanical stressors. The intracranial pressure (ICP) relative change, ΔP/P, induced by an instantaneous intracranial volume change ΔV is plotted for a low and a high value of the CNS elastance coefficient (study mean value ± standard deviation). The prediction is made according to Marmarou’s model, ΔP = [exp(E.ΔV) − 1][P − P0] ,
where P0 is neglected. This study shows that greater frailty is associ-ated with higher CNS elastance coefficient, leading to an increased risk for excessive ICP peaks, i.e. to an increased brain vulnerability to mechanical stressors
of pathological ageing of the brain and should be further investigated in longitudinal studies.
Acknowledgements This study was supported by a grant from the French Ministry of Health with the participation of the Groupement Interrégional de Recherche Clinique et d’Innovation Sud-Ouest Outre-Mer Hospitalier (PHRCInterRégional 2010), by research funding from the Occitania Region (RPBIO 2015 no 14054344), and by the European Research Council under the European Union’s Seventh Framework Program (FP7/2007-2013)/ERC grant agreement no 615102 (https :// erc.europ a.eu/).
Author contribution AV designed and conceptualized the study, pro-cessed, analysed and interpreted the data, performed the statistical anal-ysis, and drafted and revised the manuscript. NDC and EH designed and conceptualized the study on the frailty part, interpreted the data, and drafted and revised the manuscript. AL segmented and analysed PCMRI data. OB provided tools and methods for PCMRI acquisition and data processing and analysed PCMRI data. ZC interpreted ICP measurements and revised the manuscript. LB and PP played a major role in the acquisition of clinical data and MRI data, respectively. PS designed and conceptualized the biomechanical part of the study, inter-preted the data, and drafted and revised the manuscript. SL and ES designed and conceptualized the study, interpreted the data, drafted and revised the manuscript, supervised the study and obtained funding. Compliance with ethical standards
Conflicts of interest On behalf of all authors, the corresponding author states that there is no conflict of interest.
References
1. Jack CR, Knopman DS, Jagust WJ et al (2010) Hypothetical model of dynamic biomarkers of the Alzheimer’s pathological cascade. Lancet Neurol 9:119–128. https ://doi.org/10.1016/S1474 -4422(09)70299 -6
2. Sperling RA, Karlawish J, Johnson KA (2013) Preclinical Alzhei-mer disease-the challenges ahead. Nat Rev Neurol 9:54–58. https ://doi.org/10.1038/nrneu rol.2012.241
3. Cesari M, Vellas B, Gambassi G (2013) The stress of aging. Exp Gerontol 48:451–456. https ://doi.org/10.1016/j.exger .2012.10.004 4. Kojima G, Taniguchi Y, Iliffe S, Walters K (2016) Frailty as a pre-dictor of alzheimer disease, vascular dementia, and all dementia among community-dwelling older people: a systematic review and meta-analysis. J Am Med Dir Assoc 17:881–888. https ://doi. org/10.1016/j.jamda .2016.05.013
5. Song X, Mitnitski A, Rockwood K (2014) Age-related deficit accumulation and the risk of late-life dementia. Alzheimers Res Ther 6:54. https ://doi.org/10.1186/s1319 5-014-0054-5
6. Song X, Mitnitski A, Rockwood K (2011) Nontraditional risk fac-tors combine to predict Alzheimer disease and dementia. Neurol-ogy 77:227–234. https ://doi.org/10.1212/WNL.0b013 e3182 25c6b c
7. Oppenheim H, Paolillo EW, Moore RC et al (2018) Neurocogni-tive functioning predicts frailty index in HIV. Neurology 91:e162– e170. https ://doi.org/10.1212/WNL.00000 00000 00576 1 8. Robertson DA, Savva GM, Kenny RA (2013) Frailty and
cog-nitive impairment–a review of the evidence and causal mecha-nisms. Ageing Res Rev 12:840–851. https ://doi.org/10.1016/j. arr.2013.06.004
9. Rolfson DB, Wilcock G, Mitnitski A et al (2013) An assessment of neurocognitive speed in relation to frailty. Age Ageing 42:191– 196.https ://doi.org/10.1093/agein g/afs18 5
10. Kant IMJ, de Bresser J, van Montfort SJT et al (2018) The associa-tion between brain volume, cortical brain infarcts, and physical frailty. Neurobiol Aging 70:247–253. https ://doi.org/10.1016/j. neuro biola ging.2018.06.032
11. Gallucci M, Piovesan C, Di Battista ME (2018) Associations between the Frailty Index and Brain Atrophy: the Treviso Demen-tia (TREDEM) Registry. J Alzheimers Dis 62:1623–1634. https :// doi.org/10.3233/JAD-17093 8
12. Buchman AS, Yu L, Wilson RS et al (2013) Association of brain pathology with the progression of frailty in older adults. Neurol-ogy 80:2055–2061. https ://doi.org/10.1212/WNL.0b013 e3182 94b46 2
13. Goriely A, Geers MGD, Holzapfel GA et al (2015) Mechanics of the brain: perspectives, challenges, and opportunities. Biomech Model Mechanobiol 14:931–965. https ://doi.org/10.1007/s1023 7-015-0662-4
14. Holter KE, Kehlet B, Devor A et al (2017) Interstitial solute transport in 3D reconstructed neuropil occurs by diffusion rather than bulk flow. Proc Natl Acad Sci 114:9894–9899. https ://doi. org/10.1073/pnas.17069 42114
15. Hernández JCC, Bracko O, Kersbergen CJ et al (2019) Neutro-phil adhesion in brain capillaries reduces cortical blood flow and impairs memory function in Alzheimer’s disease mouse models. Nat Neurosci 22:413. https ://doi.org/10.1038/s4159 3-018-0329-4 16. Klassen BT, Ahlskog JE (2011) Normal pressure hydrocephalus. Neurology 77:1119. https ://doi.org/10.1212/WNL.0b013 e3182 2f02f 5
17. Malm J, Graff-Radford NR, Ishikawa M, et al. (2013) Influence of comorbidities in idiopathic normal pressure hydrocephalus — research and clinical care. A report of the ISHCSF task force on comorbidities in INPH. Fluids Barriers CNS 10:22. https ://doi. org/10.1186/2045-8118-10-22**
18. Marmarou A, Young HF, Aygok GA et al (2005) Diagnosis and management of idiopathic normal-pressure hydrocephalus: a pro-spective study in 151 patients. J Neurosurg 102:987–997. https :// doi.org/10.3171/jns.2005.102.6.0987
19. Relkin N, Marmarou A, Klinge P et al (2005) Diagnosing idi-opathic normal-pressure hydrocephalus. Neurosurgery. https ://doi. org/10.1227/01.neu.00001 68185 .29659 .c5
20. Vellas B, Guigoz Y, Garry PJ et al (1999) The mini nutritional assessment (MNA) and its use in grading the nutritional state of elderly patients. Nutrition 15:116–122. https ://doi.org/10.1016/ S0899 -9007(98)00171 -3
21. Feck E, Zulfiqar AA (2018) Screening of frailty in family practice by the modified SEGA grid. Rev Med Liege 73:513–518 22. Araki I, Kuno S (2000) Assessment of voiding dysfunction
in Parkinson’s disease by the international prostate symptom score. J Neurol Neurosurg Psychiatry 68:429–433. https ://doi. org/10.1136/jnnp.68.4.429
23. Mo Y, Stromswold J, Wilson K et al (2017) A multinational study distinguishing Alzheimer’s and healthy patients using cerebrospi-nal fluid tau/Aβ42 cutoff with concordance to amyloid positron emission tomography imaging. Alzheimers Dement Diagn Assess Dis Monit 6:201–209. https ://doi.org/10.1016/j.dadm.2017.02.004 24. Fazekas F, Chawluk JB, Alavi A et al (1987) MR signal abnormal-ities at 1.5 T in Alzheimer’s dementia and normal aging. AJR Am J Roentgenol 149:351–356. https ://doi.org/10.2214/ajr.149.2.351 25. Balédent O, Henry-Feugeas M-C, Idy-Peretti I (2001) Cerebro-spinal fluid dynamics and relation with blood flow: a magnetic resonance study with semiautomated cerebrospinal fluid segmen-tation. Invest Radiol 36:368
26. Lenfeldt N, Koskinen L-OD, Bergenheim AT et al (2007) CSF pressure assessed by lumbar puncture agrees with intracranial
pressure. Neurology 68:155–158. https ://doi.org/10.1212/01. wnl.00002 50270 .54587 .71
27. Szewczykowski J, liwka S, Kunicki A et al (1977) A fast method of estimating the elastance of the intracranial system. J Neurosurg 47:19–26. https ://doi.org/10.3171/jns.1977.47.1.0019
28. Marmarou A, Shulman K, Rosende RM (1978) A nonlinear analysis of the cerebrospinal fluid system and intracranial pres-sure dynamics. J Neurosurg 48:332–344. https ://doi.org/10.3171/ jns.1978.48.3.0332
29. Fischler MA, Bolles RC (1981) Random sample consensus: a paradigm for model fitting with applications to image analysis and automated cartography. Commun ACM 24:381–395. https :// doi.org/10.1145/35866 9.35869 2
30. Searle SD, Mitnitski A, Gahbauer EA et al (2008) A standard procedure for creating a frailty index. BMC Geriatr 8:24. https :// doi.org/10.1186/1471-2318-8-24
31. Rockwood K, Mitnitski A (2011) Frailty defined by deficit accu-mulation and geriatric medicine defined by frailty. Clin Geriatr Med 27:17–26. https ://doi.org/10.1016/j.cger.2010.08.008 32. Vásárhelyi B, Debreczeni LA (2017) Lab test findings in the
elderly. EJIFCC 28:328–332
33. Irwin DJ, Grossman M, Weintraub D et al (2017) Neuropathologi-cal and genetic correlates of survival and dementia onset in synu-cleinopathies: a retrospective analysis. Lancet Neurol 16:55–65. https ://doi.org/10.1016/S1474 -4422(16)30291 -5
34. Iturria-Medina Y, Sotero RC, Toussaint PJ et al (2016) Early role of vascular dysregulation on late-onset Alzheimer/’s disease based on multifactorial data-driven analysis. Nat Commun 7:11934. https ://doi.org/10.1038/ncomm s1193 4
35. Wirth B, Sobey I (2009) Analytic solution during an infusion test of the linear unsteady poroelastic equations in a spherically sym-metric model of the brain. Math Med Biol J IMA 26:25–61. https ://doi.org/10.1093/imamm b/dqn02 1
36. Pini L, Pievani M, Bocchetta M et al (2016) Brain atrophy in Alzheimer’s Disease and aging. Ageing Res Rev 30:25–48. https ://doi.org/10.1016/j.arr.2016.01.002
37. Murphy MC, Huston J, Jack CR et al (2011) Decreased brain stiff-ness in Alzheimer’s disease determined by magnetic resonance elastography. J Magn Reson Imaging JMRI 34:494–498. https :// doi.org/10.1002/jmri.22707
38. Sack I, Streitberger K-J, Krefting D et al (2011) The influence of physiological aging and atrophy on brain viscoelastic properties
in humans. PLOS One 6:e23451. https ://doi.org/10.1371/journ al.pone.00234 51
39. Streitberger K-J, Wiener E, Hoffmann J et al (2011) In vivo vis-coelastic properties of the brain in normal pressure hydrocephalus. NMR Biomed 24:385–392. https ://doi.org/10.1002/nbm.1602 40. Leinonen V, Koivisto AM, Alafuzoff I et al (2012) cortical brain
biopsy in long-term prognostication of 468 patients with possible normal pressure hydrocephalus. Neurodegener Dis 10:166–169. https ://doi.org/10.1159/00033 5155
41. Jaraj D, Agerskov S, Rabiei K et al (2016) Vascular factors in sus-pected normal pressure hydrocephalus. Neurology 86:592. https ://doi.org/10.1212/WNL.00000 00000 00236 9
42. Clegg A, Young J, Iliffe S et al (2013) Frailty in elderly peo-ple. Lancet 381:752–762. https ://doi.org/10.1016/S0140 -6736(12)62167 -9
43. Stone J, Johnstone DM, Mitrofanis J, O’Rourke M (2015) The mechanical cause of age-related dementia (Alzheimer’s disease): the brain is destroyed by the pulse. J Alzheimers Dis 44:355–373. https ://doi.org/10.3233/JAD-14188 4
44. Rahimi J, Kovacs GG (2014) Prevalence of mixed patholo-gies in the aging brain. Alzheimer’s Res Ther 6:82. https ://doi. org/10.1186/s1319 5-014-0082-1
45. Olde Rikkert MGM, Melis RJF (2019) Rerouting geriatric medi-cine by complementing static frailty measures with dynamic resil-ience indicators of recovery potential. Front Physiol. https ://doi. org/10.3389/fphys .2019.00723
46. Khan TK (2018) An algorithm for preclinical diagnosis of alz-heimer’s disease. Front Neurosci. https ://doi.org/10.3389/fnins .2018.00275
47. Payton NM, Kalpouzos G, Rizzuto D et al (2018) Combining cog-nitive, genetic, and structural neuroimaging markers to identify individuals with increased dementia risk. J Alzheimers Dis JAD 64:533–542. https ://doi.org/10.3233/JAD-18019 9
48. Spilt A, Box FMA, van der Geest RJ et al (2002) Reproducibility of total cerebral blood flow measurements using phase contrast magnetic resonance imaging. J Magn Reson Imaging JMRI 16:1– 5.https ://doi.org/10.1002/jmri.10133
49. Khan MN, Shallwani H, Khan MU, Shamim MS (2017) Noninva-sive monitoring intracranial pressure: a review of available modal-ities. Surg Neurol Int. https ://doi.org/10.4103/sni.sni_403_16