HAL Id: halshs-00115717
https://halshs.archives-ouvertes.fr/halshs-00115717
Submitted on 22 Nov 2006
HAL is a multi-disciplinary open access archive for the deposit and dissemination of sci-entific research documents, whether they are pub-lished or not. The documents may come from
L’archive ouverte pluridisciplinaire HAL, est destinée au dépôt et à la diffusion de documents scientifiques de niveau recherche, publiés ou non, émanant des établissements d’enseignement et de
The impact of financial constraints on innovation:
evidence from French manufacturing firms
Frédérique Savignac
To cite this version:
Frédérique Savignac. The impact of financial constraints on innovation: evidence from French manu-facturing firms. 2006. �halshs-00115717�
Maison des Sciences Économiques, 106-112 boulevard de L'Hôpital, 75647 Paris Cedex 13
Centre d’Economie de la Sorbonne
UMR 8174
The impact of financial constraints on innovation!:
evidence from French manufacturing firms
Frédérique SAVIGNAC
THE IMPACT OF FINANCIAL CONSTRAINTS ON
INNOVATION: EVIDENCE FROM FRENCH
MANUFACTURING FIRMS
∗
Frédérique Savignac
†CREST and CES-Université Paris I-Panthéon Sorbonne
April 2006
(First version: April 2005)
∗I thank P.Sevestre for his helpful suggestions and advice. I am grateful to E. Avenel, D.
Czar-nitzki, J.Mairesse, P.Mohnen and to participants at AFSE annual congress (september 2005), at the 2nd ZEW conference on Innovation and Patenting (Mannheim, September 2005), at REPERES, EUREQua, ERUDITE and at INRA-GAEL seminars for their comments. I also thank the Sessi (French Ministry of Industry) for providing the data of the survey ”Le financement de l’innovation technologique”. This paper was mainly written while I was at the Companies Directorate of the Banque de France. I remain responsible for all errors.
†CREST-LMI, Timbre J390, 15 Boulevard Gabriel Péri 92245 Malakoff-Cedex and CES,
Abstract
This paper examines the impact of financial constraints on innovation for estab-lished firms. We make use of a qualitative indicator of the existence of financial constraints based on firms’ own assessment obtained thanks to a French specific sur-vey. Thus, the existence of financial constraints for innovation is measured by a direct indicator whereas previous studies rely on proxies (like the cash-flow sensitivity) sub-ject to interpretation problems. The descriptive analysis of balance sheet structures reveals that innovative firms without financial constraints have the best profile in terms of economic performances, financing structure and risk whereas non innovative firms facing financial constraints have the poorest profile. From the econometric point of view, the probabilities of implementing innovative projects and of facing financial constraints are simultaneously estimated by a recursive bivariate probit model to account for the endogeneity of the financial constraint variable. We then find that firms having innovative projects face financial constraints that significantly reduce the likelihood that they implement their innovative investment. The probability of facing financing constraints is explained by firms’ ex ante financing structure and economic performances, by industry sector and it decreases with firms’ size.
Keywords:innovation, financing constraints, recursive bivariate probit
Résumé
Cet article étudie l’effet de la présence des contraintes financières sur l’innovation au sein de firmes établies. Nous nous appuyons sur un indicateur qualitatif de la présence de contraintes financières obtenu auprès des firmes elles-mêmes par le biais d’une enquête spécifique sur le financement de l’innovation (FIT, SESSI). La présence de contraintes financières est donc mesurée ici par un indicateur direct alors que les travaux antérieurs s’appuyent sur des proxies, en particulier sur la sensibilité de l’investissement au cash-flow. L’analyse descriptive de la structure des bilans met en évidence que les firmes innovantes non contraintes financièrement présentent globalement le meilleur profil en termes de performances économiques, structures de financement et risque. A contrario, ces indicateurs se révèlent les moins bons pour les firmes contraintes financièrement et qui n’ont pas entrepris de projet innovant. Du point de vue économétrique, la probabilité d’entreprendre un projet innovant et celle de faire face à des contraintes financières pour l’innovation sont estimées simultanément par un probit bivarié récursif afin de tenir compte de l’endogénéité de la variable de contrainte financière. Nous trouvons alors que les firmes souhaitant innover rencontrent des contraintes financières qui diminuent significativement leur probabilité d’entreprendre leurs projets innovants. La probabilité d’être confronté à des contraintes financières pour l’innovation est expliquée par les performances économiques et la structure de financement ex ante de la firme et elle décroit avec la taille de la firme.
Mots clés: innovation, contraintes financières, probit bivarié récursif JEL classification: G31, C35, 031
1
INTRODUCTION
As it is largely stressed in the theoretical literature, the realization of innovative projects is very likely to undergo financial constraints. Indeed, funding such projects with external finance is difficult and costly to firms due to the strong information asymmetry associated with such innovative investments (Hall 2002, Schroth and Sza-lay 2004). However, the empirical evidence about the impact of these constraints on innovation is quite sparse and not as conclusive as one might expect. A first strand in this empirical literature rely on R&D investment models where additional variables such as cash-flow are considered to account for financial constraints. Although a num-ber of studies find a significant cash-flow effect on R&D investments by firms (e.g. see Himmelberg and Petersen 1994, Mulkay et al. 2001), this conclusion does not always hold (e.g. see Harhoff 1998 or Bond et al. 1999 for German firms). Moreover, it has been stressed that investment cash-flow sensitivity may not be always inter-preted as revealing the existence of financial constraints (see Kaplan and Zingales 1997 and 2000). A second strand in the literature aims at modeling firms’ propen-sity to innovate. This literature identifies four predominant factors (Cohen and Levin 1989). Some of these determinants are firm specific (as firms size and their monopoly power), others relate to environmental factors linked to the market (“demand pull”) or to technological opportunities (“technology push”). Quite surprisingly, papers estimating the probability that a firm undertakes innovative activities often ignore the firm’s financing conditions (e.g. see Crépon et al. 1998 and 2000, Mohnen and Therrien 2002, Lööf and Heshmati 2002). Indeed, there are very few studies that account for the existence of financial constraints (Czarnitzki 2005) and, when they do so, they mainly use firms’ cash-flows or past profitability as proxies for financial constraints (see Bond et al. 1999, Harris et al. 2003).
This article aims at directly estimating the impact of financial constraints on innovation decisions. Our empirical analysis takes partially up the framework of Crépon et al. (1998, 2000) which is used in several recent studies (Janz et al. 2003, Jans and Peters 2002). However, we depart from this framework in two respects. First, we focus only on the first step of their model: the decision to engage into innovative activities. Second, we put a particular stress on the role of financial factors on firms decisions, which was not done in their paper. For that purpose, we use a survey about the financing of innovation by French manufacturing firms that allows to avoid the difficulties associated with the cash-flow sensitivity measure (Kaplan and Zingales 1997). As far as we know, it is the first time that such a direct information based on firm’s own assessment is used to characterize the existence of financial constraints for innovation. We find that, indeed, the existence of financial constraints significantly reduces the likelihood that a firm will undertake innovative projects. In addition, our results confirm those of previous works about the traditional determinants of innovation: the likelihood that a firm implements innovative projects differs across industries, it increases with its market share and with the importance of the technology push. Concerning firm’s financing problems for innovation, our results shows that the existence of financing constraints decreases with firm size. It is also explained by the ex ante financing structure and economic performance as well
as by firm’s industry sector. Moreover, from a more technical point of view, we show that the existence of financial constraints is endogenous to the decision to engage into an innovative project. Consequently, a recursive bivariate probit model has to be considered to account for simultaneity as well as for unobservable heterogeneity that affects both the decision to undertake innovative projects and the existence of financial constraints.
This paper is organized as follows. Section 2 briefly reviews the theoretical and empirical background. Section 3 describes the data sets: the data sources as well as some descriptive statistics on firms balance sheet structure are presented. Section 4 exposes the econometric models and discusses the estimation results. Section 5 concludes.
2
FIRMS’ DECISION TO INNOVATE:
THEORETI-CAL AND EMPIRITHEORETI-CAL BACKGROUND
Due to informational asymmetries with external investors, firms may find it difficult and costly to raise external funds for their investments financing (Myers and Majluf 1984). Another possible explanation of the difference between the costs of external and internal funds lies in moral hazard problems caused by the separation of ownership and management (Jensen and Meckling 1976). In the case of innovative investments, financing constraints may be more severe. In fact, innovative investments present special features that increase the risk and reinforce the informational problems with external investors. The uncertainty linked to the final output of an innovative project may be important and this makes innovative investments particularly risky. More-over, in general, external investors have no specific knowledge to properly evaluate the impact of a new product or production process on a firm development. Given their firm-specific nature, innovative projects may indeed be viewed as inducing high transaction costs of which financial constraints are a counter-part (Williamson 1988). These projects constitute specific assets which present sunk costs that may have relatively little value beyond their use in the context of a specific firm/transaction. Moreover, innovative investments contain a large part of intangible assets (such as R&D expenses, payment of wages of highly educated engineers...) which cannot be used as collateral value to secure firms’ borrowing. Consequently, this weakens firms financial reliability from the external investors’ point of view. Those asymmetric information problems and the uncertainty about the project output can even induce credit rationing (Stiglitz and Weiss 1981, Williamson 1987).
Empirically, the existence of financial constraints for innovative firms is most frequently investigated by examining the sensitivity of R&D investment to financial factors (Himmelberg and Petersen 1994, Harhoff 1998, Mulkay et al. 2001). It is estimated by using the same models as for physical investment (see Mairesse et al. 1999), that is to say, by using the reduced form of accelerator models of investment ( Fazzari et al. 1988, Bond et al. 1997) or by using the structural framework of Euler equations (Bond and Meghir 1994). Himmelberg and Petersen (1994) find a large and significant relationship between R&D and internal finance for US small firms
in high-tech industries. Similar results are obtained by Mulkay et al. (2001) with French and United States firms. In addition, they find, that cash-flow has a much larger impact on R&D investment for US firms than for the French ones. Harhoffs’ results about German firms are less conclusive. He finds a weak but significant cash-flow effect on R&D by using an investment accelerator model, while Euler-equation estimates appear to be not informative. However, Kaplan and Zingales (1997, 2000) show that investment cash-flow sensitivity may not be always interpreted as revealing the existence of financial constraints. Cash-flow provides information about future investment opportunities; thus, investment cash-flow sensitivity may equally occur because firms are sensitive to demand signals.
Otherwise, there are some studies looking at the impact of financial constraints on firms’ decision to undertake innovative activities. Bond et al. (1999) look in particular at the impact of financial constraints on firms’ propensity to innovate by examining cash-flows’ effect. They do find that cash-flows have a positive and significant effect on the likelihood that British firms perform R&D whereas this effect is non significant for German firms. With Australian firms, Harris et al. (2003) use past profitability to account for the existence of financing constraints but they do not find that it has a significant impact on the probability to innovate. In Czarnitzki (2005) a tobit model is estimated to evaluate the role of financial constraints on R&D expenditure of small and medium sized German firms. A proxy for internal funds available accounts for internal financing constraints and a credit rating index is used to measure financing constraints with external suppliers of funds. As a result, this paper gives empirical evidence of the existence of financing constraints affecting R&D expenditure. More often, the literature about innovation decisions stresses the role of firm’s size as proxy to the existence of financial constraints (Cohen and Klepper 1996). This can be explained by the importance of sunk costs linked to innovation investments. Large firms are more incited to engage in innovative activities because they can amortize these costs by selling more units of output. In addition, it may be easier to finance innovative investment in large firms which are well-known and may enjoy better relations with external investors or lenders. Thus, Crépon et al. (1998) find a positive significant effect of firm size on the likelihood to undertake R&D.
Other factors affecting the propensity to innovate have been emphasized by the literature. The impact of market structure on innovation is examined by several authors (Schumpeter 1942, Arrow 1962, Dasgupta and Stiglitz 1980, Aghion et al. 2002). Schumpeter (1942) argues that a firm is incited to innovate if it enjoys a monopoly position because it would be worried about the entry of potential rivals. But Arrow (1962) shows that under perfect ex-post appropriation, the profit mar-gins are larger in an ex-ante competitive industry than under a monopoly situation. In this respect, the recent empirical studies are not in contradiction to the Schum-peterian theory. Blundell et al. (1999) find a positive relationship between firms’ ex ante market share and innovation (measured by headcount innovations as well as patents). Thus, Aghion et al. (2002) propose a model with an inverted U-shape relationship between innovation and competition. In this model, competition may increase innovation profit margin but high competition may also reduce incentive to
innovate for laggards. Concerning the role of firm’s environment, Rosenberg (1974) argues that technological opportunities determine firm’s decision to undertake inno-vative projects. The technological opportunities may result from the past history of knowledge accumulation and from the technological progress in the firm’s envi-ronment. As a result, they depend on various factors such as the diffusion process of knowledge, the state of art, relationship between firms or cooperation between firms and universities. So, the existence of technological opportunities may induce variations in firms’ ability to innovate within an industry. The demand pull is an-other external factor which may lead innovation (Schmookler 1966). This approach identifies consumer’s needs as driving new products or processes. From an empirical point of view, the main problem is to characterize the existence of technological op-portunities and to define the latent demand. Empirical evidences of the role of the technologic push and of the demand pull are obtained by using qualitative indicators based on firm’s own assessment (Barlet et al. 1998, Crépon et al. 1998).
Now, let us present the database used to estimate the impact of financial con-straints on firms’ decision to innovate as well as some descriptive statistics.
3
INNOVATION, FINANCIAL CONSTRAINTS AND
BALANCE SHEET STRUCTURE: A BRIEF
DESCRIP-TIVE ANALYSIS
3.1
Presentation of the datasets
We use data from two sources: a survey about the financing conditions of innovative projects for established manufacturing firms and the Banque de France Balance Sheet Data.
The survey we used, named “Financement de l’Innovation Technologique” (FIT) was conducted in 2000 by the French Ministry of Industry. Its aim was to obtain sta-tistical information about the financing conditions of innovative projects of manufac-turing firms in France. This survey allows to identify the firms which undertook inno-vative projects between 1997 and 1999 and it gives qualitative information about the financial constraints that firms may have experienced when planning and conducting those projects. A sample of 5500 industrial companies was surveyed. It is composed by manufacturing firms with 20 employees and more (excluding agricultural-food and building sectors). It is important to notice that start-ups and new established firms are not in the field of this survey. Globally, the rate of response amounts to 70% (Sessi 2002) so that about 3700 firms are present in the available FIT sample.
As the Community Innovation Surveys (CIS), the FIT survey is based upon the technological innovation concept exposed in the Oslo manual (OECD 1997). The identification of firms that conduct an innovative project is made thanks to their answers to the three following questions:
1) In 1997, 1998 or 1999, did Your enterprise introduce onto the market any new or significantly improved products for Your enterprise?
2) In 1997, 1998 or 1999, did Your enterprise introduce onto the market any new or significantly improved process for Your enterprise?
3) In 1997, 1998 or 1999, had Your enterprise projects of new or significantly improved products or processes:
- Which are not yet completed or not yet introduce to the market? - Which were failures?
We consider that a firm has implemented innovative projects if it answered posi-tively to at least one of these three questions.
In addition, the survey gives a qualitative information about the existence of financing constraints. This indicator is exposed and discussed in section 3.2.
In order to have more information about the surveyed firms (their size, economic performance and financing structure) we use the Banque de France Balance Sheet Dataset.1 This is a database containing essentially very detailed accounting data of French companies, obtained from their fiscal forms plus some complementary ques-tionnaires. The database includes all businesses with more than 500 employees and a fraction of smaller firms so that the member firms amount to around 34,000 com-panies. It achieves an overall coverage rate of 57% in industry (in terms of number of employees). This rich database is used by the Banque de France to update knowl-edge of the structure and performance of the French productive system. In addition, it makes it possible for example, to pinpoint sources of financing, to isolate group financing or to identify expenditures in intangible goods and services.
Our sample results from the matching of these two sources. We were able to recover about 60% of the FIT sample companies. After some necessary cleaning, our sample contains 1940 firms.2
3.2
The measure of the existence of financial constraints for
inno-vation
Previous papers about investment rely on a priori criterions to discriminate between likely financially constrained and unconstrained firms. This methodology was ini-tialized by Fazzari et al. (1989) and use firm size and the dividends distribution to identify likely financially constrained firms. In the literature, the existence of fi-nancing constraints is also taken into account by indirect indicators (Ploetscher and Rottmann 2002, Czarnitzki 2005). In these both studies, qualitative measures of the existence of financing constraints are used to study their impact respectively on investment and on R&D expenditure. Ploetscher and Rottmann (2002) define the existence of financing constraints for investment according to the use of trade credit which is considered as one of the most expensive external financing source: firms declaring that they use always or often trade credit are considered to be financially constrained. In Czarnitzki (2005), the measure of the existence of external financing constraints is given by a credit-rating index. As mentioned by the author, firms with
1
The "Centrale de bilans" dataset.
2The manufacture of coke, refined petroleum products and nuclear fuel has been deleted because
only two firms were present in the merged dataset. In addition, the firms with negative added value or with abnormally high investment rates have been excluded. This concerns only two firms.
bad credit rating index will have higher costs for accessing to external finance than others. Nevertheless, this variable gives the judgment made by external examiners on the firm financial reliability but it does not characterize the actual financing problems met by the firm for its R&D investment. In addition, it may be possible that globally a firm obtains a good rating but that external investors or lenders may be reluctant to give funds for a specific R&D investment. Kalckreuth (2004) studies the impact of financial constraints on the distribution on investment over time and he relies on survey data that identify financing difficulties for investment of German firms. Thus, this article relies on a direct measure of the existence of financial constrained given by the firms themselves but it does not specifically deals with innovation.
Thus, except Kalckreuth’s paper, previous studies dealing with the financing of investment are mainly based on proxies of the existence of financing constraints. Here, we use a direct measure of financial hampering factors for innovation given by the firms themselves. Indeed, in the FIT survey, firms were asked if they met obstacles that prevented them to lead or to undertake innovative projects. Among the obstacles listed in the survey, there are three expressions of the existence of financing constraints:3
- no financing source
- slowness in the setting up of the financings - too high interest rates of the financings
We consider that a firm faced financial constraints for its innovative projects if it answered that it had projects which were delayed, abandoned or non started because of at least one of the three obstacles listed above.
It may be argued that indicators about innovation hampering factors that are based on firm’s assessments have a likely drawback: it is possible that firms which have implemented innovative projects are less reluctant to give details about the diffi-culties they have encountered when running these projects than firms which were not able to start any innovative project. However, this direct information allows to avoid the interpretation problems of indirect indicators, especially cash-flow. Moreover it provides a specific (and new) information about the financial problems encountered by firms for innovative projects whereas accounting variables or credit rating index reflect the global financial situation of the firm.
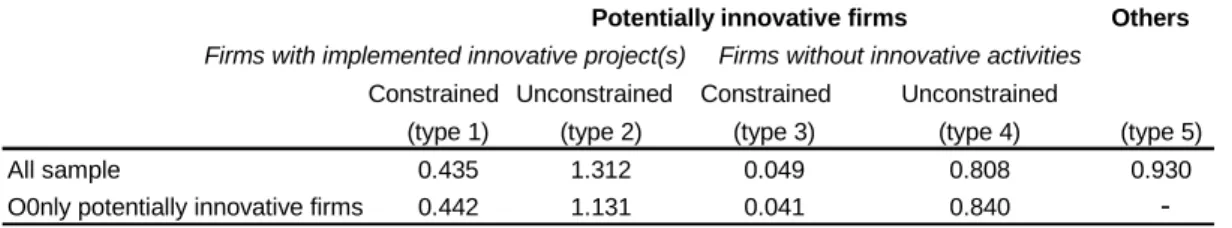
In our sample, for the quasi-totality of financially constrained firms, the financing constraint simply lies in the absence of external financing sources (see table 1). On top of that, 45% of the firms facing financial constraints declared having suffered from the slowness in the setting up of the financing and about 22% claim they have faced too high interest rates.4 The existence of financing constraints mainly induced the projects to be non started (for 55.43% of constrained firms) or delayed (44.86% of constrained firms).
[INSERT TABLE 1 ABOUT HERE]
3It is worth noticing that firms were allowed to tick more than one answer. 4
3.3
Sample definition
The survey gives information about financial constraints and other innovation obsta-cles:
- Excessive perceived economic risk - Lack of qualified personnel - Innovation costs too high
- Excessive get out clause in the shareholder agreement - Lack of knowledge about ad hoc financial networks
By considering the existence of all innovation obstacles listed in the survey, the surveyed sample can be divided into five types of firms:
1. Firms which undertake innovative projects despite financial constraints (and eventually some other innovation obstacles). We define this category as type 1. 2. Innovative firms without financial constraints (but which may eventually face other non financial obstacles). We define this category as type 2.
3. Non innovative firms encountering financial constraints (and eventually some other innovation obstacles). We define this category as type 3.
4. Non innovative firms without financial constraint but which face other non financial innovation obstacles. We define this category as type 4.
5. Non innovative firms without any innovation obstacles. We define this category as type 5.
The four first categories are composed of firms having innovative projects: some of them succeed in implementing them (type 1 and type 2) and the other ones fail to start their innovative project (type 3 and type 4). Thus, these four types of firms may be defined as "potentially innovative".
The last category (type 5) contains firms without innovative projects and conse-quently, which do not face financial constraints for innovation. In other words, as these firms do not want to innovate, they are not concerned by innovation hampering factors.
The distribution of firms according to these categories is shown in table 2. [INSERT TABLE 2 ABOUT HERE]
3.4
Some descriptive statistics
The overall proportion of firms that can be considered to be engaged into innovative activities is, in our sample, 41.80%.
Among the firms having innovative projects, these which succeeded in imple-menting them appear to suffer more often (proportionally) from financial constraints (about 18.30%) than do non-innovative firms (about 10.35%).
From table 3, we can notice that established firms with implemented innovative projects are larger than the other ones.
By looking at sector-based figures, we can see that the fraction of innovative/non-innovative firms as well as that of financially constrained/unconstrained firms vary a lot across manufacturing sectors.
[[INSERT TABLE 4 ABOUT HERE]
The electrical and electronic equipment industry is characterized by the highest rate of innovative firms (68.02%) whereas the wood and wood products industry and the textile industry have the lowest (respectively 26.79% and 27.52%). These differ-ences between manufacturing sectors are quite similar to those observed in terms of financial constraints. While, on average, 17.25 % of the firms suffer from financing constraints, this proportion amounts to 30.18% in the electrical and electronic equip-ment sector and to 27.68% in the transport equipequip-ment industry. It is only about 9% in the wood and wood products industry and around 11.11% in the leather industry, both industries being globally less innovative.
In order to identify possible differences in the risk of each type of firm, we have examined the industry score constructed by the Banque de France (Bardos 1998). It is a composite indicator of company risk and consists of a linear combination of symptomatic ratios such as the profitability, solvency, debt and cash ratios. This indicator is constructed such as lower the score, the riskier the company’s position and is used as a tool by the Banque de France to establish an individual financial diagnosis.
[INSERT TABLE 5 ABOUT HERE]
Unlike Planès et al. (2002), we find significant differences concerning the risk of the firms which may seem quite surprising (Table 5): innovative firms are less risky than non innovative ones. By considering the existence of financial constraints, a hierarchy in terms of risk can be established. The less risky firms appear to be those with implemented innovative projects and being financially unconstrained; but at the same time, innovative firms facing financing constraints are riskier than unconstrained firms without innovative activities. The firms facing financing constraints and which do not undertake innovative project are the riskiest ones. Finally, we can notice that the group of firms not interested in innovation (type 5) enjoys a good risk indicator. In order to try to understand these differences, let us examine firms’ balance sheet structure5 depending on the possible existence of financial constraints and/or that of innovative nature (e.g. Planès et al. 2002).
[INSERT TABLE 6 ABOUT HERE]
5The descriptive statistics relative to corporate balance sheets are calculated by accounting for
composition effects: in order to neutralize size and sector effects, the average variables for the five categories of firms are calculated through variance analysis.
Investment significantly differs across each type of firm, especially as regards in-tangible investment6 (table 6). As expected, innovative firms and particularly the financially constrained ones have a higher immaterial expenditures ratio (immater-ial expenditures divided by added value). It amounts to 6.19% for financ(immater-ially con-strained innovative firms and to 4.00% for non innovative unconcon-strained firms. These differences are mainly explained by the R&D expenditures. Larger immaterial ex-penditures for innovative firms is a risk factor which may induce some reluctance of external investors to bring funds.
Another interesting feature is the existence of an apparent hierarchy between each category of firms concerning their ability to earn profits. It may be established by various income ratios such as the gross operating profit margin, the share of financial fees in added value or the self financing capacity ratios (table 6). Not surprisingly, the firms without financial constraints seem to perform better than the financially constrained ones. In addition, in each case, innovative firms have better ratios than non innovative ones whether or not they face financial constraints.
Some papers about investment and financing constraints use the dividends dis-tribution to discriminate between likely financially constrained firms and likely un-constrained ones (for instance Fazzari et al. 1988). Our data are coherent with this idea: the share of dividends distribution in the added value of non constrained firms (4.97% for the innovative ones and 3.07% for the non innovative ones) is higher than the average ratio of the constrained firms (2.40% for the innovative firms and 2.60% for non innovative firms).
[INSERT TABLE 7 ABOUT HERE]
The financing structure confirms the significant differences between each type of firms in terms of financial reliability (Table 7). Own financing and financial debt are discriminating factors when comparing the innovation behavior and the financial constraints of the different categories of firms. The average share of own financing in the total sources of funds (measured as the sum of own financing, market financing and financial debt) varies between 78.80% for unconstrained innovative firms and 67.12% for non innovative firms facing financial constraints. In the same way, financial debt represents only 21.19% of the total source of funds for innovative firms without financial constraints while it amounts to 32.88% for non innovative firms having financing constraints. By analyzing the components of the financial debt, we can see that these differences come from bank loans (and especially short term bank loans which are an indicator of firm’s financial fragility) and from the other extra-group financial debt, while the financing by the group (when relevant) does not appear significantly different between the categories of firms. For instance, the firms which
6The French tax code states that companies are free to book operating expenditure for scientific
or technical research either as fixed assets or as expenses. The Banque de France Sheet data Office separates off some items of the expenditure book as expenses, which makes it possible to reincorporate these expenditures within intangible investment. Nevertheless, it remains a part of the expenses, essentially outsourcing of R&D activities which are not reincorporated in immaterial expenditures.
undertake innovative projects and which do no have financial constraints use only 5.96% of their total source of funds as short term bank loans, whereas it represents 8.82% for constrained innovative firms and 13.74% for non innovative firms facing financial constraints.
Thus, as it was showed by Planès et al. (2002), innovative firms enjoy a better financial situation than non innovative ones, everything else being equal. This is consistent with the idea that there is a sort of selectivity concerning the decision to innovate for the firms which perform better (Bond et al. 1999).
Now, the following section proposes to properly evaluate whether financing con-straints affect firms’ decision to innovate.
4
ECONOMETRIC RESULTS
In this econometric analysis, financing problems are alternatively taken into account by proxies (as it was done in the earlier literature) and by our qualitative variable specifying the existence of financial constraints for firm’s innovative projects. From the econometric point of view, two specifications are used to model the role of finan-cial factors in the decision to innovate: a simple probit model and then a bivariate recursive probit that accounts for the likely endogeneity of our qualitative indicator of financial constraints.
4.1
Innovation decisions with proxies of the existence of financial
constraints
Following Crépon et al (1998), we first define a univariate probit where the decision to implement an innovative project depends on “traditional” determinants of the decision to innovate emphasized by the literature like the firm size, its market power, technological push and demand pull indicators. However, we supplement the model by adding financial variables to account for possible financial constraints.
In other words, we specify the latent variable y∗
1i underlying this probit model as:
y∗1i= x1ia1+ zia2+ ui. (1)
The latent variable y1i∗ can be interpreted as reflecting the expected return of firm’s innovative projects. In x1i, the “traditional” determinants of innovation are
included and zi accounts for financial determinants of innovation.
More precisely, x1i includes:
- firm’s size measured as the logarithm of the number of employees, in order to allow for a non linear relationship;
- firm’s market power measured as the share of the firm’s sales in the total sales of the sector;
- technology push indicators. The importance of technological opportunities is given by a qualitative measure issued from the FIT survey. The same indicator was used by previous works such as Crépon and al. (1998, 2000) or Barlet and al. (1998).
In the survey, the firms are asked :“Do You consider that Your market is techno-logically : not innovative? weakly innovative? moderately innovative? or strongly innovative?”. We take the first level “not innovative“ as reference and include in the regression three dummy variables TP2, TP3 and TP4 for the other levels. We expect a positive impact of these technologic push variables, increasing with the intensity of innovation opportunities.
- Industry dummies according to French classification NAF037. The manufacture of electrical and electronic equipment is taken as reference. As we mentioned earlier, this sector is characterized by the highest percentage of innovative firms. We expect the coefficients of these dummies to be negative8. As the survey does not give in-formation about the demand pull, the industry dummies account for demand effect proper to an industry. They also account for differences of risk across sectors.
As proxies for financing problems, we use cash-flow, the Banque de France risk companies indicator and some accounting financial variables from the Banque de France Balance Sheet Dataset. These financial accounting variables are the follow-ings:
- the share of the banking debt,
- the share of the own financing in the firm’s total financing resources9.
These variables reflect firms’ financing structure. A weak financing structure (i.e. small own financing ratio or high banking debt ratio) may induce financing constraints, and thus may hamper innovation.
- the logarithm of the amount of tangible assets accounts for the collateral that the firm is able to provide to obtain banking loans.
- the economic performance of the firm as measured by the gross operating profit margin ratio. A firm having low past profit margin may face financing constraints and then, may have difficulties to run innovative projects.
Let us remind that in the FIT survey firms were asked about their innovative behavior and possible constraints over the years 1997-1999. To ensure that there is no time inconsistency in the definition of the dependent variable and the regressors, the latter are taken at their value measured ex ante, in 1996. Moreover, we run the estimations on the subsample including only potentially innovative firms: we exclude the firms without innovative projects and thus which cannot face innovation hampering factors (firms of type 5)10.
4.1.1 Firm size as a proxy for financial problems
The first column of table 9 shows the results obtained with the same type of specifica-tion as Crépon et al. (1998). All significant estimates present the expected sign and we obtain very similar results as Crépon et al. (1998). We find that the probability of
7This French classification is closed to the NACE.
8It would be interesting to know how past decisions about innovation and past financing
con-straints affect the present ones. Unfortunately, there are no available panel data with this informa-tion.
9
See variables definition in appendices (table 10).
undertaking innovative projects increases with firm’s size, with its market share and with technology push indicators. Moreover, there are significant differences across sectors.
[INSERT TABLE 9 ABOUT HERE]
In the FIT survey we have no information to construct demand pull indicator as it was done by Crépon et al. (1998). In order to try to account for demand effect, we have introduced the growth rate of sales of the firm between 1996 and 1997. But we do not obtain a significant estimate. However, as mentioned earlier, the industry dummies allow to control for specific demand effect in each industry sector.
In this context of technological innovation, past R&D investment is probably a relevant factor explaining the innovation function. We introduce the past R&D ex-penditure (of the year 1996) in our innovation equation (second column of table 9). It is measured as the logarithm of the firm’s R&D investment. For firms without R&D activity, we set this variable to zero. In addition, as Mairesse and Cuneo (1985), we introduce a dummy variable indicating whether the firm perform R&D activity or not. But, we do not find a significant effect of the R&D investment. We suspect that it is due to measurement errors of our R&D variable. In general, French accounting data are not relevant to measure R&D investment because the French tax code states that companies are free to book operating expenditure for scientific or technical re-search either as fixed assets or as expenses. The Banque de France Sheet data Office separates off some items of the expenditure book as expenses, which makes it pos-sible to reincorporate these expenditures within intangible investment. However, a likely problem of measurement errors of our R&D variable has to be considered when estimating our innovation equation. We try to account for this problem by using the two step conditional maximum likelihood approach proposed by Rivers and Vuong (1988): we regress our R&D investment variable on some explaining factors and then include the estimated residuals of this regression in the probit innovation equation (table 10). Unfortunately, we do not have good information about factors explaining firms R&D investment of the year 1996. We use sector dummies, an indicator of the innovative position of the firm in comparison with its reference market (that is given by the survey) and the growth rate of firm sales between 1995 and 1996.
[INSERT TABLE 10 ABOUT HERE]
By doing that, we find a significant positive effect of R&D investment on the likelihood to implement innovative projects. Unfortunately, using past variables (ie, before 1996) leads to reduce our sample from 1082 firms to 905 firms because we do not have this information for all firms. Moreover the estimation of the R&D equation cannot be considered as satisfactory. In particular, we obtain a very poor indicator of goodness of fit. It is due to the use of a linear estimation (OLS) whereas R&D investment is characterized by null value for non participants. So, we decide to not consider R&D investment in the innovation equation (as in Crépon et al. 1998), in the next regressions.
4.1.2 Cash-flow and other financial and economic variables
In table 11, we introduce cash-flow as an indicator of the existence of financial con-straints and find a significant positive effect. Although the marginal effect seems to be small (0.0022 at the sample mean), the estimated coefficient is strongly significant and the marginal effect is larger for small and medium sized firms than for large firms (respectively 0.0025 and 0.0006). Thus, this cash-flow effect may reflect the existence of financial constraints significantly affecting innovation.
[INSERT TABLE 11 ABOUT HERE]
In the second column of table 11, variables reflecting the firms’ ex ante financing conditions and economic performance are used to take into account likely financing problems for innovation. We find that getting strongly into banking debt reduces the likelihood of implementing innovative projects. In addition, the economic perfor-mances (measured by the operating profit margin ratio) seem to have a significant positive effect on the probability of undertaking innovative projects. Nevertheless, the profit margin may be endogenous as past innovation behavior may lead to enjoy higher profit margin. Thus, we use the Rivers and Vuong approach by regressing the gross operating profit margin on the lags of an investment rate ratio (investment divided by added value of the year 1995) and of past self-financing capacity ratio and industry dummies. The Lagrange multiplier test does not reject the exogeneity of the gross operating profit margin, and the two steps conditional maximum likelihood estimation confirms the positive impact of past profit margin on innovation (see table 11 bis).
Finally, if the cash flow variable and the past operating profit margin are in-troduced together, as these two variables are strongly related, we do not obtain significant effects any more (column 3 of table 11).
4.1.3 Company risk indicator
Finally, we use a latest proxy for financing constraints: the company risk indicator of the Banque de France (named the industry score). As mentioned earlier, it is an indicator of the firm’s risk based on accounting information. It is constructed as a combination of symptomatic risk ratios. Thus, it is not established by expert judge-ments like a credit rating index. This indicator decreases with the risk of the firm. We get a positive significant effect of the company risk indicator: unsurprisingly, firms that enjoy a better risk indicator are more likely to implement innovative projects (table 12).
If we add our previous accounting variables in this regression (cash-flow, profit margin, banking debt and own financing ratio), they are not significant and the risk indicator becomes non significant, too. It may be easily explained by the redundancy of information carried by the accounting ratios and the risk indicator.
As a conclusion, the estimations with proxies of financial constraints may lead to think that financing problems play a significant role for innovation. We have found that large firms are more likely to implement innovative projects than smaller ones. It can be explained by their better relations with external providers of funds as well as by their stronger capacity to amortize innovation sunk costs. In addition, we have obtained a weak but strong significant effect of cash-flow on the propensity to innovate. Moreover, we have emphasized the significant role of past banking debt and economic performances. The effect of these accounting and financial variables have been confirmed by the company risk indicator.
Now, let us see what are the results obtained with our direct indicator of the existence of financial constraints for innovation.
4.2
The direct measure of the existence of financing constraints
As explained in section 3.2, the measure of the existence of financing constraints given by the FIT survey is a qualitative indicator. It reflects the specific financing problems of innovation within the firm whereas our previous proxies were related to the global financial situation of the firm. The question of the endogeneity of the financial constraint variable is then highly relevant. First, there are many reasons to suspect that the decision of undertaking innovative projects and the probability of facing financing constraints are both affected by unobservable heterogeneity. The uncertainty associated with the output of the innovative project or the eventual con-fidentiality of the project for strategic reasons are unobservable firm’s specific risk factors which may create or worsen financial constraints. In addition, we have no information concerning the duration needed to bring the innovative project onto the market whereas this factor may have an effect both on the innovation decision and on the likelihood of facing financing problems. Second, the decision to implement inno-vative projects and the likelihood of facing financing constraints for these innoinno-vative projects have probably to be envisaged as simultaneous questions. With our data, this problem of simultaneity is likely to be reinforced by the fact that the survey period includes three years and we observe the innovation decision and the financial obstacles globally for this three years.
From the econometric point of view, a standard probit is not relevant in the case of qualitative endogenous explanatory variables. Thus, we propose to estimate si-multaneously the likelihood to implement innovative projects and the probabilities of facing financial constraints by a recursive bivariate probit model (Greene 1998). Such a specification was previously used by Ploetscher and Rottmann (2002) to emphasize the role of financial constraints on investment.
4.2.1 A qualitative simultaneous model
We consider the decision to innovate and the likelihood of facing financial constraints as simultaneous questions. Each variable is likely to affect the other one: the existence of financing constraints by reducing the likelihood to implement innovative projects and the innovation behavior by creating financing difficulties. Thus, a latent model
accounting for these relations is: ½ y∗ 1i= x1iβ1+ γ1y2i+ ε1i y∗2i= x2iβ2+ γ2y1i+ ε2i (2) where y∗
1i and y2i∗ represent respectively the expected return of firm’s innovative
projects and the (unobservable) severity of financial constraints; x1i and x2i are
exogenous factors explaining the decision to innovate and the existence of financing constraints. Thanks to the survey we use, we know whether or not the firm undertook innovative projects and whether or not it suffered from financial constraints. We observe: ½ y1i= 1 if y1i∗ ≥ 0 y1i= 0 if y∗1i< 0 and ½ y2i= 1 if y2i∗ ≥ 0 y2i= 0 if y2i∗ < 0
Unfortunately, this model is inconsistent (Maddala 1983, Gouriéroux et al. 1980, Lewbel 2005, Hajivassiliou 2005) and some restrictions are needed on the coefficients to be logically consistent. These conditions for logical consistency have been examined by previously cited authors. They show that this model is logically consistent if and only if γ1 or γ2 is set equal to zero. Here we consider the model obtained by setting
γ2 equal to zero: ½
y∗
1i= x1iβ1+ γ1y2i+ ε1i
y∗2i= x2iβ2+ ε2i (3)
Concerning the identification of estimated parameters, some conditions has to be imposed, too. As y∗1iand y∗2iare observed as dichotomous variables, it is necessary to adopt the standard normalization of the variance of the errors (for instance see Train 2003). We assume that the error terms are independently and identically distributed as bivariate normal with variance equals to one and a correlation coefficient between ε1i and ε2i equals to ρ: µ ε1i ε2i ¶ à Φ2 µ∙ 0 0 ¸ , ∙ 1 ρ ρ 1 ¸¶
No additional restrictions on the parameters are needed to achieve the identifica-tion of this bivariate probit model with endogenous dummy regressor (Wilde 2000, Monfardini and Radice 2006). Moreover, this was demonstrated by Heckman (1978) in a more general context11.
1 1
There is some confusion about this question because of Maddala’s assertion (1983, p 222). He states that the parameters of the first equation are not identified if there is no exclusion restriction on the exogenous variables (as in the linear case). But Wilde (2000) shows that this is only true in the simple example of Maddala’s book where x2i and x1i are both constants. Wilde shows that
identification in the simultaneous probit case is achieved as soon as both equations of the model contain a varying exogenous regressor (and he takes exemple of a dichotomous variable entering both equations). However, as examined by Monfardini and Radice (2006), without instruments, the identification of the parameters of the first equation strongly relies on the functional form of the distribution of errors and in practice, availability of instruments help to obtain results more robust to distributional misspecification.
From the econometric point of view, the endogenous nature of y2 in the first
equation of (3) does not modify the likelihood of the standard bivariate probit (Greene 1998, 2003). It is due to the fact that the joint probability (for instance Pr (y1 = 1, y2 = 1)) which enters in the likelihood without endogeneity problem is
equal to the product of the conditional and marginal probabilities (Pr (y1 = 1|y2 = 1)∗
Pr(y2 = 1) in the likelihood where y2 is an endogenous explanatory variable for the
first equation : Pr(y1 = 1, y2 = 1) = Pr( y1= 1|y2 = 1) ∗ Pr( y2= 1) = Φ2(x1β1+ γy2, x2β2, ρ) Φ (x2β2) ∗ Φ (x 2β2) (4) = Φ2(x1β1+ γ1y2, x2β2, ρ)
where Φ2 is the cumulative distribution function of the bivariate normal
distrib-ution and Φ (.) is the univariate normal cumulative distribdistrib-ution function. Then, in the recursive bivariate probit, the probabilities of each events: - being innovative and financially constrained (y1i= 1, y2i= 1),
- being innovative and financially unconstrained (y1i= 1, y2i= 0),
- not being innovative but being financially constrained (y1i= 0, y2i= 1),
- not being innovative nor financially constrained (y1i= 0, y2i= 0)
are just given by the value of the bivariate normal cumulative distribution func-tion, like in a standard bivariate probit model without endogeneity.
These probabilities are :
Pr(y1 = 1, y2= 1) = Φ2(x1β1+ γ1, x2β2, ρ)
Pr(y1 = 1, y2= 0) = Φ2(x1β1, − (x2β2) , −ρ)
Pr(y1 = 0, y2= 1) = Φ2(− (x1β1+ γ1) , x2β2, −ρ)
Pr(y1 = 0, y2= 0) = Φ2(− (x1β1) , − (x2β2) , ρ)
The correlation coefficient ρ between the disturbances accounts for the possible existence of omitted or unobservable factors which may affect simultaneously the decision to innovate and the likelihood of facing financing constraints. If ρ = 0, y2i is not correlated with the error term ε1i. In this case, the two equations could
be estimated separately as univariate probit equations. Whereas, if ρ 6= 0, a joint estimation is required to obtain consistent estimates.
The calculation of the marginal effects in the recursive bivariate probit model is shown in Greene (1998). For a continuous variable which enters in both equations (for instance, firm’s size), the total effect on the probability of undertaking innovative projects is the sum of a direct effect (due to Pr (y1|y2,x1)) and an indirect effect
(through Pr (y2|x2)). For a qualitative variable the marginal effect is measured by
the difference between the conditional probabilities. For example, the marginal effect of the existence of financing constraints on the likelihood of implementing innovative projects is:
Pr(y1 = 1|y2= 1, x1, x2) − Pr(y1 = 1|y2 = 0, x1, x2)
= Φ2(x1β1+ γ1, x2β2, ρ)
Φ (x2β2) −
Φ2(x1β1, x2β2, ρ)
Φ (x2β2)
To define the explanatory variables x1 of the innovation equation we try to have
a similar specification as Crépon et al. (1998). Thus, we consider the same list of explanatory variables as in section 4.1.1 (firm’s size, its market share, technology push indicators and industry dummies) and, of course, we add the dummy reflecting the existence of financial constraints.
Concerning the financial constraint equation, the explanatory factors x2 are
es-sentially the risk associated with the investment and the asymmetric informational problems between the firm and external investors. Thus, we include the following variables in the financial constraint equation:
- The size of the firm is a widespread measure of information asymmetries. Large firm are more renowned, it is easier to obtain indications about their activities, about their performances or their managers’ education. Consequently, the size of the firm (measured by the log of the number of employees) is expected to have a negative impact on the probability of facing financial constraints.
- The importance of collateral value that a firm is able to engage to obtain a loan is another risk factor measured by external investors. It may be easier for firm with strong collateral value to borrow from external investors. Consequently, the collateral variable may have a negative impact on the probability of facing financing constraints.
- The importance of own financing is a positive indication concerning the financing reliability, whereas too high financial debt seems as a weakness of the balance sheet structure. So, the two ratios related to the ex ante financing structure may have opposite effects on the probability of facing financial constraints: a negative one for the own financing ratio and a positive one for the bank loans ratio.
- Finally, we control for differences about risk across sectors by including sector dummies. Like for the innovation equation, we take the manufacture of electrical and electronic equipment as reference. This sector presents the higher proportion of financially constrained firms. So, the sector dummies are expected to have negative signs.
4.2.2 Estimation results
The likelihood of undertaking innovative projects and the probability of facing fi-nancial constraints have been estimated i) separately (table 13, column 1) and ii) simultaneously by allowing a correlation between the errors of the two equations (table 13, column 2).
[INSERT TABLE 13 ABOUT HERE]
The first striking result is the fact that we do get a strong and significant negative impact of financial constraints on firms’ propensity to be innovative. The estimation
of the bivariate probit shows a strong correlation between the error terms of the innovation and financial constraints equations (ρ = 0, 574). Accounting for the endo-geneity of the financial constraint, we obtain a larger effect of the financial constraints, while all other estimates remain unchanged. Consequently, elements of unobservable heterogeneity affecting both the existence of financial constraints and the probability to innovate play a great role and must be taken into account when we estimate the impact of financial constraints on firms’ decision to innovate.
According to the estimated marginal effect (table 14), financing constraints are an important innovation hampering factor: the existence of financing constraints reduces by 22% the likelihood to implement innovative projects, everything else being equal. As expected, the likelihood that a firm implements innovative activities increases with the importance of technological opportunities in its environment. In addition, the sector indicators show strong disparities in the probability of undertaking innov-ative projects across industries. We find that firm size as well as its ex ante market share have significant positive impacts on the decision to implement technologically innovative projects.
[INSERT TABLE 14 ABOUT HERE]
Concerning the likelihood of facing financial constraints, it is also worth noticing that the estimation also provides quite satisfactory results. A strong gross operating profit margin ratio reduces the probability of facing financial constraints while the banking debt ratio has a positive impact on the likelihood of being financially con-strained. Industry dummies reveal significant differences across sectors. This result can be interpreted as reflecting the existence of significant differences concerning the risk of the various manufacturing sectors.
The estimations in table 13 do not reveal significant effects of firm size and of the amount of collateral. To check for a possible redundancy problem due to the introduction of both variables, we run the estimations without the collateral (table 15, column 1), but we do not obtain a significant effect of firm size on the probability of facing financial constraints. However, the effect of firm’s size in absolute terms on innovation is mainly justify in the literature by financing reasons (Cohen and Keppler, 1996). Here, the existence of financing problems is already taken into account by the qualitative variable, thus, we estimate firm’s probability to implement innovative projects without using firm’s size as explanatory variable (table 15, column 2).
By doing that, we get a significant effect of firm size on the likelihood of fac-ing financial constraints. Moreover, the absolute value of the estimated coefficient associated with the financing constraint variable increases from -1.306 to -1.473.
[INSERT TABLE 16 ABOUT HERE]
As a conclusion, the existence of financing constraints affects significantly firms decision to engage into innovative activities. The probability of facing financing problems for innovation decreases with firm size. It also depends on firm ex ante financing structure, on its past economic performances and on firm industry sector.
In the next section, we perform some robustness tests in order to confirm these results.
4.3
Some robustness tests
4.3.1 Sample definition: estimation on the full sample
All previous estimations are obtained with the subsample containing only potentially innovative firms. Here, we want to check if our results are modified when we run the regressions on the full sample (ie, by including the firms with type 5).
The results presented in table 16 confirm that financial constraints significantly reduce the likelihood to implement innovative project. By estimating simultaneously both equations (column 2 of table 16), we find a negative significant effect of the ex-istence of financing constraints on the likelihood to implement innovative projects on the full sample. This estimation confirms the strong correlation between the distur-bances of the two equations (ρ = 0.604). If we ignore it, we would obtain an estimate so biased that it would lead to a surprising and incoherent result: a significant pos-itive effect of the financial constraint (column 1 of table 16) on innovation. Thus, the estimation on the full sample confirms that the endogenity problem between the innovation decision and the existence of financial constraints is highly relevant and that it must be taken into account in the estimation procedure.
[INSERT TABLE 16 HERE]
4.3.2 Firm’s size: are medium sized firms more affected by financing
problems?
In our previous regressions, firm’s size is measured by a continue variable (the log-arithm of the number of employees) while only firms with a specific size may face financing constraints. For instance, Passet and Du Tertre (2005) argue that financing constraints may be particularly relevant for medium sized firms. They emphasized that the French state expenditure on R&D is focused on large and small firms. On the one hand, large firms benefit from public funds, essentially for military defense or through important technology programs of the European Union. On the other hand, small firms may use subsidized loans or advances which have to be paid off only if the project becomes successful. In addition, young innovative firms may enjoy an attractive fiscal policy12. Thus, medium sized firms are relatively neglected by the public expenditure for innovation.
To check for this possibility, we include alternatively a quadratic term for firm size and we use a qualitative measure of size (see table 17).
By including the quadratic size term we do not find that it has a significant effect (columns 2 and 4 of table 17). Consequently, we do not find that the link between the probability of having financing constraints for innovation and firm size may be characterized by an U inverted relationship for established firms.
To examine by another way the existence of a specific financing problems for medium sized firms we define three categories:
- small size (firms with less than 100 employees)
1 2
The french legal status ”Jeune entreprise innovante” (Young innovative firm) allows to enjoy tax exemption.
- medium size (firms having between 100 and 500 employees) - large size (firms with more than 500 employees)
We take small size as reference. Our results are similar as those obtained with the continue variable: we find that financing problems are less likely to occur when firm’s size increases, but the discrete measure of firm size does not reveal a specific problem for medium sized firms (column 3 of table 17).
[INSERT TABLE 17 ABOUT HERE]
4.3.3 Firm’s collateral and the role of the group affiliation
It is particularly difficult to define innovative firm’s collateral. We used the amount of tangible assets and we do not find that it has a significant effect on the probability of facing financial constraints (table 13). But tangible assets may be firm’s specific due to the firm’s innovative character. We explore an alternative measure of firm’s ability to repay its creditors: a dummy variable identifying whether the firm belongs to a group or not. The head of group may provide guarantees for its subsidiary companies. Thus, from the creditors’ point of view, subsidiary companies may offer more guarantees than independent firms. Another argument for taking into account firm’s membership of a group is the possible role played by funds given by the head of the group (Kremp and Sevestre 2000). These financing source may weaken the need for external funds and may reduce firm’s probability of facing financing constraints for its innovative projects. Thus, we introduce this dummy variable identifying whether the firm belongs to a group or not. We perform other checks by including cross variables (size*groupe or collateral*groupe) to account for a likely different effect of the size or of the collateral for the firms belonging to a group on the probability of facing financing constraints. Nevertheless, we do not find a significant effect of the group affiliation on the existence of financial constraints for innovation (table 18). This can probably be explained by the fact that our group indicator is a too crude measure. To properly take into account the role of the financings from the group, more detailed information about the group structure would be necessary. This cannot be envisaged here with the data we used. However, it remains an interesting question to be studied in future research.
[INSERT TABLE 18 ABOUT HERE]
5
CONCLUSION
In this paper, we estimate the impact of financial constraints on the decision to engage into innovative activities. We use a qualitative indicator of the existence of financial constraints based on firm’s own assessment which allows to avoid the traditional problems linked to the interpretation of cash-flow effects.
This paper shows that the likelihood that a firm will implement innovative projects is significantly reduced by the existence of financing constraints. This reduction is estimated to amount to 22.3% everything else being equal. Moreover, we obtain the traditional results: firm’s ex ante market share has a positive effect on the decision
to innovate, the propensity to innovate also depends on technology opportunities in firm’s environment.
By considering the existence of financing constraints as endogenous to the inno-vation decision, we stress the role played by some factors on the existence of financial constraints. We find that the likelihood that a firm faces financial constraints for its innovative projects decreases with firm’s size. Financing problems for innovation are also explained by firm ex ante financing structure, by its past economic performances and by sector-based factors.
To better evaluate the origin of these financing constraints, it would be interesting to have more information about the projects themselves (in particular concerning the duration of the project from the R&D stage to the introduction of the output onto the market). Finally, to go deeper into this question of financing for innovation in established firms, future research would have to examine the role of the financing within the company for firms belonging to a group structure.
References
[1] Aghion P., Bloom N., Griffith R., Howitt P., Blundell R. (2002), “Competition and Innovation : An Inverted U Relationship”, NBER Working Paper n◦W 9269. [2] Arrow K.J. (1962), “Economic Welfare and the Allocation of Resources for In-novation”, in: Universities-National Bureau Committee for Economic Research, The Rate and Direction of Inventive Activity. Princeton.
[3] Bardos M. (1998), “Detecting the Risk of Company Failure at the Banque de France”, Journal of Banking and Finance, 22, 1405-1419.
[4] Barlet C., Duguet E., Encaoua D., Pradel J. (1998), “The Commercial Success of Innovations: An Econometric Analysis at the Firm Level in French Manufac-turing”, Annales d’Economie et de Statistique, n◦49/50, 457-478.
[5] Bond S., Harhoff D., Van Reenen J. (1999), “Investment, R&D, and Financial Constraints in Britain and in Germany”, IFS working paper, n◦ 99/5.
[6] Blundell R., Griffith R., Van Reenen. (1999), “Market Share, Market value and Innovation in a Panel of British Manufacturing Firms”, Review of Economic Studies, 66, 529-554.
[7] Cohen W.M., Klepper S. (1996), “A Reprise of Size and R&D”, The Economic Journal, 106, 925-951.
[8] Cohen W.M., Levin R.C (1989), “Empirical Studies of Innovation and Market Structure”, in R. Schmalensee and R.D Willing, Handbook of Industrial Organi-zation, North-Holland, chapter 18, 1060-1107.
[9] Crépon B., Duguet E., Mairesse J. (1998), “Research, Innovation and Produc-tivity: An Econometric Analysis at the Firm Level”, Economics of Innovation and New Technology 7, 115-158.
[10] Crépon B., Duguet E., Mairesse J. (2000), “Mesurer le Rendement de l’Innovation”, Economie et Statistique, n◦334, 65-78.
[11] Czarnitzki D.(2005), “Research and Development in Small and Medium-Sized Enterprises: the Role of Financial COnstraints and Public Funding”, forthcom-ing in the Scottish Journal of Political Economy.
[12] Dasgupta P., Stiglitz J.E.(1980), “Industrial Structure and The Nature of Inno-vative Activity”, The Economic Journal, 266-293.
[13] Fazzari S.M, Hubbard R.G., Petersen B.C. (1988), “Financing Constraints and Corporate Investment”, Brookings Papers on Economic Activity, 141-195. [14] Galia F., Legros D., “Complementaries between obstacles to innovation:
evi-dence from France”, Research Policy, n◦33, 1185-1199.
[15] Gouriéroux C., Laffont J.J, Monfort A. (1980), “Coherency Conditions in Simul-taneous Linear Equations Models with Endogenous Switching Regime”, Econo-metrica, 48 (3), p 75-96.
[16] Greene W.H. (1998), “Gender Economic Courses in Liberal Arts Colleges: Fur-ther Results”, Journal of Economic Education, 291-300.
[17] Greene W.H. (2003), Econometric Analysis, Fifth Edition, Prentice Hall
[18] Hajivassiliou V., (2005), “The Method of Maximum Smoothly Simulated Like-lihood for LDV Models with Simultaneity and Dynamics”, mimeo.
[19] Hall B. H. (2002), “The Financing of Research and Development”, Oxford Review of Economic Policy, vol 18, n◦1, 35-51.
[20] Harhoff D. (1998), “Are There Financing Constraints for R&D and Investment in German Manufacturing Firms”, Annales d’Economie et de Statistique, n◦49/50,
421-456.
[21] Harris M., Rogers M., Siouclis A. (2003), “Modelling Firm Innovation Using Panel Probit Estimators”, Applied Economic Letters, vol. 10(11), 683-686. [22] Heckman, J.J (1978), “Dummy Endogenous Variables in a Simultaneous
Equa-tion Model”, Econometrica, 46, p 931-959.
[23] Himmelberg C., Petersen B., (1994), “R&D and Internal Finance: A Panel Study of Small Firms in High-Tech Industries”, Review of Economics and Statistics, 76, 38-51.
[24] Jensen M.C, Meckling W.H. (1976), “Theory of the Firm : Managerial Behavior, Agency Costs and Ownership Structure”, Journal of Financial Economics, 305-360.
[25] Janz N., Peters B. (2002), "Innovation and Innovation Success in the German Manufacturing Sector, Econometric Evidence at the Firm Level”, Manuscript. [26] Janz N., Lööf H., Peters B. (2003), “Firm Level Innovation and Productivity :
Is there a Common Story Across Countries?”, ZEW Discussion Paper n◦03-26. [27] von Kalckreuth, U. (2004), “Financial Constraints for Investors and the Speed of Adaptation: Are Innovators Special?”, Discussion Paper of the Economic Research Centre of the Deutsche Bundesbank, No. 20/04.
[28] Kaplan S.N, Zingales L. (1997), “Do Investment-Cash Flow Sensivities Provide Useful Measures of Financing Constraints?”, Quarterly Journal of Economics, February, 169-215.
[29] Kaplan S.N, Zingales L. (2000), “Investment-Cash Flow Sensitivities Are Not Valid Measure of Financing Constraints”, NBER Working Paper n◦7659. [30] Kremp E., Sevestre P., (2000), “Financement des entreprises et appartenance à
un groupe”, Economie et Statistique, n◦336.
[31] Lööf H. and Heshmati A. (2002), “On the Relationship between Innovation and Performance: A sensitivity Analysis” Working Paper Series in Economics and Finance 0446, Stockholm School of Economics.
[32] Lewbel (2005), “Coherency of Structural Models Containing a Dummy Endoge-neous Variable”, Boston College Working Papers in Economics n◦456.
[33] Maddala G.S. (1983), Limited-dependent and Qualitative Variables in Econo-metrics, Cambrige University Press.
[34] Mairesse J., Cunéo P. (1985), “Recherche-développement et performances des entreprises. Une étude économétrique sur données individuelles », Revue Economique, vol. 36, n◦05, 1001-1042.
[35] Mairesse J., Hall B.H, Mulkay B.(1999), “Firm-Level Investment in France And The United States: An Exploration of What We Have Learned in Twenty Years”, Annales d’Economie et de Statistique, n◦55-56, 27-63.
[36] Mohnen P., Therrien P. (2002), “Comparing the Innovation Performance of Canadian Firms and those of Selected European Countries: An Econometric Analysis”, CIRANO, Scientific Series, 2002s-80
[37] Monfardini C., Radice R. (2006), “Testing Exogeneity in the Bivariate Probit Model: a Monte Carlo Study”, mimeo.