HAL Id: cea-03190338
https://hal-cea.archives-ouvertes.fr/cea-03190338
Submitted on 28 Apr 2021HAL is a multi-disciplinary open access archive for the deposit and dissemination of sci-entific research documents, whether they are pub-lished or not. The documents may come from teaching and research institutions in France or abroad, or from public or private research centers.
L’archive ouverte pluridisciplinaire HAL, est destinée au dépôt et à la diffusion de documents scientifiques de niveau recherche, publiés ou non, émanant des établissements d’enseignement et de recherche français ou étrangers, des laboratoires publics ou privés.
Laser induced breakdown spectroscopy for plastic
analysis
Qiang Zeng, Jean-Baptiste Sirven, Jean-Christophe Gabriel, Chor Yong Tay,
Jong-Min Lee
To cite this version:
Qiang Zeng, Jean-Baptiste Sirven, Jean-Christophe Gabriel, Chor Yong Tay, Jong-Min Lee. Laser induced breakdown spectroscopy for plastic analysis. Trends in Analytical Chemistry, Elsevier, 2021, 140, pp.116280. �10.1016/j.trac.2021.116280�. �cea-03190338�
1
Laser induced breakdown spectroscopy for plastic analysis
Qiang Zeng1,2, Jean-Baptiste Sirven3, Jean-Christophe P. Gabriel1,4, Chor Yong Tay1,5, Jong-Min Lee1,2 1Energy research institute @ NTU (ERI@N), Nanyang Technological University, 50 Nanyang Drive, Singapore
637553, Singapore
2School of Chemical and Biomedical Engineering, Nanyang Technological University, 62 Nanyang Drive, Singapore 637459, Singapore
3Université Paris-Saclay, CEA, Service d'Études Analytiques et de Réactivité des Surfaces, F-91191 Gif-sur-Yvette, France
4Université Paris-Saclay, CEA, CNRS, NIMBE, LICSEN, 91191, Gif-sur-Yvette, France
5School of Materials Science and Engineering, Nanyang Technological University, 50 Nanyang Avenue, Singapore 639798, Singapore
A b s t r a ct
T he huge consum ption of m odern plastic w ith im proper disposals has posed a great threat to the environm ent and hum an beings. To put these post-consum er plastics into the recycling chain, laser induced breakdow n spectroscopy (L IB S ) has been established as a potential tool for rapid grading of plastics online. M eanw hile, L IB S is a pow erful tool for plastic investigations in the laboratory w ith the capacity of sim ultaneous qualitative and quantitative analysis. T he present review describes the developm ent and prospect of plastic investigations using L IB S , highlighting the intrinsic advantages of L IB S for plastic recycling . M oreover, the selection of hardw are com ponents and analysis m ethods are discussed, w hich m ay help to start a research on plastic using L IB S .
K ey w or d s: Laser induced breakdow n spectroscopy (L IB S ) P lastic recycling Q ualitative Q uantitative O nline analysis
1 . I n t r o d u ct io n
W ith the advantages of lightw eight, outstanding m echanical and chem ical properties, m odern plastics have becom e a staple product w orldw ide. T he w orld plastics production totaled around 359 m illion m etric tons in 2018, com pared w ith 1.5 m illion m etric tons in 1950 [1]. W ith this excess consum ption, the proper disposal of post-consum er plastics becom es a pressing issue. A s a m atter of fact, the traditional disposal m ethods (incineration and landfill), bring about huge resource w aste and num erous adverse effects to environm ent and hum an beings [2, 3]. Indeed, the toxic elem ents released from plastics, such as cadm ium , chrom iu m , lead, m ercury, antim on y and halogens, are harm ful to soil and w aters. Furtherm ore, som e plastic constituents have adverse
2
effects to human beings, such as styrene and 1, 3-butadiene used in the production of polystyrene (PS), which are suspected human carcinogenic substances. Also, the widely used synergist Sb2O3 is classified as possibly carcinogenic [4]. To reduce this risk of exposure, more and more organizations are concerned about effective disposal methods and issue related norms, such as the restriction of hazardous substances directive (RoHS), the restriction for municipal solid waste (MSW) [5] and even some policies from international electrotechnical commission (IEC) [6]. According to the 2011 RoHS directive, the concentrations of hazardous substances such as lead, mercury, hexavalent chromium, polybrominated biphenyls (PBBs) and polybrominated biphenyl ethers (PBDEs) are definitely regulated below 0.1 wt.% in electrical and electronic equipment (EEE). In the particular case of cadmium, the maximum permitted concentration is 0.01 wt.% [7]. Plastic recycling is the most effective method for the disposal of post-consumer plastics, providing the opportunities to reuse polymers and precious metals, and to reduce the use of energy and CO2 emissions [8-10]. Considering the large amount and complexity of discharged plastics, classification and even quantification process should be carried out first. Though the Society of the Plastics Industry (now called Plastics Industry Association) has instituted the plastic coding system, the manual classification by the identification codes is labor-intensive and error-prone, and the contact with discarded plastics could be harmful to workers. Other classification methods depending on the physical properties, such as flotation technique [11], electrostatic techniques [12] and differential scanning calorimetric (DSC) are classic methods. Therein, DSC could be the most reliable method, which depends on the glass transition and the melting temperature of the polymer nature [13]. To improve the analysis efficiency and accuracy, many analytical and characterization techniques were introduced for plastic investigations, including atomic absorption spectroscopy (AAS) [14], neutron activation analysis (NAA) [15], inductively coupled plasma-mass spectroscopy/ optical emission spectroscopy (ICP-MS/ OES) [16, 17], X-ray fluorescence spectrometry (XRF) [18], X-ray diffraction (XRD) [13], Near-infrared (NIR) spectroscopy or Fourier transform infrared (FTIR) spectroscopy [19, 20], Raman spectroscopy [21] and so on. Among these, AAS, NAA and ICP-MS/OES are elemental analysis methods with the advantage of higher sensitivity. XRD, NIR spectroscopy and Raman spectroscopy characterize the molecular structure. However, they are all laboratory analysis
3
methods, namely, all of them need sample preparation more or less. For example, careful preparation of liquid sample is needed for AAS and ICP analysis. Furthermore, some of these techniques have their own drawbacks when used for plastic analysis. Raman spectroscopy has the weakness of insufficient sensitivity. XRF is only provided with the advantage of identifying polyvinyl chloride (PVC) due to chlorine. NIR spectroscopy has been established as a mature identification technique online, which can fingerprint different functional groups in plastics at a rate of several meters per second on the conveyor. However, it is arduous for NIR spectroscopy to analyse opaque samples. Accordingly, there is a pressing need for developing an online sorting method for plastic recycling with an economically feasible analysis throughput, essentially at a rate of several pieces per second [22].
Laser induced breakdown spectroscopy (LIBS) is an elemental analysis technique, which was valuated as a “future super star” [23]. With the advantages of high analytical speed, scarce (if any) sample preparation and the adaptability for severe factory environment [24, 25], LIBS has been widely used in many fields, involving metallurgy industry (including solid metal sorting, metallurgy processes monitoring, etc.), mining and mineral industry (including ore grading and sorting, mineral composition analysis, etc.), energy industry (including coal quality detection, oil sands analysis, monitoring of gasification of fossil fuels, etc.), pharmaceutical industry (mainly for quality control), food and feed industry (mainly for quality control and adulteration detection), nuclear industry (including nuclear material detection and environment monitoring), recycling factory (including the sorting of metallic scraps, e-waste, PCBs, etc.), environment conservation (involving soil, wastewater and microplastic detection), heritage conservation (mainly for detection of ancient paper or pigments), planetary exploration, ocean exploration, pathological diagnosis (mainly for elemental detection of human and animal soft tissues) and nanoparticle analysis [24, 26, 27]. Among these, many investigations on plastic using LIBS have been carried out in recent decades, involving toys, food containers, E-waste and many other types of plastic products. The typical methods for qualitative and quantitative analysis and the corresponding results have been reviewed in reference [28]. However, the basics of plastic, selection of equipment and comparisons of various chemometric tools were not mentioned. What’s more, most of previous investigations focused on plastic identification, a few on elemental composition,
4
and almost no one conducted both consequently. We remark that the identification of plastic types and the quantification of certain elements are both critical for high-order recycling of plastic. In this sense, LIBS should be employed to estimate the amount of interesting elements subsequent to the identification of plastic types allowing for the demands of real-life situations. In this review, a brief introduction of plastic materials, the selection of equipment and the comparison of analysis methods are presented, which aim to describe the state of art of LIBS applied to plastics, and to provide practical help for the peers to explore the directions of plastic investigations.
2.Materials and experimental configurations 2.1 Materials
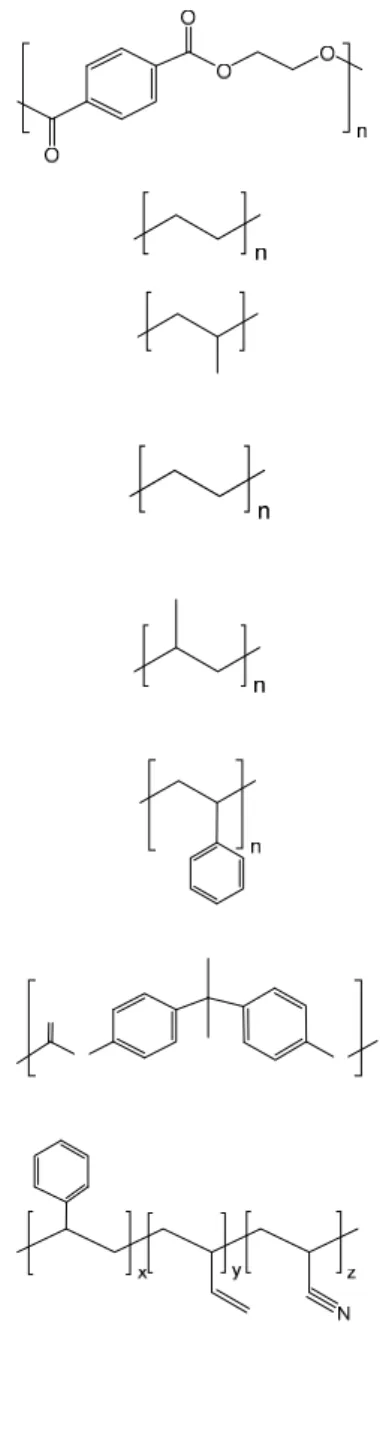
Plastic is composed of an organic-carbon-chain polymer (or resin) and varying additives which help modify the physical and chemical properties of the polymer. It should be noted that the terms “plastic” and “polymer” are often used synonymously in many papers. According to the processing and service properties, plastics can be classified into four categories, namely thermoplastic, thermoplastic elastomer, thermoset or elastomer. Wherein, the mostly used category is thermoplastic, which makes up about 90 wt. % of the world's plastic consumption. Furthermore, thermoplastics can be classified as commodity or engineering plastics. Among the commodity ones, polypropylene (PP), polystyrene (PS), low-density polyethylene (LDPE), high-density polyethylene (HDPE), and polyvinylchloride (PVC) are the most frequently used types, which approximately account for two-thirds of all thermoplastics consumed. Table 1 lists the information of 18 types of plastics used in previous investigations, including formulas, chemical structures, the ASTM International Resin Identification Codes (RIC), the molar ratios of C/H and common applications [29, 30]. The difference between each other is essentially depicted by the chemical structures. Besides these individual types, different types can be compounded as plastic blend or plastic mixture (plastic alloy) such as PC/ABS, PC/PET, PA/PP and so on. As for additives, there are many kinds of ingredients such as fillers, plasticizers, stabilizers, colorants, flame retardants etc. The amounts of these ingredients in plastic products vary from manufacturer to manufacturer. Specifically, fillers and colorants are the main source of heavy metal elements (Cd, Cr, Pb, Hg, Sb and so on). While Br is always derived from brominated flame retardants
5
(BFRs) [31]. In this regard, the spectral characterization of Bromine helps to estimate the amount of BFRs, most of which are PBBs and PBDEs restricted by RoHS. Finally, the collection of plastic wastes as experimental sample is relatively easy, while there are not many options for the obtaining of standard samples. A few can be taken over from other fields (such as the standards for XRF test), most are homemade by milling and pressing, using a protocol amply described wherein reference [4].
Table 1 Data on 18 plastics used in previous LIBS investigations
6 PU Polyurethane [CHNO2]n
7
and an intensified charge-coupled device (ICCD), and some integrated systems were also employed. To construct a feasible system, the corresponding parameters should be configured carefully, considering the features of plastic and the analysis target.
Table 2 Parameters of some LIBS systems used for plastic investigations
8 Nd:YAG 1064nm 5ns 240mJ
9
less dependent on the investigated material for UV laser excitation. Based on these findings, it is expected that NIR laser can produce a hotter plastic plasma due to a higher absorption efficiency varying with the additives. On the other hand, UV laser tends to break chemical bonds of the carbon chains [47]. In terms of the inevitable difference in the comparative trials above, it is difficult to judge the lasers by the different wavelengths. A reasonable assumption is that a UV laser is more suitable for the analysis of pure plastic and a NIR laser is more suitable for the analysis of additives.
To summarize, the nanosecond solid state laser, specifically lamp-pumped Nd: YAG laser is the mostly used type, using the three wavelengths: 1064nm, 532nm and 266nm. Some excimer (ArF, F2) lasers were also used to provide more options of wavelengths [37, 74]. And CO2 lasers could
be used to enhance the plasma emission in telemetry scenario [47]. To generate micro-craters, a picosecond laser was used to interrogate the polymer surface [76], and femtosecond lasers were needed to construct the kinetic modelling for the investigation of the expansion of plasma [77]. Other requirements for the selection of a laser include robustness, operability, maintainability, as well as lifetime and laser safety in the case of industrial applications. It should be mentioned that diode-pumped solid state (DPSS) lasers which could provide up to several hundred millijoules per pulse, have been developed with better stability and much longer lifetime compared with the traditional lamp-pumped type.
2.2.2 Optical system
A dedicated optical system determines the focus spot size and the collecting efficiency. In the laboratory, the mostly used optical system is composed of focusing and collecting lenses, with lens-to-sample distance less than 500 mm. To improve the numerical aperture and eliminate chromatic aberration, Huber et al. [74] employed a 90° off-axis parabolic mirror to collect the emitted light. Boueri et al. [43] employed two parabolic mirrors to fold the optical path. For standoff measurement, a Cassegrain telescope was often used to realize the detection at a remote distance, which could be up to 50 m [46, 78, 79]. Irrespective of which form of optical system is applied, the key point is to maintain the sample surface in the focal plane, and obtain enough irradiance simultaneously. Whereas, the surface topology and the height of plastic pieces always vary, either of which could result in the variation of the measuring distance. Regarding this, Noll
10
et al. tried to adjust the focusing distance to adapt the large variation of sample heights measured by a laser triangulation sensor. And to further reduce the height variation, a tilted conveyor which kept the samples sliding against the edge was proposed as shown in figure 1 [48]. While facing a much larger variation on a conveyor belt, it is arduous to compensate the variation dynamically. In this sense, part of tolerance for the variation depending on observation depth could be taken into consideration when designing an optical system. According to the laser properties, observation depth can be calculated through the Rayleigh distance [73].
Figure 1 (a) Schematic of the on-line LIBS analyzer: PC, personal computer; PR, Paschen–Runge polychromator; G, grating; PM’s, photomultipliers; PM-Z0, photomultiplier 0th order; MCI, multichannel integration electronics; F, optical fiber; P, plasma; S, sample; MR, measuring range; DM, dichroic mirror; M’s, mirrors; AF’s, autofocusing units; TS, triangulation sensor; C, controller; FO, focusing optics. (b) Schematic setup of the sensor head (right) at the conveyor belt (cross section shown at the left): R, roller of the conveyor system; S, sample; W, window; M’s, mirrors; WD, wedge to compensate for beam offset; LB, laser beam for LIBS; AF, autofocusing unit; TS, triangulation sensor [48].
2.2.3 Spectrogr a ph & detector
Table 3 A summary of emission lines and bands used in the literature (The former three categories are more significant for plastic investigations; as for other elements, it is organized alphabetically.)
11 777.42 777.54 795.29 884.6 53, 54, 66] N 500 742.49 744.2 744.35 746.831 746.92 821.63 824.23 859.40 862.92 747.0 818 868 [39, 40, 42, 44, 47, 49, 50, 53, 54, 57, 66] F 685.60 685.8 703.9 739.87 [42, 43, 54] Cl 134.7 247.85 585.75 585.804 585.695 585.913 725.66 754.7 837.59 837.8 [22, 42, 43, 54, 55, 57, 64, 70] Br 154 827.244 [48, 67, 70] Diatomic species CN 358.5 385.40 386.16 387.07 388.055 388.28 415.22 416.75 418.06 419.69 421.55 [39, 40, 42, 43, 49, 53, 54, 57, 66, 73, 80, 82, 83] C2 436.7 468.4 469.75 471.51 473.70 512.92 558.52 563.54 512.8 515.4 516.520 558.416 563.48
12
Table 3 lists some of the emission lines and bands used for elemental analysis of plastics by LIBS, the bold ones were frequently observed [28, 41, 86]. As it shows, the frequently used lines distribute in a large wavelength range from 200 to 900nm, including: (i) the heavy-metal elemental lines (concentrated in the range of 200-400nm); (ii) the C2 swan band at 516nm; (iii)
the H-alpha line at 656nm; (iv) and a Br line at 827nm. It should be mentioned that some molecular information corresponding to rotations and vibrations of some diatomic species (such as C2 and CN) [87, 88] were proven to be useful for the identification of plastic types [62, 67]. To
record all these lines, an echelle spectrograph equipped with an ICCD is always employed with the advantages of high resolution, wide wavelength range and time-resolution capacity. However, the response time is much longer that the requirement for industrial applications [43, 48]. On the contrary, Czerny-Turner (CT) spectrograph compacted with a CCD is much more robust and shows fast response, with a classification time of 0.096 ms achieved in laboratory [38]. Regarding a multi-module CT spectrograph compacted with CCDs, it can cover a wide wavelength range at the cost of time-resolution capacity. Given this, spectrograph and detector should be selected carefully allowing for the target analysis. The identification of polymer types can be realized with relatively low spectral resolution combined with proper chemometric tools [59], while precise quantification may require high resolution and sensitivity. A compromise can be found in the combination of a CT spectrograph with an ICCD, so that the response rate and sensitivity can be obtained simultaneously, at some cost in the effective spectral bandwidth [72, 77]. Nevertheless, the effective wavelength range can be extended by scanning or switching interchangeable gratings. Other types of spectrographs, like Paschen-Runge spectrograph, and other types of detectors, like photomultiplier tube (PMT), optical multichannel analyser (OMA) and intensified photodiode array (IPDA), have been used in the early reports [22, 25]. Allowing for the high sensitivity, PMT combined with filters and spatial heterodyne spectrometer [89] may improve the limit of detection (LOD) of certain individual elements, such as Br. Besides, the detection in vacuum ultraviolet (VUV) region with VUV spectrometers is an effective method to improve the analysis performance. Especially for non-metallic elements such as C, H, S, Cl, and Br, since the emission lines under 200 nm, as listed in table 3, are easier to be excited with less interference from other elements.
13
Overall, the prerequisite for LIBS measurement is a proper hardware system, which should be carefully configured in terms of the measurement requirements. As for the multivariable optimization of the measurement parameters, including pulse energy, delay time, integration time and so on, Design of Experiments (DoE) is proposed. For instance, a Doehlert design has been proposed to optimize all the variables comprehensively [69].
14
recognition methods, including principal components analysis (PCA), partial least squares discriminant analysis (PLS-DA), hierarchical cluster analysis (HCA), soft independent modelling of class analogy (SIMCA), K-nearest neighbour (KNN), K-means, iterative self-organizing data analysis technique (ISODATA), discriminant function analysis (DFA), support vector machines (SVM), artificial neural networks (ANNs), and random forest (RF). As listed in Table 4, HCA, ISODATA, K-means are unsupervised learning methods, which are mainly used for classification without prior knowledge of sample classes. While the others are supervised learning methods, which can be used to infer the types of unknown samples from a labelled training model.
Table 4 Applications of qualitative analysis of plastics using chemometric tools in the literature