HAL Id: hal-02863571
https://hal.archives-ouvertes.fr/hal-02863571
Submitted on 10 Jun 2020
HAL is a multi-disciplinary open access
archive for the deposit and dissemination of
sci-entific research documents, whether they are
pub-lished or not. The documents may come from
teaching and research institutions in France or
abroad, or from public or private research centers.
L’archive ouverte pluridisciplinaire HAL, est
destinée au dépôt et à la diffusion de documents
scientifiques de niveau recherche, publiés ou non,
émanant des établissements d’enseignement et de
recherche français ou étrangers, des laboratoires
publics ou privés.
biofluorescent aerosol emissions over winter and summer
periods in the United Kingdom
Elisabeth Forde, Martin Gallagher, Virginia E. Foot, Roland Sarda-Estève,
Ian Crawford, Paul Kaye, D. O. Topping
To cite this version:
Elisabeth Forde, Martin Gallagher, Virginia E. Foot, Roland Sarda-Estève, Ian Crawford, et al..
Characterisation and source identification of biofluorescent aerosol emissions over winter and summer
periods in the United Kingdom. Atmospheric Chemistry and Physics, European Geosciences Union,
2019, 19, pp.1665 - 1684. �10.5194/acp-19-1665-2019�. �hal-02863571�
Characterisation and source identification of biofluorescent aerosol
emissions over winter and summer periods in the United Kingdom
Elizabeth Forde1, Martin Gallagher1, Virginia Foot2, Roland Sarda-Esteve3, Ian Crawford1, Paul Kaye4, Warren Stanley4, and David Topping1
1Centre for Atmospheric Science, School of Earth and Environmental Science, University of Manchester, Manchester, UK 2Defence Science and Technology Laboratory, Porton Down, Salisbury, UK
3Laboratoire des Sciences du Climat et de l’Environnement, Gif-sur-Yvette, France
4Particle Instruments Research Group, University of Hertfordshire, Hatfield, Hertfordshire, UK
Correspondence: Elizabeth Forde (elizabeth.forde@manchester.ac.uk) Received: 23 May 2018 – Discussion started: 19 July 2018
Revised: 30 November 2018 – Accepted: 9 January 2019 – Published: 8 February 2019
Abstract. Primary biological aerosol particles (PBAPs) are an abundant subset of atmospheric aerosol particles which comprise viruses, bacteria, fungal spores, pollen, and frag-ments such as plant and animal debris. The abundance and diversity of these particles remain poorly constrained, caus-ing significant uncertainties for modellcaus-ing scenarios and for understanding the potential implications of these particles in different environments. PBAP concentrations were studied at four different sites in the United Kingdom (Weybourne, Davidstow, Capel Dewi, and Chilbolton) using an ultraviolet light-induced fluorescence (UV-LIF) instrument, the Wide-band Integrated Bioaerosol Spectrometer (WIBS), versions 3 and 4.
Using hierarchical agglomerative cluster (HAC) analysis, particles were statistically discriminated. Fluorescent parti-cles and clusters were then analysed by comparing to labo-ratory data of known particle types, assessing their diurnal variation and examining their relationship to the meteorolog-ical variables temperature, relative humidity, wind speed, and wind direction. Using local land cover types, sources of the suspected fluorescent particles and clusters were then identi-fied.
Most sites exhibited a wet discharged fungal spore domi-nance, with the exception of one site, Davidstow, which had higher concentrations of bacteria, suggested to result from the presence of a local dairy factory and farm. Differences were identified as to the sources of wet discharged fungal spores, with particles originating from arable and horticul-tural land at Chilbolton, and improved grassland areas at
Weybourne. Total fluorescent particles at Capel Dewi were inferred to comprise two sources, with bacteria originating from the broadleaf and coniferous woodland and wet dis-charged fungal spores from nearby improved grassland areas, similar to Weybourne.
The use of the HAC method and a higher fluorescence threshold (9 standard deviations instead of 3) produced clus-ters which were considered to be biological following the complete analysis. More published data and information on the reaction of different speciated biological particle types to fluctuations in meteorological conditions, such as relative humidity and temperature, would aid particle type character-isation in studies such as this.
1 Introduction
Primary biological aerosol particles (PBAPs), or simply bioaerosols, are a subset of atmospheric aerosol particles pro-duced from a range of sources within the biosphere. The con-stituents of PBAP vary in size and abundance, and include viruses (0.01–0.3 µm), bacteria and associated agglomerates (0.1–10 µm), fungal spores (1–30 µm), pollen (5–100 µm), and fragments such as plant and animal debris (Després et al., 2012). Biological particle dispersal has implications for agri-cultural, animal, and human health (Polymenakou et al., 2008; Fisher et al., 2012; D’Amato et al., 2002; Douwes et al., 2003), whilst also influencing the hydrological cycle and climate, by acting as ice nuclei and cloud condensation
nuclei (Pöschl et al., 2010; Schumacher et al., 2013; Huff-man et al., 2013; Hoose and Möhler, 2012; Pratt et al., 2009; Pope, 2010). However, the extent of these impacts is highly uncertain, in part, owing to difficulties in characterising the identity and abundance of different biological particulates in the atmosphere.
1.1 Influences on PBAP number
The abundance and presence of PBAP in different regions is impacted by local-scale meteorology, including, but not lim-ited to, temperature and relative humidity (RH; Jones and Harrison, 2004). Previous studies have identified relation-ships between temperature and RH in relation to two abun-dant fungal spores, Alternaria and Cladosporium. These two fungal spores strongly correspond with air temperature, but have negative correlations with RH (Oliveira et al., 2009; Corden and Millington, 2001; Fernández-Rodríguez et al., 2018; Grinn-Gofro´n and Mika, 2008); for example, Cla-dosporium has been found to be more abundant at temper-atures ranging from 20 to 24◦C depending on the species (Fernández-Rodríguez et al., 2018).
Alternaria and Cladosporium are examples of dry spore discharged fungi, in which spores are dislodged by air cur-rents or other forces, as opposed to liquid jets or droplets in the air (Elbert et al., 2007; Burch and Levetin, 2002), and are produced when temperatures are high and RH is low (Cran-dall and Gilbert, 2017; Elbert et al., 2007). In comparison, actively wet discharged fungal spores such as ascospores and basidiospores are found in the air during cooler nighttime and evening hours, and during wet or humid conditions such as in the early morning when there is an increase in RH (Burch and Levetin, 2002; Crandall and Gilbert, 2017; Elbert et al., 2007; Oliveira et al., 2009; Gabey et al., 2010).
The influence of temperature on both fungal spores and bacteria between differing soil types illustrated that the op-timum temperatures for bacterial growth are higher com-pared to fungal spores (Pietikäinen et al., 2005), with bac-terial production found to correlate with increases in temper-ature, and in a salt-marsh estuary when temperatures were >22◦C (Apple et al., 2006). As such, bacterial concentra-tions have been found to be highest in summer and autumn, and lower in spring and winter (Fang et al., 2007; Després et al., 2012), which has been suggested to result from frozen ground and a lack of foliage (Bowers et al., 2011).
The diurnal patterns of biological particles differ and for bacteria these particles have been found to increase at srise, decrease during solar noon hours, gradually increase un-til sunset, then decrease into the evening, with lowest concen-trations between 21:00 and 05:00 UTC (all times in this pa-per are UTC) (Shaffer and Lighthart, 1997). A diurnal cycle has also been noted for pollen particles, which have shown increases in concentration near sunrise, with a peak a few hours later, prior to a gradual decline in the afternoon, and minor concentrations during the night (Ogden et al., 1969).
Temperature has also been found to be the main driver for controlling pollen release, and for some species it is tem-perature, alongside precipitation, that controls the amount of pollen that is produced (Duhl et al., 2013). Similarly, direct rainfall events have been found to show a stronger relation-ship with bacterial concentrations, as identified in a study conducted in a Colorado forest (Crawford et al., 2014). Ad-ditionally, using an Aerodyne aerosol mass spectrometer in Switzerland, rainfall was correlated with bacteria-like parti-cles at one site; and compared to the total campaign average, these concentrations increased by ∼ 24 % (including 30 min after the precipitation event) as a result of particle resuspen-sion following impaction with the ground and other surfaces (Wolf et al., 2017).
Increases in PBAP concentrations are not only related to meteorological conditions; and instead the proximity of the site to different land cover types, alongside wind speed and wind direction data, is to be considered in order to identify distinctive emission patterns and factors. It has been found that in arable and agricultural areas, increases in bioaerosol concentrations may result from the maturing of crops and tree foliage (Grinn-Gofro´n and Mika, 2008) or combined with harvesting and grass mowing (Corden and Milling-ton, 2001). For example, in Denmark agricultural areas were found to be the main source of airborne Alternaria, orig-inating locally or regionally, with some intermittent long-distance transport (Skjøth et al., 2012). The nature of the sur-rounding area can be identified using land cover maps, and the use of these have been applied to analyse the distribution of pollen vegetation in the United Kingdom (McInnes et al., 2017), and combined with remote sensing to create a pollen inventory in Aarhus, Denmark (Skjøth et al., 2013). Previ-ous studies have identified the relationship between different sites and bacterial particle concentrations, with lower centrations found at coastal and rural sites and higher con-centrations at forest and urban sites (Shaffer and Lighthart, 1997; Harrison et al., 2005). However, the influence of wind speed and wind direction on airborne biological particle con-centrations is unclear; and at two sites in Switzerland no lin-ear correlation coefficient was found between bacteria and wind speed or wind direction (Wolf et al., 2017). Whilst in comparison, in a study focussing on the influence of differ-ent meteorological factors, wind speed was found to have the most pronounced influence on bacterial concentrations (Mouli et al., 2005).
1.2 Ultraviolet light-induced fluorescence (UV-LIF) discrimination
Biological particles fluoresce when illuminated with ul-traviolet light, owing to the intrinsic presence of bio-fluorophores, such as nicotinamide adenine dinucleotide phosphate (NAD(P)H), tryptophan, and riboflavin, which auto-fluoresce when excited by UV radiation. UV-LIF in-struments work on this principle, with the detection
chan-and emits between 400 chan-and 600 nm (Kaye et al., 2005), chan-and riboflavin is mainly excited at ∼ 450 nm and emits at around 520–565 nm (Hill et al., 2009; Lakowicz, 2006).
UV-LIF instrumentation allows for real-time measure-ments, providing instantaneous data without the need for constant maintenance. This allows for continuous monitoring for extended periods of time as opposed to traditional sam-pling techniques which, although allow for accurate identifi-cation of particle type and species, are often laborious with poor time resolution and may suffer from potential identifi-cation biases when manually counting particles (Spracklen and Heald, 2014; Robinson et al., 2013).
There is a potential interference risk from non-biological fluorescent particles which can possess similar fluorescence properties to PBAP, and can fluoresce at wavelengths used by UV-LIF instruments. Chemical pollutants from vehi-cles, such as diesel particulates and other secondary or-ganic aerosols (SOA), are known to fluoresce upon excita-tion wavelengths, especially in submicron ranges (O’Connor et al., 2014; Perring et al., 2014). This has been experi-enced in polluted environments, with combustion-type par-ticles found to dominate the 1–2 µm particle size range (Yu et al., 2016). The most common interferents include poly-cyclic aromatic hydrocarbons (PAHs) and SOAs, with those less likely to cause interference comprising humic like sub-stances (HULIS), mineral dust, and soot due to weak signal intensities (Pöhlker et al., 2012). However, due to the weak intensities of these interferents overall, most ambient fluores-cent particles are likely to be dominated by biological parti-cles (Pöhlker et al., 2012).
During atmospheric transport, airborne particles are sub-ject to aging, chemical and physical transformations, and fragmentation affecting the fluorescent characteristics of the particle (Fröhlich-Nowoisky et al., 2016; Pöschl and Shi-raiwa, 2015). Biological particles have also been found to accompany the transport of dust within the atmosphere, and previous studies have found that dust events have resulted in a 10-fold increase in airborne microorganisms, such as fungal spores and pathogens (McCarthy, 2001; Polymenakou et al., 2008). Collectively, these processes can make comparisons between ambient and laboratory sampling of the same parti-cle difficult.
1.3 Hierarchical agglomerative cluster (HAC) analysis The use of HAC analysis to distinguish and statistically seg-regate different types of biological particles is required as UV-LIF instruments do not provide information on particle genus or species (described further in Sect. 2.3). The use of this method has been applied for analysis of data from a
been shown to effectively segregate between polystyrene la-tex spheres (PSLs) of different sizes and doping (Crawford et al., 2015).
1.4 Scope
Recent work, and ongoing areas of research, has included emission modelling for pollen particles as based on observed pollen counts within the United States (Wozniak and Steiner, 2017), and others assessing the impacts of bioaerosols on human health, focussing specifically on the ability of these particles to produce damaging oxidative reactions in human lungs (Samake et al., 2017).
This study reports the analysis of measurements taken at four different sites within the United Kingdom, during differ-ent times of the year, using a UV-LIF instrumdiffer-ent, the Wide-band Integrated Bioaerosol Spectrometer (WIBS). Using a HAC approach, different clusters are statistically discrimi-nated. The resulting fluorescent and cluster concentrations between sites are analysed in relation to meteorological con-ditions, focusing specifically on temperature and RH, and in relation to wind speed and direction. HAC solutions and re-sponses to meteorological drivers from each site are com-pared with local land cover types to identify distinctive emis-sion patterns and factors. This is the first comparison study of measurements taken from four different sites in the United Kingdom using a UV-LIF instrument, and attempts to clas-sify particles from these sites using the HAC method, meteo-rological data, and land cover mapping collectively and infer emission types in association with different land cover types. Contrary to previous work, this is additionally the first use of a differing fluorescent threshold of 9 standard deviations (9 SD) compared to traditionally 3 SD, in an ambient setting, to reduce the impact of interferents from potential anthro-pogenic sources, following Savage et al. (2017).
2 Methods
2.1 Site descriptions
Bioaerosol measurements were conducted at four differ-ent sites within the United Kingdom during differdiffer-ent years and different times of the year (Table 1). These sites were Chilbolton in Hampshire, Davidstow in North Cornwall, Weybourne on the coast of north Norfolk, and Capel Dewi near Aberystwyth, Wales (Fig. 1). At each site, the instru-ments were connected to a PM10inlet, with the height of this
connection varying between sites.
To identify the land cover characteristics of each site, the Centre for Ecology and Hydrology Land Cover Map 2015
(LCM2015) was used to provide background information at each site (Rowland et al., 2017). The use of a previous ver-sion of the LCM2015 was used by McInnes et al. (2017) to produce location maps of trees, weeds, and grasses that are associated with allergies and asthma. In addition, Skjøth et al. (2012) utilised the Corine Land Cover 2000 dataset to iden-tify agricultural areas under rotation and in harvest in relation to Alternaria spore concentrations in Denmark.
Here, using the LCM2015 at each site, a land cover class which is common is “improved grassland”, which is distin-guished from semi-natural grasslands owing to its higher pro-ductivity and lack of winter senescence, whilst those defined as “arable and horticulture” comprise annual crops, perennial crops (e.g. orchards), and freshly ploughed land. Though the LCM2015 provides up-to-date data on the land cover char-acteristics of each site, it is acknowledged that there is a risk that smaller features are not identified and thereby not con-sidered potential sources. To provide geographical context to each site, the LCM2015 has been overlaid on an Ordnance Survey (OS) base map. Additionally, the presence of local farming activity and other potential influencing sources are presented in Fig. 1.
Chilbolton is situated within Hampshire on the south-ern coast of England, and data collection was conducted at Chilbolton Observatory situated at the edge of Chilbolton vil-lage. Measurements were conducted from the 20 January to 20 March 2009, with the instrument connected to the PM10
inlet at a height of 8 m. The area surrounding Chilbolton Observatory comprises mainly arable and horticultural land, with some broadleaf woodland and improved grassland areas situated around the site. To the south-east of the Observatory there is an industrial composting facility and mushroom farm (Fig. 1).
Data collection from Davidstow, in North Cornwall, was conducted from the 25 June to 28 August 2013, in which the instrument was connected to a 10 m high sampling line. The land cover around the ground site predominantly comprises improved grassland coverage, with some urban and suburban land cover, arable and horticultural land, and heather cov-ered areas. The Davidstow Airfield runway is located to the south-east from the ground site and in a north-westerly direc-tion there is a dairy factory, the largest producers of cheddar cheese in Britain. The sampling site is in close proximity to a number of farming sites, including a dairy farm located clos-est to the site from the wclos-est. In addition, a small garden centre is located close to the dairy farm to the west (represented by the suburban land cover), and immediately south of the site there is a slaughter house.
Capel Dewi is situated near Aberystwyth in west Wales, and from the 18 February to 3 June 2013 data were collected from the Natural Environment Research Council (NERC) Mesosphere–Stratosphere–Troposphere (MST) radar site, at an inlet height of 3 m. The location of the site is within, and mostly surrounded by, an improved grassland area, with some broadleaf woodland to the north of the site and
conifer-ous woodland predominantly to the south, and some arable and horticultural land close by, in addition to a livestock breeding farm located in a north-westerly direction from the site.
Unlike the other sites, Weybourne is a coastal site, located north of Norfolk, at the Weybourne Atmospheric Observa-tory. Data collection was conducted for a 1-week period from the 17 to 25 August 2009. The instrument was connected to a high-volume sampling line, with an inlet at a height of 10 m. The site is located in an improved grassland area, with gorse heath observed immediately inland from the Observatory. To the south-east of the Observatory there is arable and horti-cultural land, to the north of the site there is some littoral sediment, and to the south there is some broadleaf woodland. 2.2 UV-LIF instrumentation
Measurements were recorded at each site using a model 3 WIBS (WIBS-3; Foot et al., 2008; Kaye et al., 2005) de-ployed at Chilbolton Observatory and Weybourne Atmo-spheric Observatory, and a model 4 (WIBS-4) deployed at Davidstow and the Capel Dewi MST Site. The differences between the WIBS-4 and the WIBS-3 have been previ-ously described and feature a different optical chamber de-sign and differing arrangement of the detector wavelength bands (Kaye et al., 2005; Gabey et al., 2010; Crawford et al., 2014; Robinson et al., 2013). A brief summary of the instru-ments are introduced here, more detailed descriptions have been discussed previously (Gabey et al., 2010; Perring et al., 2014).
The WIBS is able to detect particles ranging from 0.5 to 20 µm, encompassing most airborne bacteria and fungal spores, but only very small pollen, or fragments of such. Aerosol particles are drawn from the atmosphere in a lami-nar flow, and for both the WIBS-3 and WIBS-4 the scattering intensity of a singular particle is measured by a diode laser beam at 635 nm in a forward and sideways direction. This is converted to optical equivalent diameter, Do, using a Mie
scattering lookup table which is based on the response of the instrument to calibrated PSL spheres. The scattered intensity is measured by a quadrant detector, with the signal from each quadrant used to calculate an average optical diameter over the four scattering angles. Using the four signal intensities, the asymmetry factor (Af) can be determined by calculating
the standard deviation between each signal to identify parti-cle morphology. Afranges indicate the shape of the particle,
as based on measurements using calibration particles. Theo-retically, an Afvalue of 0 indicates a spherical particle, whilst
an asymmetrical rod or fibre-like particle yields an Afvalue
closer to 100.
Once a particle has been sized, two xenon flash lamps are triggered at excitation wavelengths 280 and 370 nm to excite tryptophan and NADH fluorescence, respectively. Two pho-tomultiplier tubes (PMTs) then record the fluorescence emit-ted from the particle. Emitemit-ted fluorescence is measured using
Figure 1. Land cover maps at each site produced using the Centre for Ecology and Hydrology Land Cover Map 2015, OS data (© Crown Copyright and database right 2018), and the World Imagery ArcMap Layer in ArcGIS version 10.4.1.
three detector channels which record the fluorescence over two wavelength ranges: FL1 (fluorescence between 300 and 400 nm, once excited at 280 nm), FL2 (fluorescence between 410 and 650 nm, once excited at 280 nm), and FL3 (fluores-cence between 410 and 650 nm, once excited at 370 nm). 2.3 Data sources and analysis
The HAC method was used to distinguish and statistically segregate different biological particle types, using the ap-proach of Crawford et al. (2015). Previous studies have re-ported the success of the method for data analysis in a range of environments (Gabey et al., 2013; Crawford et al., 2014, 2015, 2017; Gosselin et al., 2016), and its use has been com-pared to other analysis methods, including various super-vised learning techniques (Ruske et al., 2016).
Data pprocessing, prior to clustering the data, is re-quired to remove particles which saturate the PMT, as their true fluorescence cannot be measured. This is also required to remove particles smaller than 0.8 µm, as the particle collec-tion efficiency of the WIBS drops below 50 % at ∼ 0.8 µm. In this study, particles are considered fluorescent using a base-line fluorescence (forced trigger measurement) plus 9 SD, contrary to prior studies where 3 SD is commonly used (Crawford et al., 2015; Gosselin et al., 2016; Hernandez
et al., 2016). The use of 9 SD was shown in Savage et al. (2017) and used successfully in a comprehensive laboratory study characterising different aerosol materials using a UV-LIF spectrometer. To assess the use of this method for an am-bient dataset, a comparison between 3 SD and 9 SD baseline fluorescence is shown for one site to assess the robustness of the HAC approach (Sect. 3.6).
Each site was analysed as a whole dataset including fluo-rescent and non-fluofluo-rescent particles, with the exception of Capel Dewi. Here, due to the size of the dataset, fluorescent particles only were selected due to computer memory limi-tations. The size of each dataset differed, owing to different field campaign durations (Table 1).
The data were normalised using the z-score method (in which the mean is subtracted and the data are divided by the SD) and the Ward linkage (in which clusters are merged by finding the clusters which yield the minimum increase in total within-cluster variance once merged Crawford et al., 2015). The HAC method initially assumes each datapoint to be its own individual cluster, and the clusters separated by the shortest distance are combined until all datapoints constitute one cluster. The number of clusters to represent the data can be evaluated using the Calinski–Harabasz criterion, which assesses whether dissimilar clusters have been incorrectly combined to form a cluster, and provides the optimum
clus-Table 1. The site name, geographic location (latitude, longitude), sampling period of each campaign, examples of land cover at each site, size of the data, number of particles clustered at each site, and the instrument used for the campaign presented.
Site Location Sampling period Land cover Data size No. clustered Instrument Chilbolton (51.145, −1.439) 20/01/09–20/03/09 Arable, grassland, woodland 1.3 GB 406 481 WIBS-3 Davidstow (50.647, −4.633) 25/06/13–28/08/13 Grassland, urban, heather 5.97 GB 1 737 369 WIBS-4 Capel Dewi (52.424, −4.006) 18/02/13–03/06/13 Grassland, woodland 10.1 GB 3 330 532 WIBS-4 Weybourne (52.950, 1.122) 17/08/09–25/08/09 Grassland, arable, littoral sediment 198 MB 105 845 WIBS-3
ter solution to prevent clusters which have small between-cluster variance and large within-between-cluster variance (Calinski and Harabasz, 1974).
Meteorological data were recorded during each campaign, apart from Capel Dewi in which data were obtained from the NERC MST Radar Site. Land cover data, as obtained from the Centre for Ecology and Hydrology LCM2015, were analysed for each site using ArcGIS (version 10.4.1). Addi-tionally, using the R package “openair”, polar plots of wind direction and wind speed were produced for each site to be used in relation to the LCM2015 (Carslaw and Beevers, 2013).
3 Results
The average diurnal variation in total fluorescent and non-fluorescent particles were plotted for each site (Sect. 3.1), and following the HAC method (Sect. 3.2), the diurnal variation in each cluster was plotted (Sect. 3.3). The data were then considered in terms of meteorological influences (Sect. 3.4), focusing on temperature and RH (Sect. 3.4.1) and wind speed and wind direction (Sect. 3.4.2).
3.1 Total fluorescent particle diurnal variation
The average diurnal variation in fluorescent and non-fluorescent particle concentrations differs between the four sites, potentially indicating the differing types of biological particles present (Fig. 2). Weybourne exhibits increased fluo-rescent concentrations prior to ∼ 08:00, which increase after ∼19:00. At Chilbolton, the fluorescent particle concentra-tion remains relatively stable until ∼ 11:00 after which there is a decrease in concentration until ∼ 16:00–17:00 when con-centrations slowly increase. Fluorescent concon-centrations are highest at Davidstow, compared to the other sites, though the trend in fluorescent concentrations throughout the day is less clear, displaying a relatively static trend with the exception of ∼13:00–20:00 during which there is a marginal drop in flu-orescent particle concentration. The fluflu-orescent particle con-centrations at Capel Dewi are similar to those at Chilbolton, albeit with a slightly less clear diurnal variation. It does ap-pear that there is some small variation during the day, the most apparent trend is the increase in fluorescent particle concentration starting at ∼ 18:00 until 24:00.
3.2 Cluster analysis
The standard threshold for defining fluorescent and non-fluorescent particles is calculated by using the instrument forced trigger (FT) measurement ±3 SD (Crawford et al., 2015; Gosselin et al., 2016; Hernandez et al., 2016), or 2.5 SD (Gabey et al., 2010). Here, the data were analysed us-ing 9 SD, which has been found to reduce interference from any other non-biological aerosols and mineral dusts, without compromising the relative fraction of biological particles that are considered fluorescent, as found in a recent comprehen-sive laboratory study characterising different aerosol materi-als using a WIBS-4A (Savage et al., 2017). The results of the HAC method produced a four-cluster solution for both Wey-bourne and Chilbolton, and a five-cluster solution for Capel Dewi and Davidstow using the Ward linkage and z-score nor-malisation (Table 2). Using (1) the fluorescent channel inten-sities, (2) the cluster size and shape, and (3) the percentage contribution to the overall fluorescent particles at each site, initial assumptions were made of the particle type. These as-sumptions were aided by laboratory experiments conducted using a WIBS-3D (Crawford et al., 2017), and are herein re-ferred to as “Dstl Experiment 2014”. Further support is pro-vided by a comprehensive laboratory experiment conducted at Dstl in 2017 using a WIBS-4, and is herein referred to as “Dstl Experiment 2017” (details of which are to be published in 2019).
3.2.1 Weybourne
The dominant cluster at Weybourne is Cluster 3, represent-ing 50.6 % of total fluorescent particle concentration, and ex-hibiting the greatest fluorescence signal in channel FL3, sim-ilar to Cluster 1. Cluster 1 displays a simsim-ilar fluorescence profile and similar high abundance (33.7 % of total fluores-cent particle confluores-centration), but with a much larger size and shape (5 µm, Af36.6) compared to Cluster 3, which exhibits
the smallest size and shape compared to other clusters (2 µm, Af17.2). Though both clusters show similar fluorescence
sig-nals, it is likely that, due to the differences in size and shape values, these clusters have been segregated. Laboratory data collected using a WIBS-3 have shown that bacteria such as unwashed E. coli and Bacillus atrophaeus spores exhibit higher fluorescence in channel FL3 (Dstl Experiment 2014). The presence of a highly fluorescent FL3 channel was found
Figure 2. Total fluorescent and non-fluorescent diurnal particle concentration variation at each site (number of particles, Np, in units of L−1)
(a – Davidstow; b – Capel Dewi; c – Chilbolton; d – Weybourne).
for Cluster 2 in Crawford et al. (2017), which was speculated to represent a bacterial particle, or dust containing bacteria, as a result of the larger size and shape of the particles in this cluster. This is contrary to other studies which have found a strong FL1 signature for bacteria (Hernandez et al., 2016; Savage et al., 2017). Given the abundance of these two clus-ters, it seems unlikely that these clusters are bacteria, as rates of bacteria have been found to be diverse but low at coastal sites (Shaffer and Lighthart, 1997). As these two clusters rep-resent the two largest clusters at this site; it is possible that these may be fungal spores, as fungal spores have been found to be the most prevalent airborne biological particles com-pared to other bioaerosol classes (Elbert et al., 2007; Fisher et al., 2012; Fröhlich-Nowoisky et al., 2009)
Cluster 2 is the least abundant cluster and represents only 6.9 % of the total fluorescent particle concentration. Fluores-cence signal is greatest in channel FL1, with some signal in channel FL3, and very low signal in channel FL2. The size and shape of this cluster indicate a fairly small
aspheri-cal particle (3.1 µm, Af32.3). Higher FL1 concentrations and
lower median FL2 and FL3 values have been associated with bacteria and fungal spores (Savage et al., 2017); however, in a laboratory study using the WIBS-4, compared to bacte-rial samples, the fungal spores Alternaria and Cladosporium were found to have a higher FL1 channel in comparison to channels FL2 and FL3 (Dstl Experiment 2017). It is possible that this is a fungal spore; however, owing to the small aver-age particle size, and low abundance, it is also possible that this is a bacterial particle or aggregate containing bacterial cells. Previously, bacterial size ranges have been found to be 4 µm, with fairly high asymmetry factors, similar to Cluster 2 (Gabey et al., 2011, 2013).
Cluster 4 also accounts for a small proportion of cent particles (8.9 % of the total) but displays high fluores-cence in channel FL3, with some fluoresfluores-cence in FL2, and less in FL1. Particle size is relatively large, and similar to the other clusters, the shape value indicates an aspherical parti-cle (4.4 µm, Af24.5). The high fluorescence signal in
chan-Table 2. HAC Ward linkage analysis at each site displaying the average fluorescent intensities per channel (FL1, FL2, and FL3); the average optical diameter, D (µm); the average asymmetry factor (Af), and the percentage contribution to the total fluorescent particle count, and
inferred cluster type following the HAC analysis.
Site Cluster FL1 FL2 FL3 D Af % of total Cluster type
Chilbolton 1 56.0 ± 140.7 17.0 ± 50.6 213.0 ± 225.5 3.6 ± 1.8 29.1 ± 12.1 23.2 Fungal 2 11.8 ± 54.7 18.0 ± 51.0 198.0 ± 207.6 1.8 ± 0.7 14.4 ± 5.7 58.6 Fungal 3 1005.0 ± 315.0 42.3 ± 93.1 150.7 ± 203.8 3.1 ± 1.3 24.9 ± 15.1 5.6 Bacteria/Fungal 4 58.5 ± 203.2 474.1 ± 264.7 1003.1 ± 360.1 2.4 ± 1.6 17.9 ± 9.2 12.6 Pollen Fragment Weybourne 1 3.8 ± 25.2 12.5 ± 35.6 303.6 ± 295.0 5.0 ± 2.2 36.6 ± 15.9 33.7 Fungal 2 685.5 ± 408.3 10.8 ± 37.9 120.4 ± 221.4 3.1 ± 1.6 32.3 ± 16.8 6.9 Bacteria/Fungal 3 5.1 ± 27.3 3.2 ± 15.8 192.6 ± 200.8 2.0 ± 1.1 17.2 ± 8.7 50.6 Fungal 4 47.1 ± 190.4 292.9 ± 180.3 1114.8 ± 345.4 4.4 ± 3.2 24.5 ± 14.8 8.9 Pollen Fragment Davidstow 1 949.6 ± 711.9 1579.2 ± 494.8 1671.2 ± 352.5 16.5 ± 7.3 27.9 ± 16.6 0.1 Pollen Fragment
2 186.9 ± 354.7 345.7 ± 278.9 271.8 ± 212.5 6.5 ± 5.1 18.7 ± 16.0 4.3 Interferent 3 87.6 ± 165.7 32.5 ± 41.0 17.5 ± 32.5 5.1 ± 3.1 25.8 ± 15.0 26.2 Fungal 4 1534.2 ± 528.3 55.3 ± 77.3 14.5 ± 38.6 4.0 ± 2.0 23.0 ± 14.6 24.5 Fungal/Bacteria 5 42.2 ± 115.6 22.7 ± 34.1 8.0 ± 21.3 1.6 ± 0.6 6.5 ± 2.7 44.9 Fungal Capel Dewi 1 455.4 ± 422.9 1197.0 ± 435.6 834.8 ± 308.9 5.3 ± 4.9 15.8 ± 13.6 0.8 Interferent
2 123.2 ± 198.8 385.9 ± 245.1 171.6 ± 126.2 1.8 ± 0.8 7.0 ± 3.8 8.7 Interferent 3 1070.3 ± 471.5 30.8 ± 71.6 10.8 ± 38.3 3.4 ± 2.1 21.7 ± 16.9 10.3 Fungal/Bacteria 4 78.7 ± 143.9 48.5 ± 94.5 36.6 ± 93.8 6.1 ± 3.3 28.0 ± 13.7 18.7 Fungal 5 71.6 ± 124.2 34.0 ± 53.1 7.3 ± 21.1 1.6 ± 0.8 7.7 ± 4.3 61.5 Fungal
nel FL3 is similar to Cluster 1 and Cluster 3, yet for Cluster 4 there is moderate signal in FL2 and some signal in FL1. It is possible that this is a pollen fragment, given the time of year and pollen season, and as larger FL3 values have been asso-ciated with laboratory-sampled ryegrass, aspen, and poplar pollen (Dstl Experiment 2014). However, there will often be a similar high FL2 value (O’Connor et al., 2014; Crawford et al., 2017), which does not occur here for Cluster 4. Using the fluorescent profiles for each cluster at Weybourne, it is initially suggested that these comprise fungal spores (Clus-ter 1 and Clus(Clus-ter 3), bac(Clus-teria (Clus(Clus-ter 2), and potential pollen fragments (Cluster 4).
3.2.2 Chilbolton
Cluster analysis of the Chilbolton dataset similarly pro-duced a four-cluster solution, of which Cluster 2 accounts for 58.6 % of the fluorescent particle concentration. Cluster 2 displays low fluorescence in channels FL1 and FL2, with higher fluorescence in channel FL3. Not only is this fluores-cence profile and cluster dominance similar to Weybourne Cluster 3, but Chilbolton Cluster 2 also exhibits the smallest size and shape (1.8 µm, Af14.4).
Chilbolton Cluster 1 displays a similar fluorescence profile to Chilbolton Cluster 2. However, Chilbolton Cluster 1 is less abundant (23.2 %), and exhibits the largest size and shape (3.6 µm, Af29.1). Similar to Weybourne, it is likely that these
clusters are a subset of the same particle type, segregated due to differences in size and asymmetry factor. Incidentally, the fluorescent profile of these clusters are remarkably similar to Weybourne Cluster 1 and Cluster 3, and though Chilbolton
Cluster 1 shows some fluorescence in channel FL1, it is pos-sible that these clusters are fungal spores.
Chilbolton Cluster 3 is the smallest cluster (representing 5.6 % of the total fluorescent population) but exhibits the greatest fluorescence in channel FL1 compared to the other clusters, and exhibits a similar fluorescent profile to Wey-bourne Cluster 2. Both WeyWey-bourne Cluster 2 and Chilbolton Cluster 3 make up the smallest cluster group of each dataset, with the same size (3.1 µm) but slightly differing Afvalues
of 24.9 and 32.3 for Chilbolton and Weybourne, respectively. It is likely that these two clusters are the same type of par-ticle, and are representative of bacterial or fungal spores, as discussed for Weybourne Cluster 2.
Cluster 4 from the Chilbolton dataset displays similar flu-orescent profile characteristics to Weybourne Cluster 4, in which there is a high fluorescence signal in channel FL3, with some in FL2 and less so in FL1. Chilbolton Cluster 4 represents 12.6 % of the total fluorescent particle popula-tion, and has a size of 2.4 µm and shape parameters Af17.9.
Though Weybourne particles differ in terms of size and shape (4.4 µm, Af24.5), the fluorescence profile of these clusters is
inferred to be representative of pollen fragments.
The fluorescent profiles at Chilbolton show much similar-ity to Weybourne, even though Weybourne is a coastal site. This suggests that the sources of these clusters originate from the same land cover type, which for both sites is either the im-proved grassland or arable and horticultural land. Using the fluorescent profiles for each cluster, the clusters at Chilbolton are initially assumed to comprise fungal spores (Cluster 1
Cluster analysis of the MST Capel Dewi dataset produced a five-cluster solution, of which Cluster 5 accounts for 61.5 % of the total fluorescent cluster population. Cluster 5 exhibits relatively low fluorescent channel signals in comparison to other clusters, with the exception of Cluster 4 which presents a similar fluorescent profile and represents 18.7 % of the to-tal fluorescent particle population, the second largest cluster. Incidentally, Cluster 5 represents the smallest size (1.6 µm) in comparison to Cluster 4 which represents the largest aver-age size (6.1 µm). Similarly, there is also some difference be-tween the asymmetry factor bebe-tween these two clusters with a more spherical particle for Cluster 5 (Af7.7) and a
non-spherical particle for Cluster 4 (Af28). It seems likely that
Cluster 4 is a subset of Cluster 5, segregated due to differ-ences in particle size and asymmetry factor. It can be spec-ulated that this is a fungal spore, given the low fluorescence signal intensity and moderate difference between each fluo-rescent signal, as well as the high intensity in channel FL1 and overall cluster abundance (Savage et al., 2017; Hernan-dez et al., 2016). Additionally, recent laboratory experiments have shown low fluorescent signals, but higher fluorescence in channel FL1 for Cladosporium and Alternaria samples (Dstl Experiment 2017).
Cluster 3 exhibits a large fluorescence signal in channel FL1, with only some in FL2, and less in channel FL3. The larger fluorescence in channel FL1 is similar to Chilbolton Cluster 3 and Weybourne Cluster 2. Though these two sites have similar signals in channels FL2 and FL3, Capel Dewi Cluster 3 signals decrease in channel FL2 and even more so in channel FL3. However, comparing the size range of the particles between these sites, they are remarkably similar, with a size range of 3.1 µm (Chilbolton and Weybourne) to 3.4 µm (Capel Dewi). The asymmetry factors between these sites are additionally in agreement and indicate an asymmet-rical particle (Capel Dewi – Af21.7; Chilbolton – Af24.9;
Weybourne – Af32.2). This cluster type is least prominent
at Chilbolton and Weybourne; however, at Capel Dewi this represents 10.3 % of the total fluorescent population. Owing to the large fluorescent signal in channel FL1, it is speculated that this cluster is a fungal spore or bacterial particle.
Cluster 2 represents 8.7 % of the total fluorescent popula-tion, and displays a high fluorescence signal in channel FL2, with some signal in channel FL1 and FL2. This cluster shows some similarities to Cluster 1, the smallest cluster (0.8 % of the total fluorescent cluster population). Though Cluster 1 displays a higher fluorescent signal than Cluster 2, a similar fluorescence signal profile is noticeable. The sizes of these two clusters differ, with Cluster 2 reasonably small (1.8 µm) and spherical (Af7), and Cluster 1 larger (5.3 µm) and
as-pherical (Af15.8). A larger fluorescence signal in channel
fungal spores (Cluster 4 and Cluster 5), and it is inferred that clusters 1 and 2 are interferents given the larger signal in channel FL2. Cluster 3 is assumed to be a fungal spore or bacterial particle, which shows some slight similarity to Chilbolton Cluster 3 and Weybourne Cluster 2 in terms of the high FL1 channel.
3.2.4 Davidstow
Similar to the Capel Dewi dataset, cluster analysis of the Davidstow data produced a five-cluster solution. Of which, Cluster 5 represents 44.9 % of the total fluorescent particle population, but displays a very low fluorescent signal and small size and shape (1.6 µm, Af6.5), indicating a small,
spherical particle. The fluorescent signal of Cluster 5 is sim-ilar to Cluster 3 which represents the second largest cluster (26.2 % of the total fluorescent population), though with a larger size and shape (5.1 µm, Af25.8) than Cluster 5. These
clusters are similar to two of the most prominent clusters at Capel Dewi, clusters 4 and 5, with similar sizes and asym-metry factors between both sites for Cluster 5 (Capel Dewi – 1.6 µm, Af7.7; Davidstow – 1.6 µm, Af6.5), and nearly
sim-ilar for Capel Dewi Cluster 4 (6.1 µm, Af28) and Davidstow
Cluster 3 (5.1 µm, Af25.8). The very low fluorescent signals,
with slightly higher signal in channel FL1, indicate that like Capel Dewi clusters 4 and 5, these two clusters are fungal spores.
Again, similarities between Davidstow Cluster 4 and Capel Dewi Cluster 3 can be seen, though additionally with some similarities to Weybourne Cluster 2 and Chilbolton Cluster 3 in terms of the high fluorescence signal in chan-nel FL1. Davidstow Cluster 4 and Capel Dewi Cluster 3 dis-play a very similar fluorescence signal profile, albeit at dif-ferent fluorescent intensities. Davidstow Cluster 4 represents 24.5 % of the total fluorescent particle population, with an average size and shape (4 µm and Af23) which is similar to
Capel Dewi Cluster 3 (3.4 µm and Af21.7); it is therefore
suspected that this is also a fungal spore or bacterial particle. Davidstow Cluster 2 displays a similar fluorescent profile to Capel Dewi Cluster 2, and represents a small proportion of the fluorescent particle population (4.3 %) similar to Capel Dewi Cluster 2 (8.7 %). However, there are differences in size and shape, as Davidstow Cluster 2 has a larger aver-age particle size and asymmetry factor compared to Capel Dewi Cluster 2. It can be seen that Davidstow Cluster 2 also displays some similarity to Capel Dewi Cluster 1, though at lower fluorescence signal intensities, but similar in terms of average particle size and asymmetry factor (Capel Dewi Cluster 1, 5.3 µm and Af15.8). Considering this fluorescence
FL2, as discussed previously for Capel Dewi clusters 1 and 2, indicates that this cluster comprises interferent particles.
Davidstow Cluster 1 is a remarkable cluster, owing to its large size (16.5 µm) and low abundance (0.1 %). This clus-ter exhibits a consistent shape in relation to other sample sites (Af27.9), but has high fluorescent signals in each
chan-nel with the highest in chanchan-nel FL3. This cluster is similar to Chilbolton Cluster 4 and Weybourne Cluster 4, in terms of the large signal in FL3, with some in FL2, and less in channel FL1. However, the fluorescence intensity and size make this cluster unique. Considering the fluorescent signal and low abundance of this cluster, this may well be a pollen fragment, especially considering the larger average size of this cluster. The clusters at Davidstow show a similarity to the Capel Dewi dataset. The inferred cluster types present include fungal spores (Cluster 3 and Cluster 5), pollen frag-ments (Cluster 1), interferents (Cluster 2), and either a fungal spore or bacterial particle (Cluster 4).
3.2.5 Grouping of clusters
Though the HAC method proved successful in segregating the fluorescent particle data into distinctive clusters, this method alone does not allow for easy particle identification, as demonstrated during the first attempt to assign particle type to each cluster. For ease of analysis, a summary table of the similar clusters is presented (Table 3), identifying the clusters which share a similar fluorescent profile between the four different sites, and were speculated to belong to the same particle type.
3.3 Cluster diurnal variation
The average diurnal variation in each cluster at each site was plotted to identify any diurnal patterns which influence clus-ter concentration at each hour of the day (Fig. 3). These have been collated together according to the suggested groupings made based on the HAC analysis (Table 3), rather than at each site, in order to assess the ability to characterise parti-cles based on the fluorescent profiles, particle size and shape, and percentage contribution to the overall fluorescent particle population as in Sect 3.2.
Group 1 – Fungal Spore.Following the HAC method, the clusters comprising Group 1 were considered fungal spores. Both Davidstow Cluster 3 and Cluster 5 show a fairly static diurnal concentration, indicating that these are the same par-ticle type.
The stability in diurnal concentrations is also experienced for Capel Dewi Cluster 4 and Cluster 5, in which both clus-ters show small diurnal variation and remain relatively static. One exception to this is that Cluster 5 concentrations increase after 16:00, whereas Cluster 4 very gradually increases in concentration throughout the day, and then decreases after 21:00.
It can be concluded that these clusters have been accu-rately collected together and can be assumed to be the same type of particle. However, the behaviour of these clusters do not reflect typical fungal spore behaviour, and instead show some characteristics of bacterial particles given the lack of diurnal variation.
Group 2 – Fungal Spore.The clusters comprising Group 2 were suspected to be fungal spores. Both Chilbolton Cluster 1 and Cluster 2 exhibit a midday decrease in concentrations from ∼ 09:00–10:00 until 15:00–16:00, with Cluster 2 dis-playing a pronounced midday decrease compared to Cluster 1. This is similar to Weybourne Cluster 3 which exhibits a decline in concentration from 24:00 until 09:00, and remains low during the mid-morning, but very generally increases from 13:00 until 24:00. Weybourne Cluster 1 does not expe-rience a midday decline in concentrations and instead a de-crease in concentration occurs from 24:00 until 09:00, and in-creases gradually throughout the day until 21:00 after which concentrations become more stable. With the exception of Weybourne Cluster 1, the clusters in this group share similar diurnal patterns, which appears to be representative of fungal spore behaviour.
Group 3 – Bacteria or Fungal Spore.The two clusters in Group 3 experience an increase in concentrations before 09:00, which is more pronounced and gradual for Weybourne Cluster 2. This is followed by a decline in concentrations from around 24:00 –13:00 until 18:00 for both Chilbolton Cluster 3 and Weybourne Cluster 2. An increase in concen-trations from 18:00 onwards can be observed, with Wey-bourne exhibiting a gradual increase each hour until mid-night. The decline in concentrations during the day, espe-cially during warmer temperatures which occur after 24:00, is indicative of fungal spore activity. However, the cause of the increase in concentrations before 09:00, especially for Weybourne, is unclear.
Group 4 – Fungal Spore or Bacteria.Owing to the high fluorescence signal in channel FL1 Group 4 was assumed to be either a fungal spore or bacterial particle. Davidstow Cluster 4 shows the most distinct pattern of any cluster, with a gradual decrease in concentration until 8:00, followed by low concentrations from 09:00 until 18:00 after which con-centrations gradually increase. However, the trend for Capel Dewi Cluster 3 is not as distinct, with a very small diurnal variation.
The diurnal profiles of these two clusters do not match, even though the fluorescent profiles are similar. However, It is suggested that these clusters are both fungal spores, and it is proposed that, due to the size of the Capel Dewi dataset, the diurnal variation for this cluster is not as clear.
Group 5 – Pollen Fragment. This group of clusters was considered to be pollen fragments, owing to the low contribu-tion to the total fluorescent particle populacontribu-tion, and high flu-orescence in channel FL3, which was accompanied by high (Davidstow Cluster 1) to moderate (Chilbolton Cluster 4 and Weybourne Cluster 4) fluorescence in channel FL2.
Davidstow–CL5 Chilbolton–CL2 Weybourne–CL2 Capel Dewi–CL3 Davidstow–CL1 Capel Dewi–CL1 Capel Dewi–CL4 Weybourne–CL1 Weybourne–CL4 Capel Dewi–CL2 Capel Dewi–CL5 Weybourne–CL3
Figure 3. Average cluster diurnal variation at each site (a – Davidstow, b – Capel Dewi, c – Weybourne, and d – Chilbolton).
The trend is similar for both Chilbolton and Weybourne Cluster 4, in which there is a drop in concentrations dur-ing the morndur-ing, with lower concentrations durdur-ing the day, which then increase in the evening. This illustrates that these are fungal spores, unlike Davidstow Cluster 1, which shows more variation during the day. Considering this, it is possi-ble that only Davidstow Cluster 1 is a pollen fragment, and Chilbolton and Davidstow Cluster 4 are both fungal spores. This potentially illustrates that the dominance of channel FL2, when accompanied by a high signal in channel FL3, is what separates pollen from fungal spores.
Group 6 – Interferent.Previous literature has described a dominant signal in channel FL2 to be representative of in-terferent particles; however, for Group 6 the dominance in channel FL2 is accompanied by a moderate-to-high signal in channel FL3, and slightly lower signal in channel FL1.
The diurnal variation in Capel Dewi Cluster 1 and Clus-ter 2 is reminiscent of other clusClus-ters which have been sug-gested to be fungal spores, owing to the lower concentra-tions throughout the day, the decrease in concentraconcentra-tions in the morning, and subsequent increase in concentrations in the early evening. The identity of Davidstow Cluster 2 is uncer-tain, owing to the lack of fluctuations throughout the day, and
a fairly static concentration profile; therefore, further analy-sis with the meteorological data is required.
3.4 Meteorological influences
The influence of local scale meteorology, in particular the re-lationships between cluster abundance and temperature (◦C) and RH (%) were investigated in relation to bioaerosol abun-dance (as discussed in Sect. 1), but focusing on the cluster groupings between sites (Table 3), and not on a per site ba-sis. The associated figures are presented in the Supplement (Figs. S1–S8).
3.4.1 Temperature and relative humidity (RH)
Total fluorescent particle concentrations. The relationship between total fluorescent particles and temperature and RH at Weybourne show an increase in concentration with in-creased RH, and a decrease with inin-creased temperature. Sim-ilarly, total fluorescent particle concentrations increase with increased RH at Chilbolton, and show a decrease in concen-trations at temperatures > 5◦C. The behaviour for these sites is indicative of wet discharged fungal spores, and reflects the average diurnal activity of fluorescent particles at each site. Davidstow differs from these sites and instead experiences a decrease in concentration when RH > 60 % but a gradual increase in concentration with increasing temperature, de-creasing slightly at temperatures > 25◦C, which is indica-tive of bacterial particles. On the contrary, Capel Dewi does not present a clear trend with temperature and RH. A slight increase in concentration does appear once RH > 80 % and concentrations appear to gradually increase with tempera-ture, with lower concentrations experienced at 10–15◦C, and
a decrease in concentration occurring at > 20◦C.
Group 1 – Fungal Spore/Bacteria (Davidstow CL3 and CL5; Capel Dewi CL4 and CL5).The decrease in concen-tration for Davidstow Cluster 3 and Cluster 5 when RH is >60 % and temperatures are > 25◦C indicates this may be a bacterial particle as optimum temperatures for bacterial pro-duction have been found to be ∼ 22◦C in a salt marsh estu-ary (Apple et al., 2006). However, the decrease in concentra-tions above this temperature may indicate that this is a fungal spore; particularly Cladosporium, which has been found to be most abundant at temperatures of 20 to 24◦C (Fernández-Rodríguez et al., 2018). Though temperatures at Capel Dewi were lower than Davidstow, and the trend is less clear, it can be seen that Capel Dewi Cluster 4 shows a similar trend to Davidstow Cluster 3 and 5, and it is also suggested that this is either the fungal spore Cladosporium or a bacterial particle. Analysing the diurnal cluster time series, concentrations are higher during the day, and bacterial particle concentrations have been previously found to be lower between 21:00 and 05:00 (Shaffer and Lighthart, 1997), as a result of trapping of bacteria by the inversion layer and gradual accumulation throughout the day (Abdel Hameed et al., 2009). However,
Capel Dewi Cluster 5 does not show a clear trend, and dif-fers from other clusters in this group. It is possible that this is a wet discharged fungal spore, owing to the increased con-centration when RH increases, and decrease in concon-centration when temperature increases.
Group 2 – Fungal Spores (Chilbolton CL1 and CL2; Wey-bourne CL1 and CL3).The temperatures at Chilbolton were colder than those at Weybourne, and the prevalence of these clusters when temperatures are low (with the exception of Weybourne Cluster 1) and the general increase in these clus-ters with RH suggest that Chilbolton Cluster 1 and Cluster 2, and Weybourne Cluster 3, are wet discharged fungal spores. This is emphasised by the cluster diurnal time series, which, for the most part, displays higher concentrations in the early morning and evening. In comparison, Weybourne Cluster 1 does not exhibit a similar diurnal pattern, and does not show any particular trend with increased temperature, nor do con-centrations immediately increase with increased RH until RH is > 70 %. It cannot be assumed that this is a wet discharged fungal spore, and instead the cluster type is considered, at present, to be unknown.
Group 3 – Fungal Spores (Chilbolton CL3 and Weybourne CL2).Group 3 is inferred to comprise wet discharged fungal spores, owing to the decrease in concentrations when tem-peratures are > 10 and > 15◦C, for Chilbolton Cluster 3 and Weybourne Cluster 2, respectively. Though Weybourne Clus-ter 2 exhibits a decrease in concentrations at RH > 80 %, the general increase in concentrations with increasing RH further suggests that these are wet discharged fungal spores.
Group 4 – Fungal Spore (Davidstow CL4 and Capel Dewi CL3). Temperatures at Capel Dewi were colder than those at Davidstow, and concentrations increase until temperatures reach 5–10◦C. At temperatures > 10◦C the trend is less
clear, but do decrease slightly, with the exception of a peak occurring at 10–15◦C. Similarly, concentrations for David-stow Cluster 4 peak at 15◦C, and at temperatures above these the concentration decreases. Both clusters show similar RH patterns, with stable concentrations until a RH of > 70 % and >80 % for Davidstow and Capel Dewi, respectively. These characteristics are somewhat similar to those experienced for Group 2 and Group 3, and it is inferred that this group is wet discharged fungal spores.
Group 5 – Pollen Fragment (Davidstow CL1)/Fungal Spore (Chilbolton CL4; Weybourne CL4).This group was assumed to consist of pollen fragments; however, following analysis of the cluster diurnal profiles, Chilbolton Cluster 4 and Weybourne Cluster 4 were assumed to be fungal spores. It can be inferred that these two clusters are wet discharged fungal spores as there is a decrease in concentration at tem-peratures > 5◦C for Chilbolton and > 15◦C for Weybourne. Similarly, there is an increase in concentration with increased RH, with Weybourne Cluster 4 doing so once RH is > 50 %– 60 %. Davidstow Cluster 1 does not display a similar trend, instead concentrations increase with increased temperature until >25◦C, and decrease with increasing RH.
Consider-ter 2 was unknown following analysis of the average clusConsider-ter diurnal variation. However, the concentrations of this clus-ter increase at temperatures > 15◦C, and initially increase until RH > 60 %, in which a decrease in concentration oc-curs, which is suggestive of bacterial behaviour (Fig. 4). Capel Dewi Cluster 1 and Cluster 2 are dissimilar to David-stow Cluster 2, and though most average values are outside of the box-plot range, an increase in concentration occurs with increasing RH, especially for Capel Dewi Cluster 2 (Fig. 4). Similarly, concentrations increase until temperatures are > 5◦C, after which concentrations steadily decrease for Cluster 2. Similar to other groups, this behaviour is indica-tive of wet discharged fungal spores, such as Ascospores or Basidiospores.
3.4.2 Wind speed and wind direction
In the previous section, the data were split according to the fluorescent signal profiles, using HAC analysis to initially as-sign a cluster class, and cluster diurnal time series and me-teorological data to confirm or contradict these assumptions (Table 4).
Following this, the relationship between total fluorescent particles and clusters at each site were analysed as a func-tion of wind speed (m s−1) and wind direction using the LCM2015 at each site to identify the potential sources, and the abundance of different particulates between different land covered areas. The accompanying figures are presented in the Supplement (Figs. S9–S12).
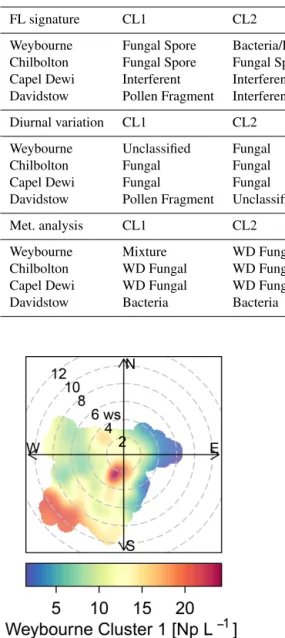
Weybourne
The sources of the total fluorescent particles at Weybourne appear to originate from a south-south-west (SSW) direc-tion at low wind speeds (2–4 m s−1; Fig. 5). Each cluster has higher concentrations from the SSW wind direction, at wind speeds of a fairly similar intensity as for total fluorescent par-ticles (∼ 2–4 m s−1). Cluster 1 additionally shows a source originating from a south-westerly (SW) direction at higher wind speeds of 10–12 m s−1(Fig. 6). Considering the pres-ence of fairly local fluorescent particles, the sources for all the clusters are likely to originate from the “improved grass-land” areas, which is likely to lead to higher fungal spore concentrations, and it can be inferred that there is an asso-ciation between grassland areas and wet discharged fungal spores. The exception to this is Cluster 1, which may com-prise fungal spores, but also particles from arable and horti-cultural land SW of the site. It is thereby possible that this cluster is a mixture of two different particle types, with one originating from the arable and horticultural land, and the
Total fluorescent particle concentrations at Chilbolton origi-nate from a local source at low wind speeds, with lower con-centrations of particles originating from a west-south-west (WSW) direction at wind speeds of ∼ 12–20 m s−1(Fig. 5). Concentrations from the WSW direction can be seen for Cluster 1 at wind speeds > 10 m s−1, in which, incidentally, there is a composting and mushroom farm, a probable source of fungal spores. Lower concentrations from the WSW wind direction can be seen for Cluster 2; however, most particles predominantly originate locally from a mixture of arable and horticultural land and some small improved grassland areas. Cluster 4 comprises particles from a local source, and simi-larly as does Cluster 3, from a north and north-westerly di-rection at wind speeds of < 5 m s−1. The surrounding land of Chilbolton Observatory comprises arable and horticultural land, with some improved grassland cover. Given the low wind speeds and local sources for Cluster 2, Cluster 3, and Cluster 4, it is likely that emissions from the surrounding land are the source of the suspected wet discharged fungal spores.
Davidstow
The source of fluorescent particles at Davidstow originate from a WSW wind direction, at wind speeds from ∼ 5– 10 m s−1(Fig. 5). Cluster 2, Cluster 3, and Cluster 5 show increased concentrations from this WSW direction and wind speed, with Cluster 2 and Cluster 5 exhibiting higher concen-trations from a SW wind direction. These clusters predom-inantly originate from the improved grassland land cover, but with some arable and agricultural land and some urban and suburban land. These clusters were assumed to comprise bacterial particles, and given the similarity in wind direction and wind speed for these three clusters it is likely that they originate from the same source, which may result from the local dairy farm and garden centre to the west. Cluster 4 was assumed to comprise wet discharge fungal spores, and this cluster shows high concentrations from a north or north-north-easterly (NNE) wind direction, at wind speeds of ∼ 4– 10 m s−1, which comprises both improved grassland and sub-urban areas, with a dairy factory roughly north-west of the site. Cluster 1 has high concentrations of particles originat-ing from a south-easterly wind direction at wind speeds of mostly < 5 m s−1, The land cover comprises urban land, with some heather, and predominant improved grassland. Similar to clusters 2, 3, and 5, Cluster 1 was suggested to comprise bacterial particles, which may originate from the urban area, as bacterial concentrations have been found to be higher in urban areas compared to other sites (Shaffer and Lighthart, 1997). However, the clusters which were assumed to
com-Figure 4. Group 6 was considered to be non-biological interferent particles following the HAC analysis, following Hernandez et al. (2016) in which FL2 (or type B) was the dominant signal. Instead, Davidstow Cluster 2 was deemed to be a bacterial particle, and Capel Dewi Cluster 1 and Cluster 2 wet discharged fungal spores following temperature (a) and relative humidity (b) analysis. (Site names shortened for brevity D – Davidstow, CD – Capel Dewi).
Figure 5. Total fluorescent particle concentration at each site for each campaign period (number of particles, Np, in units of L−1).
prise bacteria do not have a typical expected size range for bacterial particles, it is possible that these have been com-bined with another particle.
Capel Dewi
The source of total fluorescent particles at Capel Dewi mostly originate locally, with some contribution from a north-north-westerly (NNW) wind direction at wind speeds of 10– 14 m s−1 (Fig. 5). Cluster 5 comprises the largest cluster at Capel Dewi, and originates locally at a wind speed of <2 m s−1, from a southerly wind direction. There is also some very small contribution from an easterly wind direc-tion at a wind speed of 2–14 m s−1, and an additional small source from a NNW wind direction at speeds of 8–12 m s−1.
Cluster 5 and Cluster 4 were initially assumed to be wet dis-charged fungal spores owing to the similar fluorescence pro-file and abundance; however, following meteorological data analysis of Cluster 4 it was inferred that this was a bacte-rial particle. Cluster 4 is distinct and exhibits no apparent main source of fluorescent particles, though higher concen-trations can be seen to originate from a NNW wind direc-tion at similar wind speeds to Cluster 5. This cluster may originate from the broadleaf and coniferous woodland to the NNW of the site because, along with urban sites, forests have also been found to have higher bacterial emissions (Shaffer and Lighthart, 1997). Cluster 3 originates locally, with an ad-ditional source from a south-westerly wind direction at wind speeds < 6 m s−1; and similar to Cluster 5 and Cluster 4, a source from a NNW wind direction. The source of Cluster 3
Weybourne Fungal Spore Bacteria/Fungal Fungal Spore Pollen Fragment – Chilbolton Fungal Spore Fungal Spore Bacteria/Fungal Pollen Fragment –
Capel Dewi Interferent Interferent Fungal/Bacterial Fungal Spore Fungal Spore Davidstow Pollen Fragment Interferent Fungal Spore Fungal/Bacterial Fungal Spore Diurnal variation CL1 CL2 CL3 CL4 CL5 Weybourne Unclassified Fungal Fungal Fungal – Chilbolton Fungal Fungal Fungal Fungal – Capel Dewi Fungal Fungal Fungal Bacteria Bacteria Davidstow Pollen Fragment Unclassified Bacteria Fungal Bacteria
Met. analysis CL1 CL2 CL3 CL4 CL5
Weybourne Mixture WD Fungal WD Fungal WD Fungal – Chilbolton WD Fungal WD Fungal WD Fungal WD Fungal –
Capel Dewi WD Fungal WD Fungal WD Fungal Bacteria WD Fungal Davidstow Bacteria Bacteria Bacteria WD Fungal Bacteria
Figure 6. Weybourne Cluster 1 polar plot presenting two potential sources of biological particles, which when using Fig. 1 are likely to comprise improved grassland and arable and horticultural land.
may originate from the woodland or the improved grassland around the site, but comprise wet discharged fungal spores. Similarly, Cluster 1 and Cluster 2 were suspected to be wet discharged fungal spores, each of which show a similar trend and indicate a source to the east, at low wind speeds, which is a predominantly improved grassland area.
3.5 Sensitivity of the HAC method to fluorescent threshold
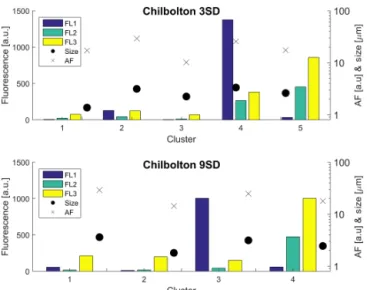
The data from each site were initially analysed using the original recommendation of a baseline FT ±3 SD from Kaye et al. (2005) as based on a limited laboratory dataset, prior to the use of FT ± 9 SD (Supplement Figs. S13–S16). Chilbolton produced a four-cluster solution when analysed using FT ± 9 SD, and produced a five-cluster solution when analysed using FT ± 3 SD. Concentrations, especially for Cluster 3 (9 SD), are lower than the original 3 SD cluster (which for the 3 SD bar plot is Cluster 4; Fig. 7). Fluores-cent particle number decreases when using the 9 SD thresh-old, consisting of 427 642 fluorescent particles compared to 1 427 843 fluorescent particles when using 3 SD.
When adopting the 9 SD threshold, potential interferents were removed, which represents a more robust solution for biological particle detection, although low activity within aged biological particles may mean these are removed as well.
4 Conclusions
Hierachical agglomerative cluster (HAC) analysis was used to characterise biological particles from three sites in a rural environment (Davidstow, Chilbolton, and Capel Dewi) and one site on the coast of England (Weybourne). The use of forced trigger (FT) + 9 SD for baseline fluorescence as op-posed to +3 SD produced clusters which were considered bi-ological following meteorbi-ological data analysis, which may result from the use of FT + 9 SD, in which potential interfer-ents were removed.
Figure 7. Sensitivity of the HAC threshold using 3 SD and 9 SD for analysis of the Chilbolton dataset.
Often, clusters which displayed a similar fluorescence pro-file were segregated due to differences in particle size and shape. Though most clusters could be attributed to a certain biological particle type, Weybourne Cluster 1 was unique, and was inferred to be a mixture of two different particles, owing to different meteorological activity compared to other clusters and origin from potentially two sources as identified using polar plots in association with the LCM2015.
When using fluorescent signal intensities for particle iden-tification, this would, for the most part, provide incorrect par-ticle identification (Table 4). The use of meteorological data allowed for the initial assumptions made to be either discred-ited or improved upon. For the clusters which were consid-ered to be interferents, owing to the high signal in channel FL2, meteorological data analysis instead indicated clusters of biological origin (Table 4).
Clusters that were considered to be pollen fragments (Group 5) were accompanied by high (Davidstow Cluster 1) to moderate (Chilbolton and Davidstow Cluster 4) signal in channel FL2. It was speculated that the intensity of channel FL2, when accompanied by a high signal in channel FL3, is what separates pollen from fungal spores. However, fol-lowing meteorological data analysis, Group 5 was inferred to comprise wet discharged fungal spores (Chilbolton and Weybourne Cluster 4) and bacteria (Davidstow Cluster 1). Though the original identity inferred using the fluorescent profiles was incorrect, the dominance of FL2 may have pro-vided some distinction between bacteria and fungal spores.
For Weybourne, Chilbolton, and Capel Dewi the most common cluster class was wet discharged fungal spores, which comprised almost all of the clusters at each site. On the contrary, Davidstow, a site comprising mostly improved grassland and some arable and horticultural land, similar to the other sites, has mostly bacterial clusters. Emissions from
the dairy factory located close to the site are likely to have influenced the experienced concentrations at Davidstow, in addition to the main source of Cluster 2, Cluster 3, and Clus-ter 5, which originated from the grassland and suburban land where there is a local dairy farm and small garden centre.
Using land cover maps and associated polar plots proved beneficial for identifying potential sources of clusters and in some cases helped characterise clusters (e.g. Weybourne Cluster 1). However, certain cluster types could not be clearly attributed to a specific land cover type. Overall, more wet discharged fungal spores appeared to be associated with im-proved grassland areas. More variety was found for bacte-rial clusters, ranging from broadleaf and coniferous wood-land (Capel Dewi Cluster 4) to a mixture of suburban, arable, and improved grassland (Davidstow Cluster 2, Cluster 3, and Cluster 5), which is likely to be influenced by the presence of the local dairy farm and small garden centre at Davidstow. To our knowledge this is the first use of ArcGIS land cover mapping in association with airborne bioaerosol concentra-tions collected using a UV-LIF spectrometer to identify dis-tinctive emission patterns and factors. This analysis relied upon the use of the HAC method; and as one of multiple unsupervised clustering approaches, it is possible that this analysis is subject to various levels of misclassification de-pending on the instrument used. Whilst the ancillary ambient data included in this study supports some of the derived clus-ter variability, it is not possible to comment further on this is-sue without additional laboratory data on known bioaerosol types. This is the subject of ongoing work and will be as-sessed in the near future, with the discussion of results from the referenced “Dstl experiment 2017” to be published in 2019.
For future studies, more published data and information on the reaction of different speciated biological particle types to fluctuations in meteorological conditions, such as RH and temperature, would aid particle type characterisation in stud-ies such as this.
Data availability. Owing to the variable size and format of the data used in this study, the data is only available by contacting the lead author.
Technology Laboratory (Dstl). This data included bacteria comprising unwashed E. coli and Bacillus atrophaeus spores, and following research into pollen type abundance in the United Kingdom, poplar, aspen, and ryegrass pollen. Addi-tionally, fungal spore data (Alternaria and Cladosporium) collected using a WIBS-4M during an intensive chamber ex-periment conducted at Dstl were also used for comparison to the ambient clusters. Further details of this experiment are to be published in 2019. Similar particle types included in this study have been previously sampled by other UV-LIF spectrometers e.g. Hernandez et al. (2016) and Savage et al. (2017). Here, data from both experiments were clustered in the same way as the ambient data (as described in Sect. 2.3), with the dominant cluster compared to the ambient fluores-cent profiles.