Strategy and Development Review Volume: 09 / N°: 16 (2019), p 27-42
The role of companies’ growth analysis in evaluating their financial performance: with a case study
ENNEMRI Nasreddine
University of Boumerdes, ([email protected])
Received: 04/09/2018 Accepted: 08/12/2018 Published: 23/01/2019
Abstract
This research has a great importance since it illustrates how to evaluate the financial performance by focusing on the main indicators issued from growth analysis. The research investigated tow companies working in Algeria which are: EL-AURASSI hotel and NCR ROUIBA specialized in juice production.
The main findings of the research prove that the difference of the performance realized by the tow companies is mainly due to the difference of the compatibility that should be kept between the value of capital employed and the volume of sales.
Keywords: growth; performance; financial performance; performance evaluation; growth analysis.
JEL Classification Codes: G39, L25.
صخلم
اذه برتعي
ثحبلا
ىلع ءوضلا طلسي هنلأ ماه
ب ليالما ءادلأا مييقت ةيفيك
ةعوممج ىلع دامتعلاا
نم
ب ةقلاع اله تيلا تارشؤلما
ةسسؤلما ونم ليلحت
.
دقو
ا زكر
اهم رئازلجا في ينتطشان ينتسسؤم ىلع ثحبل
:
يسارولأا قدنف
ةبيور تابورشم ةسسؤمو
.
و
ثحبلا اهيلإ لصوت تيلا جئاتنلا مهأ دكؤت
لىولأا ةجردلاب دوعي انمإ ينتكرشلا ءادأ في توافتلا نأ
هفلاتخا لىإ
ام
ةرمثتسلما لاوملأا ةميق ينب بولطلما نزاوتلا ثادحإ في
امهلبق نم
لامعلأا مقر مجحو
ققلمحا
.
ةيحاتفم تاملك
:
،ليام ءادأ ،ءادأ ،ونم
ومنلا ليلتح ،ءادلأا مييقت
.
N. ENNEMRI The role of companies’ growth analysis in evaluating their financial performance: with a case study
1. INTRODUCTION
The world economy is characterized currently by many developments among them are: digital progression, globalization, market expansion…, etc. These developments have obliged a lot of economic companies to change their management system. In fact, several economic companies have started to implement some strategies aiming to improve their performance in order to achieve suitable growth rates, knowing that such suitable rates should be equivalent to the growth pattern realized at the market where they supply their products.
Indeed, growth is an opportunity and a great challenge for all the economic companies because it is a way of creating financial surplus. It is a very hard and complicated strategic path owing to the fact that it can not be a source of financial surplus without having a strong administration able to clarify all the factors of creating wealth. This administration should have as well good skills in order to determine the best management tools aiming to illustrate how to conduct the financing resources owned by the company and, as a result, take the right decisions to conduct the growth into the creation of financial surplus.
Also, the internal growth rate is a very important tool that can be used in order to conduct growth strategies. So it can clarify several aspects that should be taken into consideration by the company to generate financial surplus. In addition, this rate is able to be divided into many indicators explaining the manner of creating wealth because it is related to several variables of financial policies, production policies and commercial policies, which represent the key elements of creating wealth. It contains as well a lot of indicators that can be used to evaluate the financial performance such as: return on equity, return on capital employed…, etc.
This research aims to diagnose the variables that can be controlled by the company in order to create financial surplus by illustrating the different variables related to the internal growth rate. As well, the research aims to investigate the relationship between the indicators issued from that rate and the objective concerning the creation of financial surplus using the financial
Strategy and Development Review Volume: 09 / N°: 16 (2019), p 27-42
statements of tow companies working in Algeria which are: EL AURASSI hotel and NCR ROUIBA.
1.1. Problematic of the research:
The research tried to treat the following problematic:
- Are the indicators issued from the analysis of the internal growth rate able to clarify the path that should be taken by the economic company in order to create financial surplus?
1.2. Importance of the research:
The importance of the research especially appears at the current time because the economic company can ensure its life by achieving, at least, equivalent growth rates to the rate realized by the other companies working against it. For this reason, the research tried to analyze the internal growth rate in order to determine how the economic company can transform its growth into an adequate level of financial surplus, which is very important to be generated to improve the position of the company at the market where it works.
1.3. Literature review:
Many ratios and indicators are useful to evaluate the ability of economic companies to conduct their growth strategies in hope of creating financial surplus. Among them are the upcoming indicators:
1.3.1. Return on equity: this indicator represents the relationship between net profit and equity. It describes the volume of profit gotten by just only one unity of equity employed by the company. It can be calculated as fallows (Barreau & Delahaye, 2001):
FP R RF net
Knowing that: RF : return on equity, Rne t : net profit, FP : equity.
This ratio can be divided into three other ratios as it is presented by the following equation (Evraert, 1991):
FP CI CI CA CA R RF net . .
N. ENNEMRI The role of companies’ growth analysis in evaluating their financial performance: with a case study
This equation shows that return on equity contains three variables which are:
- Net profit margin CA Rnet
: this ratio reflects the volume of net profit for every one dinar of sales.
- Capital employed turnover CI CA
: this ratio evaluate whether the company has succeeded to use its assets.
- Debt ratio FP CI
: this ratio shows whether the company is dependent in financing its assets.
1.3.2. Financial leverage: financial leverage represents the effect of debt on return on equity. It can be described using the following equation (Vernimmen, 2014):
RE RE i D FP T
RF / 1
Knowing that: RE : return on capital employed, T : taxes rate, D : long run debt, i : interest rate.
This equation illustrates that the effect of financial leverage can be positive if return on capital employed is above interest rate. For this reason, the return on capital employed is considered as an indicator of financial surplus. Also, it can be divided as fallows (using DuPont analysis manner):
CI CA CA R RE exp * exp R : operating result, CA Re xp
: operating margin rate, CI CA
: capital employed turnover.
Strategy and Development Review Volume: 09 / N°: 16 (2019), p 27-42
1.3.3. Internal growth rate: the internal growth rate is calculated by return on equity multiplied by retention rate (Vernimmen, 2014).It can be presented as will by the following equation (Hoarrau, 2008):
. RE i d FP D RE I RF g 1 1
Knowing that: d : dividend rate, g : internal growth rate.
This equation proves that the economic company can finance its growth using a part of its net profit. Thus, it can enhance its growth using an adequate value of debt if return on capital employed is expected to be above the interest rate.
2. Method:
The purpose of this study is to determine whether the ratios issued from the analysis of internal growth are able to clarify the path that should be taken by the economic company in order to create wealth and to improve its own financing sources. The study based on tow companies listed in the Algerian stock exchange over the period 2011-2016. These companies are: EL AURASSI hotel and NCR ROUIBA specialized in juice production. 2.1. Variables of the research:
The main variables of the research are the principal indicators issued from the analysis of internal growth which represent the different factors affecting the value of return on equity. So, the last ratio represents the main indicator aiming to evaluate the ability of the tow companies to transform the financing sources used to finance its growth into financial surplus. Also, the research used some indicators else to take into consideration the impact of the factors that can not be obtained from growth analysis on the ability of the companies to create added values.
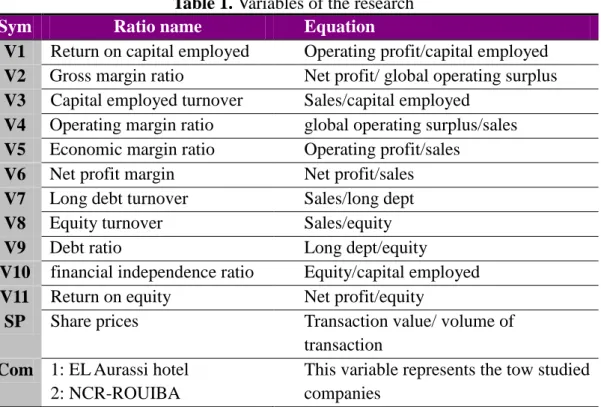
The next table illustrates the different indicators used in the research as well as the ratios by which they can be calculated:
N. ENNEMRI The role of companies’ growth analysis in evaluating their financial performance: with a case study
Table 1. Variables of the research
Sym Ratio name Equation
V1 Return on capital employed Operating profit/capital employed
V2 Gross margin ratio Net profit/ global operating surplus
V3 Capital employed turnover Sales/capital employed
V4 Operating margin ratio global operating surplus/sales
V5 Economic margin ratio Operating profit/sales
V6 Net profit margin Net profit/sales
V7 Long debt turnover Sales/long dept
V8 Equity turnover Sales/equity
V9 Debt ratio Long dept/equity
V10 financial independence ratio Equity/capital employed
V11 Return on equity Net profit/equity
SP Share prices Transaction value/ volume of
transaction
Com 1: EL Aurassi hotel
2: NCR-ROUIBA
This variable represents the tow studied companies
Source: prepared by the researcher
From the table, the indicators can be classified as follows:
- 1st group: this group contains the ratios having a relation with the financial structure which are: debt ratio and the ratio of financial independence.
- 2nd group: this group contains the ratios of activity which measure the ability of the company to use its assets in order to improve its volume of sales. The ratios of this group are: equity turnover, long debt turnover as well as capital employed turnover.
- 3rd group: this group contains the ratios of profitability which are: economic margin ratio, gross margin ratio, return on capital employed.
Strategy and Development Review Volume: 09 / N°: 16 (2019), p 27-42
2.2. Research data:
The data of the research has been obtained from the financial statements of the tow companies covering the period 2002-2016. As well, the researcher used some reports published by the Algerian stock exchange market to complete the data.
2.3. Model of the research:
First of all, the research tried to investigate the relationship between return on equity, which has been used as a dependent variable, and all the other ratios which have been used as independent variables. Then, the research tried to investigate the difference between the tow companies in order to determine whether there is a fluctuation from a company to another concerning the value of each variable.
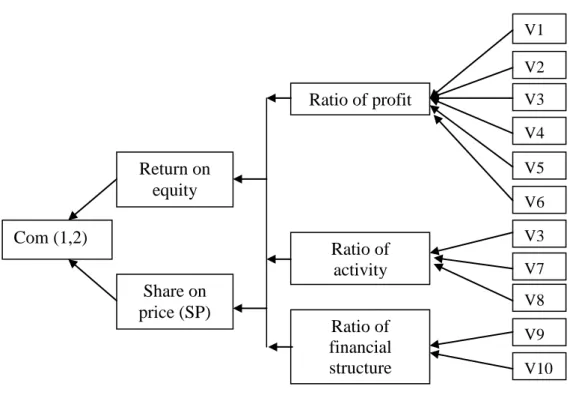
Figure 1.Model of the research
Source: prepared by the researcher
From the figure, the main hypotheses of the research can be established as follows: V1 V2 V3 V4 V5 V9 V8 V6 V3 V7 V10 Ratio of profit Ratio of activity Ratio of financial structure Return on equity Share on price (SP) Com (1,2)
N. ENNEMRI The role of companies’ growth analysis in evaluating their financial performance: with a case study
1
H
: There is a significant difference between the tow companies concerning the value of the ratios of financial structure, the ratios of activity as well as the ratios of profitability.
0
H
: There is not a significant difference between the tow companies concerning the value of the ratios of financial structure, the ratios of activity as well as the ratios of profitability.
3. Results and discussion:
Using the upcoming statistical tools, the data of the research has been analyzed as fallows:
3.1. Ratios progression:
The progression of the ratios of each company is given thanks the tow following tables:
3.1.1. EL AURASSI: the ratios of EL AURASSI hotel studied is presented in the following table:
Table 2. The results of the variables of the research (EL-AURASSI)
V1 V2 V3 V4 V5 V6 V7 V8 V9 V10 V11 -0.06 -1.35 0.01 -3.96 -5.64 -5.37 0.017 0.032 1.86 0.349 -0.17 0.539 0.76 1.18 0.46 0.455 0.35 0.228 0.392 1.71 0.368 0.139 0.043 0.316 0.206 0.51 0.208 0.164 0.319 0.584 1.82 0.353 0.096 0.092 0.423 0.296 0.566 0.31 0.24 0.476 0.78 1.63 0.378 0.187 0.073 0.38 0.267 0.552 0.27 0.212 0.46 0.623 1.32 0.429 0.132 0.05 0.242 0.259 0.514 0.192 0.124 0.471 0.578 1.22 0.449 0.072
Source: from SPSS using the research data
The table shows that all the ratios of profitability which are: return on capital employed (v1), gross margin ratio (v2), operating margin ratio (v5), net profit margin (v6) recorded during the period studied by the researcher knew a little fluctuation from a year to another. This fluctuation is due to the variation of the value of capital employed turnover (v3), long debt turnover (v7) and equity turnover (v8) which means that there is a little incompatibility between the value of sales and the assets allocated by the company in order to achieve the targeted sales. The table shows as well that
Strategy and Development Review Volume: 09 / N°: 16 (2019), p 27-42
the value of debt decreased a little bit and the ratio of financial independence increased, proving that the company decided to reduce its debt in comparison with its equity.
3.1.2NRC ROUIBA: this company achieved a performance that can be evaluated by the following ratios:
Table 3. The results of the variables of the research (NRC-ROUIBA)
V1 V2 V3 V4 V5 V6 V7 V8 V9 V10 V11 0.155 0.278 2.055 0.141 0.075 0.039 5.621 3.239 0.576 0.634 0.127 0.14 0.218 2.417 0.132 0.057 0.028 7.04 3.68 0.522 0.656 0.106 0.117 0.29 1.85 0.128 0.063 0.037 4.01 3.445 0.858 0.538 0.13 0.097 0.303 1.511 0.146 0.0644 0.044 2.627 3.55 1.353 0.424 0.156 0.084 0.182 1.453 0.135 0.0581 0.025 2.413 3.65 1.513 0.397 0.0913 0.063 0.131 1.6 0.124 0.0396 0.016 2.74 3.86 1.41 0.414 0.063
Source: from SPSS using the research data
The table illustrates that despite the decrease of the value of return on capital employed, the other ratios of profitability (gross margin ratio (v2), operating margin ratio (v4), economic margin ratio (v5), net profit margin (v6)) proves that there is a fluctuation in their values, which means that the company recorded a fluctuation in the values of several elements of its income statement.
In addition, the ratio of long debt turnover and the ratio of equity turnover show the decrease of sales in comparison with the increase of the debt used by the company which is proven as well by the ratio of debt (v9) and the ratio of financial independence.
Moreover, the table shows that the company tried to reduce its debt in 2016 in order to correct its situation since in this year the debt increased as it is proven by long debt turnover (v7), debt ratio (v9) and financial independence ratio (v10).
In general, the most important idea provided by this analysis, which is based on the description of the calculated ratios issued from growth analysis, shows that the performance of the tow companies is different a little bit between each other owing to the fact that each company has its own structure of assets and liabilities.
N. ENNEMRI The role of companies’ growth analysis in evaluating their financial performance: with a case study
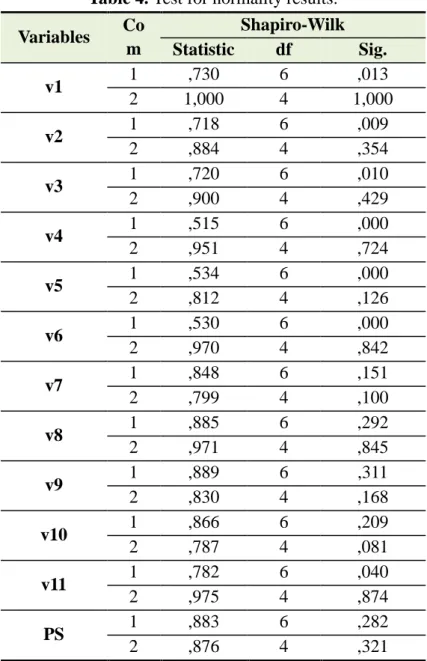
3.2. Test of normality:
To determine whether the variables are suitable to examine the hypotheses of the research, the researcher used Shapiro-Wilk" for concluding that they fallow normal distribution or not, knowing that such conclusion has a direct impact on the adequate statistical test. The results are as follows:
Table 4. Test for normality results. Variables Co m Shapiro-Wilk Statistic df Sig. v1 1 ,730 6 ,013 2 1,000 4 1,000 v2 1 ,718 6 ,009 2 ,884 4 ,354 v3 1 ,720 6 ,010 2 ,900 4 ,429 v4 1 ,515 6 ,000 2 ,951 4 ,724 v5 1 ,534 6 ,000 2 ,812 4 ,126 v6 1 ,530 6 ,000 2 ,970 4 ,842 v7 1 ,848 6 ,151 2 ,799 4 ,100 v8 1 ,885 6 ,292 2 ,971 4 ,845 v9 1 ,889 6 ,311 2 ,830 4 ,168 v10 1 ,866 6 ,209 2 ,787 4 ,081 v11 1 ,782 6 ,040 2 ,975 4 ,874 PS 1 ,883 6 ,282 2 ,876 4 ,321
Strategy and Development Review Volume: 09 / N°: 16 (2019), p 27-42
The table illustrates all the variables following normal distribution since the null hypothesis of no normal distribution exists; should be rejected for these variables because P-value (sig in the table) is above 0.05.
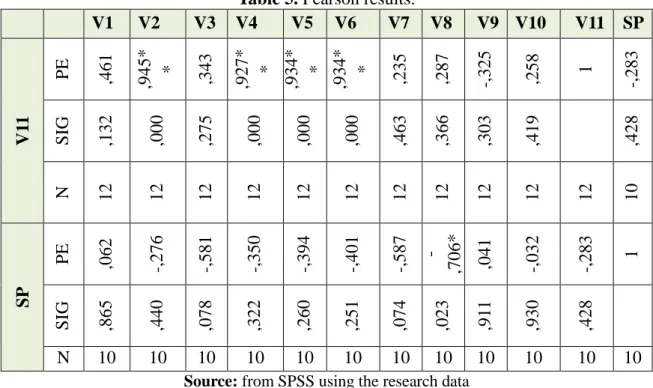
3.3. Pearson correlation:
In order to determine the nature of the relationship that exists between return on equity (v11), share price (SP) and all the independent variables, the researcher used Pearson correlation like it is presented in the following table:
Table 5. Pearson results.
V1 V2 V3 V4 V5 V6 V7 V8 V9 V10 V11 SP V1 1 PE ,461 ,945* * ,343 ,927* * ,934* * ,934* * ,235 ,287 -,325 ,258 1 -,283 S IG ,132 ,000 ,275 ,000 ,000 ,000 ,463 ,366 ,303 ,419 ,428 N 12 12 12 12 12 12 12 12 12 12 12 10 SP PE ,062 -,276 -,581 -,350 -,394 -,401 -,587 -,706* ,041 -,032 -,283 1 S IG ,865 ,440 ,078 ,322 ,260 ,251 ,074 ,023 ,91 1 ,930 ,428 N 10 10 10 10 10 10 10 10 10 10 10 10
Source: from SPSS using the research data
The table provides evidence that there is a significant correlation between return on equity (v11), gross margin ratio (v2), operating margin ratio (v4), economic margin ratio (5) and net profit margin (v6). Such results are very normal because they represent the ratios of profit taking part of return on equity, but the correlation of all these ratios, including return on equity, with share price is not significant which means that the internal performance didn’t reflect the external performance gotten by the tow companies at the Algerian financial stock market.
N. ENNEMRI The role of companies’ growth analysis in evaluating their financial performance: with a case study
Also, the table shows that there is not a significant correlation between return on equity, return on capital employed (v1), capital employed turnover (v3), long debt turnover (v7) and equity turnover (v8). This situation may reveal that the volume of investment at one of the tow companies is not suitable with their volume of sales, because the common points between all these variables are capital employed and sales. Moreover, the results illustrates that debt ratio (v9) and the ratio of financial independence don’t have a significant correlation with return on equity, which means, probably, that there is a difference between the tow companies in term of choosing the suitable financial structure.
3.3.3. Statistical comparison between the tow companies:
From the previous analysis the researcher try to determine the correlation between return on equity and the deferent variables of the research in order to evaluate the performance of the tow companies at the same time. From that analysis, the correlation is weak and insignificant with many financial ratios such as: return on capital employed (v1), capital employed turnover (v3), long debt turnover (v7), equity turnover (v8)…, etc. These results disagree with what it has theoretically been proven. For this reason the comparison between the tow companies may reveal why such disagreement has so far been revealed.
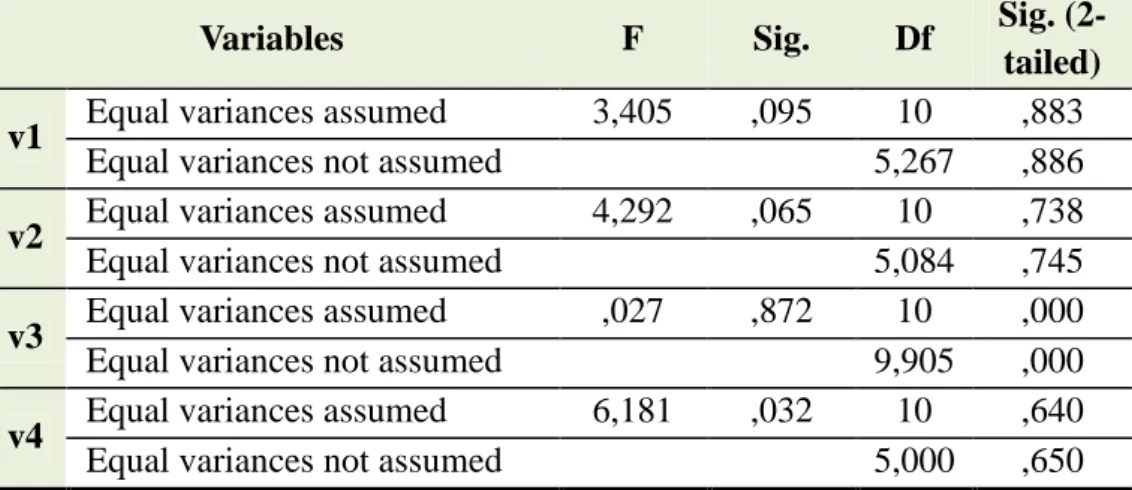
The results of the comparison between the tow companies using independent sample t-test are presented in the following table:
Table 6.Independence t-test results
Variables F Sig. Df Sig.
(2-tailed)
v1 Equal variances assumed 3,405 ,095 10 ,883
Equal variances not assumed 5,267 ,886
v2 Equal variances assumed 4,292 ,065 10 ,738
Equal variances not assumed 5,084 ,745
v3 Equal variances assumed ,027 ,872 10 ,000
Equal variances not assumed 9,905 ,000
v4 Equal variances assumed 6,181 ,032 10 ,640
Strategy and Development Review Volume: 09 / N°: 16 (2019), p 27-42
v5 Equal variances assumed 6,169 ,032 10 ,460
Equal variances not assumed 5,000 ,477
v6 Equal variances assumed 6,166 ,032 10 ,443
Equal variances not assumed 5,000 ,460
v7 Equal variances assumed 12,930 ,005 10 ,001
Equal variances not assumed 5,093 ,004
v8 Equal variances assumed ,152 ,705 10 ,000
Equal variances not assumed 9,641 ,000
v9 Equal variances assumed 5,817 ,037 10 ,025
Equal variances not assumed 8,190 ,029
v1 0
Equal variances assumed 12,692 ,005 10 ,034
Equal variances not assumed 6,272 ,048
v1 1
Equal variances assumed 2,519 ,144 10 ,509
Equal variances not assumed 5,636 ,520
SP Equal variances assumed ,072 ,795 8 ,039
Equal variances not assumed 7,598 ,033
Source: from SPSS using the research data
The table provides evidence the previous analysis mentioning that there is a difference between the tow companies in terms of the value of all the ratios which didn’t have a significant relationship with return on equity. In fact, the table illustrates that P-value (Sig. (2-tailed) in the table) is less than 0.05 for capital employed turnover (v3), long debt turnover (v7) and equity turnover (v8), debt ratio (v9) as well as the ratio of financial independence. This proven difference reveals that the tow companies didn’t succeeded to get the optimum level between the volume of sales and their capital employed but by a different degree between these tow companies.
Regardless whether the tow companies are not similar between each other in terms of their activities; since the first one is providing services, and the second one is a production company, they are competitor to each other because both are listed in the Algerian stock market, which means that each one should try to provide for the investors a higher level of profit in order to keep and improve its share prices. For this reason, it is critical to study the relationship between the previous ratios and share price (SP in the
N. ENNEMRI The role of companies’ growth analysis in evaluating their financial performance: with a case study
improving share prices in the financial market. Furthermore, since PEARSON correlation showed that there is not a significant correlation between nearly all the ratios and SP, and independence t-test proved the difference between the tow companies concerning SP, the researcher concluded that the difference between the tow companies, in term of how to determine and keep the best amount of the previous ratios, has been determinant for the performance of each company.
4. Conclusion:
The internal growth rate is a global indicator to determine how to conduct growth strategies. Indeed, it can reveal many aspects that should be taken into consideration by the company in order to create financial surplus. So, this indicator may show the main factors of creating added values, owing to the fact that it is related to many variables of production, financial and commercial policies. As well, it is related to many indicators such is: return on capital employed, operating margin ratio, capital employed turnover and return on equity.
Additionally, the Return on equity is a very important indicator for analyzing and conducting companies’ growth into the creation of financial added values. So, this indicator can be analyzed into several variables representing the different factors determining, in turn, how to create profit. Also, this indicator should be analyzed in order to determine how can some variables such as: debt ratio, the ratio of financial independence, capital employed turnover, long debt turnover, equity turnover …, ect, affect the value of return on equity. Indeed, this research revealed that according to the difference recorded in the value of all those indicators between the tow companies, the performance was difference because these companies had had a different level concerning the best coordination between the volume of sales and the capital employed by each company, knowing that the growth of capital employed should be accompanied by an adequate increase of sales in order to cover all the fixed costs related to the capital employed.
Moreover, this research illustrated several results, the most important of them are:
Strategy and Development Review Volume: 09 / N°: 16 (2019), p 27-42
- Despite that there are many indicators to evaluate the ability of creating financial surplus; the internal growth rate represents the main indicator owing to the fact that it reflects many factors influencing the purpose of creating financial surplus. Also, return on equity is considered as a very important indicator to evaluate the impact of internal growth on financial surplus.
- This study illustrated that there is a huge coordination between return on equity and several indicators evaluating the efficient of internal growth such as: gross margin ratio, operating margin ratio, economic margin ratio and net profit margin. This coordination has been revealed when the researcher tried to use the indicators, issued from the internal growth rate, to evaluate the performance of EL AURASSI hotel and NCR ROUIBA. In fact, the results show the importance of such indicators and their role in evaluating the financial performance.
- The weak correlation of return on equity and return on capital employed, capital employed turnover, long debt turnover, equity turnover, debt ratio, financial independence ratio proves that implementing a good coordination between the volume of sales and the amount of capital is among the crucial factors, which can improve the value of return on equity because the common points between all the previous indicators are: sales and capital employed.
- The comparison between the tow companies using independence t-test proves the previous results, because the difference between the amounts of return on equity of the tow companies is related to the difference between them in terms of getting the best coordination between the volume of sales and the amount of capital employed.
Also, some recommendations are crucial to be given for other researchers as well as the companies working in Algeria. These recommendations are as follows:
It is critical for any company to determine the optimal growth level that should be determined by taking into consideration the financial abilities of the company.
N. ENNEMRI The role of companies’ growth analysis in evaluating their financial performance: with a case study
Growth strategies must be translated into clear goals that should be, in turn, controlled by the indicators related to the analysis of the internal growth rate.
It is crucial as well to focus on all the factors revealed, thanks the analysis of internal growth, by implementing the practices aiming to improve operating margin and capital employed turnover.
Estimating the reasonable level of financial independence is among the critical factors of success. For this reason, it is worthy to determine the optimal financial structure in order to enhance the flexibility of the company to take its decisions.
In order to be able to figure out the anomalies, the company should study the relationship between return on equity and the other indicators related to the analysis of internal growth.
5. Bibliography List : 5.1. Books:
Barreau, J., & Delahaye, J. (2001). gestion financière. Paris: Dunod. Evraert, S. (1991). analyse et diagnostique financiers. Paris: Eyrolles. Hoarrau, C. (2008). analyse et evaluation financières des entreprises et des
groupes. Paris: Vuibert.
5.2. Internet sites:
Vernimmen. (2014). Retrieved 11 15, 2014, from www.vernimmen.net/Vernimmen/Resumes/Partie_1_Le_diagnostic_fi nancier/Chapitre_14_L_analyse_de_la_rentabilite_comptable.html Vernimmen. (2014). Retrieved 11 15, 2014, from
www.vernimmen.net/Vernimmen/Resumes/Partie_4_La_politique_fin anciere/Chapitre_40_La_politique_de_distribution_ou_rendre_de_larg ent_aux_actionnaires.html