HAL Id: hal-01617700
https://hal-polytechnique.archives-ouvertes.fr/hal-01617700
Submitted on 16 Oct 2017
HAL is a multi-disciplinary open access
archive for the deposit and dissemination of
sci-entific research documents, whether they are
pub-lished or not. The documents may come from
teaching and research institutions in France or
abroad, or from public or private research centers.
L’archive ouverte pluridisciplinaire HAL, est
destinée au dépôt et à la diffusion de documents
scientifiques de niveau recherche, publiés ou non,
émanant des établissements d’enseignement et de
recherche français ou étrangers, des laboratoires
publics ou privés.
fluorophores in living tissues by wavelength mixing
Chiara Stringari, Lamiae Abdeladim, Guy Malkinson, Pierre Mahou, Xavier
Solinas, Isabelle Lamarre, Sébastien Brizion, Jean-Baptiste Galey, Willy
Supatto, Renaud Legouis, et al.
To cite this version:
Chiara Stringari, Lamiae Abdeladim, Guy Malkinson, Pierre Mahou, Xavier Solinas, et al.. Multicolor
two-photon imaging of endogenous fluorophores in living tissues by wavelength mixing. Scientific
Reports, Nature Publishing Group, 2017, 7 (1), pp.3792 - 3792. �10.1038/s41598-017-03359-8�.
�hal-01617700�
www.nature.com/scientificreports
Multicolor two-photon imaging of
endogenous fluorophores in living
tissues by wavelength mixing
Chiara Stringari
1, Lamiae Abdeladim
1, Guy Malkinson
1, Pierre Mahou
1, Xavier Solinas
1,
Isabelle Lamarre
1, Sébastien Brizion
2, Jean-Baptiste Galey
2, Willy Supatto
1, Renaud Legouis
3,
Ana-Maria Pena
2& Emmanuel Beaurepaire
1Two-photon imaging of endogenous fluorescence can provide physiological and metabolic information from intact tissues. However, simultaneous imaging of multiple intrinsic fluorophores, such as nicotinamide adenine dinucleotide(phosphate) (NAD(P)H), flavin adenine dinucleotide (FAD) and retinoids in living systems is generally hampered by sequential multi-wavelength excitation resulting in motion artifacts. Here, we report on efficient and simultaneous multicolor two-photon excitation of endogenous fluorophores with absorption spectra spanning the 750–1040 nm range, using wavelength mixing. By using two synchronized pulse trains at 760 and 1041 nm, an additional equivalent two-photon excitation wavelength at 879 nm is generated, and achieves simultaneous excitation of blue, green and red intrinsic fluorophores. This method permits an efficient simultaneous imaging of the metabolic coenzymes NADH and FAD to be implemented with perfect image co-registration, overcoming the difficulties associated with differences in absorption spectra and disparity in concentration. We demonstrate ratiometric redox imaging free of motion artifacts and simultaneous two-photon fluorescence lifetime imaging (FLIM) of NADH and FAD in living tissues. The lifetime gradients of NADH and FAD associated with different cellular metabolic and differentiation states in reconstructed human skin and in the germline of live C. Elegans are thus simultaneously measured. Finally, we present multicolor imaging of endogenous fluorophores and second harmonic generation (SHG) signals during the early stages of Zebrafish embryo development, evidencing fluorescence spectral changes associated with development.
Multiphoton microscopy is a powerful tool for label-free and non-invasive functional imaging in small organisms and tissues1, 2. Pulsed near infrared excitation light allows in-depth imaging based on contrasts such as
endog-enous fluorescence2, second harmonic generation (SHG)3 and third harmonic generation (THG)4. Endogenous
fluorescence in living tissues arises from several intrinsic biomarkers that play important roles in physiological processes2. The primary intracellular sources are NAD(P)H and FAD, the two major cofactors of redox
reac-tions in the cell and central regulators of energy production and metabolism5, 6. Their fluorescence reports on
the metabolic activity of cells allowing tissue physiology and processes such as stem cell differentiation, cancer development and neurodegenerative diseases to being non-invasively monitored7–12. The fluorescence lifetimes
of NADH and FAD are different upon binding to the protein during the electron transport chain. FLIM provides sensitive measurements of the free and protein-bound NAD(P)H ratio and of the redox states (NADH/NAD+) of
cells, and can be used to distinguish glycolytic and oxidative phosphorylation metabolic states13–17. Monitoring
lifetime of free and protein-bound FAD has also been exploited to quantify redox ratio FAD/FADH2, and used
as a biomarker of precancerous epithelial cells12. It is well established that retinoids play a crucial role in stem
cell differentiation and embryo development18, 19 and their concentration and gradients have been detected in
vivo during zebrafish development9, 20. Other intrinsic fluorophores such as porphyrin, collagen, elastin, keratin,
1Laboratory for Optics and Biosciences, Ecole polytechnique, CNRS, INSERM, Université Paris-Saclay, 91128,
Palaiseau cedex, France. 2L’Oréal Research and Innovation, 93600, Aulnay sous Bois, France. 3Institute for Integrative
Biology of the Cell (I2BC), CEA, CNRS, Univ. Paris-Sud, Université Paris-Saclay, 91198, Gif-sur-Yvette, France. Correspondence and requests for materials should be addressed to C.S. (email: [email protected]) or E.B. (email: [email protected])
Received: 21 February 2017 Accepted: 27 April 2017 Published: xx xx xxxx
lipofuscin and melanins have relevant roles in several physiological processes and diseases such as cancer and multiphoton microscopy can provide functional imaging in a non-invasive way21–24.
While several advanced approaches have been developed to improve identification and quantification of endogenous fluorophores based on fluorescence lifetime imaging9, spectrally resolved detection23, 25, and
spec-trally resolved FLIM26–28, multiphoton microscopy of endogenous fluorophores and its applications to live
imag-ing are still limited by acquisition speed and challengimag-ing multicolor excitation. Beimag-ing able to efficiently image multiple endogenous fluorophores simultaneously in tissues is a paramount objective, as it could possibly allow physiological and pathological processes to being tracked in dynamic systems. Endogenous fluorophores have non-overlapping two-photon absorption maxima in the range between 700 nm and 1000 nm2 and are present in
a wide variety of concentrations in living tissues. Imaging of multiple endogenous fluorophores is usually per-formed by sequential excitation at different wavelengths using a tunable laser, leading to imaging rates decreas-ing with the number of excitation wavelengths, and difficulties in ensurdecreas-ing pixel-level registration between the channels in the case of a dynamic sample. For example, NADH and FAD are often sequentially excited at 750 nm and 880 nm 12, 22, 29–31. Strategies conceived so far to simultaneously excite NADH and FAD with one single
wave-length32 can compensate the difference in absorption spectra and concentrations with the payoff of low excitation
efficiency.
To overcome these limitations, a mixed-wavelength excitation33 was implemented to achieve multicolor
two-photon imaging of endogenous fluorophores in living tissues. Wavelength mixing was recently demonstrated to being an effective approach for achieving simultaneous two-photon excitation of three fluorescent proteins with non-overlapping spectra, while being compatible with both standard point-scanning33 and light sheet34
excita-tion geometries. A distinct advantage of wavelength mixing for ratiometric measurements in the point-scanning geometry is that the fluorescence images are intrinsically co-registered at the scale of the diffraction-limited excitation volume33. We report here on the implementation of this strategy to the excitation of spectrally distinct
endogenous fluorophores and optical redox ratio imaging, overcoming the difficulties associated with sequential excitation at different wavelengths such as motion artifacts in living samples. We also demonstrate multicolor two-photon FLIM to characterize the microenvironment of endogenous fluorophores and their binding proper-ties. Through a simultaneous excitation of NADH and FAD in living tissues, reliable 2-photon ratiometric redox imaging and simultaneous FLIM of NADH and FAD are achieved with similar signal levels in both channels. Measurements of NADH and FAD lifetime gradients associated with cellular differentiation in living tissues such as reconstructed human skin and C. Elegans germ line are also presented.
Finally, a simultaneous imaging of several endogenous fluorophores and SHG signals in living zebrafish embryos is demonstrated.
Results
Efficient multicolor two-photon fluorescence lifetime imaging of endogenous fluorophores
in living tissues.
The principle of efficient multicolor two-photon FLIM of endogenous fluorophores is described in Fig. 1. To obtain simultaneous multicolor two-photon excitation by wavelength mixing over the 760–1040 nm range, we spatially and temporally overlapped two synchronous pulse trains produced by a com-mercial dual-output femtosecond laser at λ2 = 1041 nm (fixed output) and λ1 = 760 nm (tunable output) (Fig. 1aand Methods). In this configuration, the two beams separately generate one-color nonlinear processes, namely two-photon excited fluorescence (2PEF) of blue and red chromophores and second harmonic generation (SHG) (Fig. 1b and c). The spatiotemporal overlap of the two pulse trains provides an additional excitation route (Fig. 1b) via two-color two-photon excited fluorescence (2c-2PEF)33, which is equivalent to having a virtual third laser
pro-viding two-photon excitation at λv = 2/(1/λ1 + 1/λ2) = 879 nm, i.e. well suited for independent excitation of FAD.
Of note, additional nonlinear processes can result from dual-beam excitation, such as sum frequency generation (SFG) and four wave mixing (FWM) (Fig. 1b and c). Fluorescence signals were epi-detected (Fig. 1a) in three dif-ferent spectral ranges (blue, green and red), while SHG signal was forward detected (Fig. 1a). Appropriate emis-sion filters (Fig. 1c) were chosen to reject coherent signals (SHG, SFG, FWM) from the fluorescence channels.
FLIM was implemented with a custom made time-correlated single photon counting (TCSPC) system pro-viding simultaneous channels with 24 temporal bins of 500 ps (see Methods). The FLIM images were analyzed through phasor analysis9, 35 (Fig. 1d) and represented with the τϕ contrast (see Methods). Two-color two-photon
excitation increased FAD excitation efficiency (Fig. 1e and S1d) compared to excitation at 760 nm only (Fig. 1e), sequential single wavelength excitation at 760 nm and 900 nm respectively (Figs S1b and d) and single wavelength excitation at 800 nm (Fig. S1c and d), resulting in higher SNR and accuracy in the FLIM measurement (Figs S1d,
S2c and e). As shown on Fig. 1f, the measured fluorescence lifetime values of NADH and FAD were not affected by the wavelength mixing acquisition strategy.
Simultaneous excitation of NADH and FAD by wavelength mixing for fast redox imaging
and FLIM reveals a metabolic gradient associated with cellular differentiation in living
tis-sues.
Mixed wavelength two-photon excitation provides independent control of the excitation efficiency in three separate spectral ranges33, through the adjustment of the laser powers and of the delay between the pulsetrains. We optimized the 2-photon excitation efficiency of NADH and FAD by adjusting the power of the two laser beams (Fig. 1a), resulting in simultaneous images of comparable intensity despite the disparity in fluoro-phore concentrations (Fig. 1e, Methods).
Emission filters were chosen to minimize fluorescence bleed-through between the two channels. Figure S3
shows cells imaged using this approach. The molecular origin of the fluorescence detected in each channel was checked by submitting cells to the oxidative phosphorylation inhibitor potassium cyanide (KCN) that pre-vented the oxidation of NADH. This treatment resulted in an increase in the NADH fluorescence intensity (84 ± 30%) and a concurrent reduction in the FAD intensity signal (15 ± 9%) (Fig. S3a and c), confirming that the
www.nature.com/scientificreports/
predominant sources of signal were NADH fluorescence in the “blue” channel and FAD in the “green” channel. The metabolic drug had different impacts upon the fluorescence lifetimes of the two metabolites (Fig. S3b and d). Upon application of KCN, the measured NADH fluorescence lifetime significantly decreased from (1.87 ± 0.09) ns to (1.14 ± 0.1) ns, while the FAD lifetime only slightly decreased from (1.31 ± 0.04) ns to (1.10 ± 0.06) ns.
The metabolic imaging using NADH and FAD signals was performed in two tissue models for cell differen-tiation, namely reconstructed human skin (Fig. 2) and C. Elegans germ line (Fig. 3). Most proliferative cells rely on aerobic glycolysis in contrast to normal differentiated cells which rely primarily on oxidative phosphorylation
Figure 1. Principle of efficient multicolor two-photon fluorescence lifetime imaging of endogenous
fluorophores (a) Pulse trains from dual-output femtosecond laser (λ1 = 760 nm, λ2 = 1041 nm) are synchronized using a delay line and co-aligned in the microscope. Pulse synchronization gives rise to two-beam processes such as sum-frequency generation (SFG), two-color two-photon excited fluorescence and four wave mixing (FWM). Fluorescence signals are epi-detected in three different spectral channels, while SHG is forward detected. Time-correlated single photon counting (TCSPC) electronics measures the arrival time of the fluorescence photons with respect to the laser pulse. (b) Two-photon cross sections of NADH and FAD. By synchronizing the two beams we create a virtual wavelength for two-photon excitation λv = 2/(1/λ1 + 1/
λ2) that corresponds to 879 nm. (c) Emission filters are chosen to select the emission of NADH and FAD and
reject coherent signals such as SHG, SFG and FWM. (d) The multi-exponential fluorescence intensity decay is transformed with a Fourier transform (FFT) and the real (g) and imaginary (s) parts are plotted in the graphical phasor plot. (e) Two channels fluorescence images of NADH and FAD in reconstructed human skin using synchronized (Δt = 0) and unsynchronized (Δt = 1 ps) beams. Two-photon-excited fluorescence (2PEF) for NADH and FAD fluorophores occurs when fluorophores are excited at λ1. When the beams are synchronized
(Δt = 0), FAD fluorescence is enhanced by two-color two-photon excited fluorescence (2c-2PEF). (f)
Fluorescence lifetime of NADH and FAD is not affected when the fluorophores are two-photon excited by single wavelength or wavelength mixing. Measurements were performed in solution.
(OXPHOS)36, 37. During proliferation, the large increase in glycolytic flux rapidly generates cytosolic ATP
result-ing in high NADH/NAD+ and free/bound NADH ratios15, 36, 38 (Fig. S4). Conversely, cells that are characterized
by an OXPHOS phenotype usually present low NADH/NAD+ and low free/bound NADH ratios.
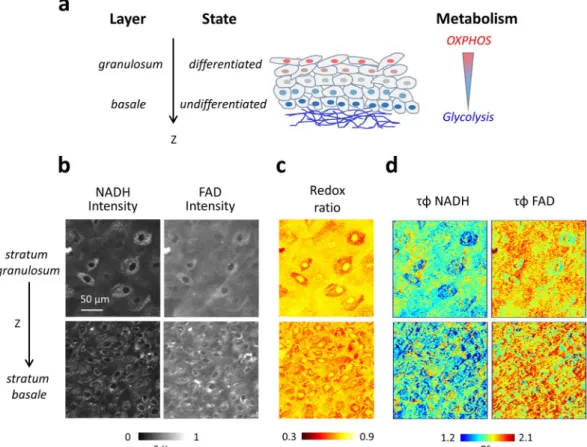
The simultaneous NADH and FAD signals with comparable intensities were at first measured in reconstructed human epidermis (see Methods) (Fig. 2a and b), achieving an intensity redox imaging in a one-shot measurement (Fig. 2c and S5c). Reconstructed human skin is constituted by a fibroblasts-embedded collagenous substrate sup-porting successive layers of keratinocytes: the basal layer, located right above the substrate, contains proliferating undifferentiated cells in a hypoxic environment, while the upper layer stratum granulosum contains differentiated keratinocytes in a normoxic environment. A gradient in cell differentiation state is present between these two lay-ers as a function of depth, which is associated with a metabolic gradient with different balance between Glycolysis and OXPHOS mechanisms (Fig. 2a). 3D image z-stacks of reconstructed human skin samples were recorded, showing a decrease in the redox ratio (FAD/(NADH + FAD)) with depth (Fig. 2c). This indicates an increase of the redox ratio with cell differentiation and oxygen availability, in agreement with their expected metabolic phenotype12, 31, 37.
In addition, NADH and FAD fluorescence lifetimes were simultaneously evaluated in the same samples, show-ing heterogeneity in the tissue and among cells (Fig. 2d). As shown in Fig. 2d, NADH lifetime exhibits smaller values in the undifferentiated basal epithelial cells as compared to the differentiated superficial layers such as
stratum granulosum. The smaller NADH fluorescence lifetime in the basal layer indicates an increased free/bound
NADH ratio, i.e. an energetic metabolism dominated by glycolysis. In the differentiated layers, the increase in NADH lifetime is an indicator of the presence of more bound NADH, i.e. an energetic metabolism dominated by oxidative phosphorylation. These observations are consistent with previously reported results using sequential acquisition schemes12, and therefore validate the mixed wavelength approach for one-shot multiphoton redox
imaging. We also observed an increase in FAD lifetime with the depth (Fig. 2d).
Figure 2. Simultaneous multiphoton FLIM imaging of NADH and FAD reveals a metabolic gradient in redox
ratio and lifetime in reconstructed human skin associated with cell differentiation (a) Three-dimensional scheme of reconstructed human skin. Proliferating cells are located at the basal layer, right above the dermis, while differentiated cells are located on different layers above the basal layer. A metabolic gradient along the z-depth of the epidermis goes from an energetic metabolism dominated by glycolysis in the basal cells to one dominated by OXPHOS in the differentiated cells. (b) NADH and FAD intensities are acquired simultaneously at different depths of the epidermis. Two representative images are shown at two different depths within stratum
basale and stratum granulosum. (c) Intensity redox ratio FAD/(NADH + FAD), calculated simultaneously
from NADH and FAD intensities reveals heterogeneity within single planes and a z-gradient associated with cell differentiation. (d) NADH and FAD lifetime along the z-depth reveals a gradient associated with cell differentiation. Time per pixel, 160 µs. Triplicate experiments were performed.
www.nature.com/scientificreports/
Our in vivo method was then applied to simultaneous NADH and FAD fluorescence lifetime measurements in a live model: the germ line of adult C. Elegans worms (Fig. 3). This organ exhibits a characteristic spatial pattern of cell differentiation: the tip of the germ line is made of the stem cells characterized by a glycolytic metabolic phenotype (Fig. 3a and S4b), while along the germ line there is a gradient of cell differentiation associated with a metabolic gradient from glycolysis to OXPHOS (Fig. 3a and S4a)9, 39.
Simultaneous NADH-FAD fluorescence lifetime images were recorded with comparable intensities (Fig. 3b and c). The data revealed a lifetime gradient in both channels along the germ line (Fig. 3c). The NADH fluores-cence lifetime gradient was particularly pronounced. The tip of the germ line where the stem cells are located was characterized by a short lifetime (1.2 ± 0.1 ns), revealing an elevated ratio of free/bound NADH9, 17 and a
glycolytic phenotype (Fig. S3b). A gradual increase from (1.2 ± 0.1) ns to (1.6 ± 0.2) ns in NADH fluorescence lifetime was found along the germ line axis, indicating a decrease in free/bound NADH ratio associated with a shift toward OXPHOS metabolic phenotype and possibly increased oxygen availability. A less pronounced FAD fluorescence lifetime gradient along the germ line was also detected (Fig. 3c).
Multicolor two-photon imaging of endogenous signals during zebrafish embryo
develop-ment.
Apart from providing a working scheme for simultaneous FAD/NADH redox ratio and fluorescence lifetime measurements, two-photon wavelength mixing in the 700–1040 nm range more generally opens the way to one-shot spectral imaging of the principal sources of endogenous fluorescence in tissues. We explored the possibility of achieving multiphoton imaging of endogenous fluorophores combined with SHG imaging in devel-oping zebrafish embryos (Fig. 4)As previously mentioned, the tunable laser line set to 760 nm (λ1 in Fig. 1a) was mixed with the fixed 1041 nm
line (λ2), resulting in equivalent two-photon excitation at 760, 879, and 1041 nm. Four-channel multiphoton
images were recorded, where epi-detected fluorescence was directed to three separate detectors and SHG pro-duced by the 1041 nm beam was detected in transmission on a fourth detector. Fluorescence filters were chosen
Figure 3. Simultaneous multiphoton FLIM imaging of NADH and FAD reveals a metabolic gradient associated
with stem cell differentiation in C.Elegans germ line (a) Scheme of the germ line of the C. Elegans. Stem cells that are located at the tip of the germ line; a metabolic gradient along the axis of the germ line goes from an energetic metabolism dominated by glycolysis in proliferating stem cells to one dominated by OXPHOS in the differentiated cells39. (b, c) NADH and FAD intensities (b) and lifetimes (c) are simultaneously acquired. Time
for rejecting coherent signals (SHG, SFG, FWM). As shown in Fig. 4a and b, blue fluorescence was efficiently excited at λ1, red fluorescence was efficiently excited at λ2, and green fluorescence was efficiently excited through
two-color excitation when the pulse trains were temporally overlapped in the microscope (Fig. 4 and S6). Zebrafish embryos (n = 9) were first imaged every 2 minutes during early development, from 4 cells to higher stages40 (Fig. 4c and video 1). Spectral imaging evidences major compositional differences between the dividing
cells and the yolk. Cellular fluorescence is blue/green and can be attributed mostly to NADH and FAD, while the yolk exhibits strong green/red fluorescence possibly due to retinoids and oxidized lipids (Fig. 4c and d).
During divisions, the blue fluorescence pattern in cells reveals the spatial distribution of mitochondria, while SHG signal from mitotic spindles peaks at the end of metaphase41 (Fig. 4d). Spectral fluorescence imaging also
revealed interesting changes over time in the yolk. First, an overall decrease of the red fluorescence was observed
Figure 4. Multicolor two-photon efficient imaging of multiple endogenous fluorophores during early stages of
zebrafish embryo development (a) Energy diagrams of two-photon excited fluorescence (2PEF) for blue and red fluorophores, two-color two-photon excited fluorescence (2c-2PEF) for green fluorophores, second harmonic generation (SHG), sum frequency generation (SFG) and four wave mixing (FWM). (b) Bandpass filters are chosen to select the emission of blue, green and red fluorophores rejecting coherent signals such as SHG, SFG and FWM. (c) Images of the blue, green, red fluorescence channel and SHG of the same zebrafish embryo at three different time points of development. Images of merged channels represent a shift in the spectroscopic characteristics of the yolk. (d) Multicolor two-photon and SHG images of the zebrafish embryo at 4 cell stage. Time per pixel, 40 µs. This experiment has been repeated in three independent samples.
www.nature.com/scientificreports/
during the first hours of embryo development (Fig. 4c and video 1 in S1); we verified that this effect was not due to photo-bleaching (see Figure S7). In addition, fluorescence time-lapse imaging highlighted the shapes and dynamic behavior of yolk platelets (video 1)41–43. We found that adjacent yolk compartments have different
spec-troscopic characteristics (Fig. 4c), revealing different relative concentrations in fluorescent species. Moreover, the ratio between green and red fluorescence was found altering during the division stages and building up a gradient along the animal-vegetal yolk: yolk platelets that are closer to yolk syncytial layer (YSL, forming the interface with the dividing cells) exhibit stronger red fluorescence with respect to the yolk domains located further from the YSL (video 1 and video 2 in S1).
These observations suggest that spectral imaging of the embryo endogenous fluorescence provides a direct visualization of the mobilization of yolk nutrients and of metabolic gradients during cell cleavage and early devel-opment stages.
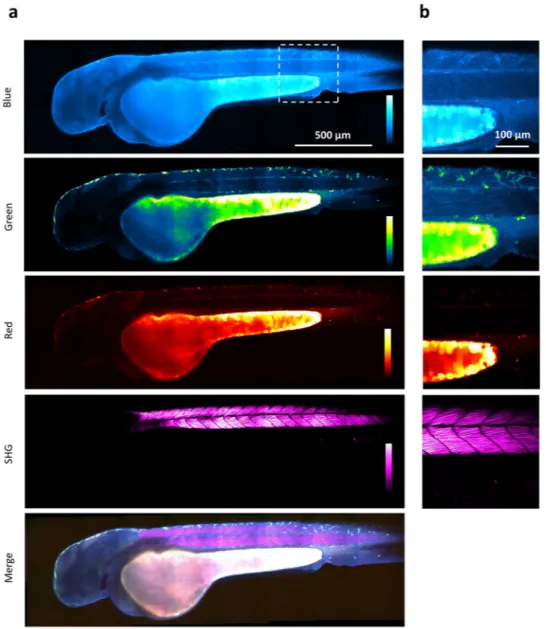
We also recorded multicolor multiphoton images of endogenous signals at later stages of development. Figure 5 and video 3 show a zebrafish embryo at 48 hours post fertilization imaged using simultaneous trichro-matic 2PEF and SHG signals. Here again, spectral multiphoton fluorescence imaging reveals the biochemical het-erogeneity of yolk compartments. In addition, blue endogenous fluorescence, presumably dominated by NADH signals, provides detailed structural and possibly metabolic information from other regions such as the head and the trunk muscles. Strong SHG signals are obtained from myofilaments in the trunk, as reported in previous studies3, 44. Pigmented skin cells are particularly visible in the green channel.
Figure 5. Multicolor two-photon efficient imaging of endogenous fluorophores in zebrafish embryo Images of
the blue, green, red fluorescence, second harmonic generation, and merged channels of a live zebrafish embryo recorded 48 hours post fertilization (a) Large-scale (stitched mosaic) image encompassing 2450 × 730 µm2. (b)
Detail extracted from the large-scale image. Pixel size, 0.83 µm. Multicolor pixel acquisition time, 40 µs. Scale bar, 500 µm.
Conclusions
The present work implemented and demonstrated an efficient method for simultaneously imaging several endogenous fluorophores with different absorption spectra within a single measurement, which delivers intrin-sic sub-micron registration of the color channels and is compatible with coherent nonlinear contrasts. Using mixed-wavelength two-photon excitation33, we demonstrated simultaneous excitation of endogenous blue, green
and red intrinsic fluorophores along with SHG imaging in living tissues.
In particular, a simultaneous efficient two-photon excitation of NADH and FAD (Figs 1e, 2 and 3) was achieved in cells and tissues. In two-photon studies, NADH and FAD are usually excited sequentially at ~740 nm and ~900 nm. Their large difference in concentration5 limits simultaneous excitation of both fluorophores with
a single wavelength, even if they have overlapping two-photon absorption spectra2, 32 (Fig. S1c and d). This work
optimized NADH and FAD excitation efficiencies by controlling FAD signal level independently of NADH through two-color two-photon excitation (Fig. 1a and e), resulting in comparable fluorescence intensities in the two channels in a one-shot measurement. This method therefore permits fast intensity-based measurements of redox ratios to be performed without motion artifacts (Figs 2c, 4c and S5c) in dynamic systems such as develop-ing embryos and alterdevelop-ing tissues.
The simultaneous two-photon FLIM of NADH and FAD with comparable signal-to-noise ratios, resulting in comparable precision of the fluorescence lifetimes in both channels, was also demonstrated (Figs 2 and 3, S2, S3
and S5). This approach towards simultaneous measurement of NADH and FAD redox and FLIM gradients was applied and revealed changes in oxidative phosphorylation and glycolysis metabolic rates in living tissues, namely reconstructed human skin (Fig. 2) and adult C. Elegans germ line (Fig. 3). Two-photon FLIM is being increasingly used to study metabolic activity gradients such as the ones present across the different skin cell layers from epi-dermis to epi-dermis layer in order to characterize skin pathologies12, 23, 45, and to monitor cell differentiation in living
systems9, 12, 17. However, tissue imaging experiments were so far hampered by the necessary sequential excitation
of NADH and FAD with a tunable laser.
Multicolor two-photon imaging of endogenous fluorophores by wavelength mixing therefore opens new per-spectives for in vivo measurements in the context of biomedical applications and for non-invasive longitudinal studies in developmental biology.
Measuring redox ratio in a one shot reveals heterogeneity among cells and even within cells (Fig. 2c and S5c). The ability to simultaneously monitor the changes in redox ratio and in the NAD+/NADH and FAD/FADH
2
ratio may give access to crucial information about the spatiotemporal dynamics of metabolic activity changes in tissues. Indeed, recent studies indicated that NADH and FAD fluorescence lifetimes and intensity redox ratio pro-vide complementary information about the phenotypic heterogeneity in cancer tissue and can identify different subtypes of cells12, 46, 47. For the sake of caution, we note however that redox ratio measurements in thick tissue
may be complicated by wavelength-dependent scattering. In contrast, FLIM measurements are less affected by variations in excitation intensity and fluorophore concentration.
Finally, the potential of our method was demonstrated to simultaneously excite multiple endogenous fluoro-phores in the 700–1000 nm range in developing zebrafish embryos (Figs 4 and 5), in combination with SHG imag-ing. Longitudinal measurements during embryo development revealed morphological and functional changes, signed by changes in the spectroscopic properties of endogenous fluorescence (Fig. 4c and video 1 and video 2). Within the yolk, a compositional heterogeneity between yolk compartments was found together with a global decrease in the red-to-green fluorescence ratio over time and the formation of a compositional gradient along the vegetal-animal axis (Fig. 4c).
This method allows changes in cellular redox ratio during early development to being characterized in a label-free manner. Of note, energy metabolic pathways play a crucial role in embryonic development and mor-phogenesis, establishing a complex interplay between epigenetic and tissue organization48, 49. Metabolic shifts in
fact not only affect the energetic production of single cells, but also the activity of redox-sensitive transcription factors, which alter gene expression patterns48. Overall, the approach presented here can be used to track rapid
metabolic changes during embryo development and provides a promising label-free optical tool for studying metabolic spatial-temporal changes in vivo.
Methods
Multicolor two-photon imaging.
Imaging was performed on a lab-built laser scanning microscope. We used a dual-output infrared femtosecond laser source (Insight DS+, Spectra-Physics, Santa Clara, CA, USA) with a first beam tunable from 680 nm to 1300 nm (120 fs pulses, 80 MHz) and a second, fixed wavelength beam at 1041 nm (200 fs pulses). A dichroic mirror (Semrock, Rochester, NY, USA) was used to combine the two beams. Power in the two beams was controlled with motorized wave plates and polarizers. For wavelength mixing, beams were spatially overlapped at the sample plane using independent telescopes and mirrors33, and pulses weretempo-rally overlapped using a delay line. Calibration of the delay line was performed by minimizing the delay between the two pulse trains and maximizing the sum frequency generation (SFG) signal from a KDP particle. For simul-taneous excitation of blue, green and red endogenous fluorescence, excitation wavelengths λ1, λ2 and two-color
equivalent excitation λv = 2/(1/λ1 + 1/λ2) wavelengths were set to 760 nm, 1041 nm and 879 nm, respectively. A
water immersion objective (25×, 1.05NA, XLPLN25XWMP, Olympus, Tokyo, Japan) was used to focus the beam in the sample. Typical power was 10 mW for the 760 nm line and 40 mW for 1041 nm line. Signals were detected in the epi- and trans-directions by GaAsP modules (H7422P-40, Hamamatsu, Japan) or photomultiplier modules (SensTech, Langley, UK) and lab-designed counting electronics enabling time-correlated single photon counting for FLIM imaging (see below). Scanning and acquisition were synchronized using lab-written LabVIEW soft-ware and a multichannel I/O board (PCI-6115, National Instruments, Austin, TX, USA). Fluorescence was col-lected in the backward (epi) direction using a dichroic mirror (695dcxru, Chroma, USA) and 2PEF signals were directed toward three independent detectors using dichroic mirrors (Semrock 520 nm and 562 nm). Bandpass
www.nature.com/scientificreports/
filters were used in front of the detectors to collect blue (Semrock FF01–466/40), green (Semrock FF01–550/49) and red (Semrock FF01–650/40) fluorescence, respectively. SHG was collected in transmission with a bandpass filter 520/15 nm (Semrock FF01–520/15). Scanning was performed by galvanometric mirrors (VM500S, GSI Lumonics, Bedford, MA, USA). Typically the acquisition time of intensity images was on the order of few sec-onds, with a pixel dwell time of 20 μs.
Fluorescence Lifetime Imaging Microscopy.
FLIM data are acquired simultaneously in two channels with a custom made TCSPC electronic card programmed on FPGA with 24 temporal bins of 500 ps. For every laser pulse, the electronics counts single photons in a histogram according to their arrival time. The histogram has 24 temporal bins, each bin width is 1/(24*ν) = 0.52 ns, where ν = 80 MHz is the laser frequency. The arrival time between the photon and the laser pulse is measured by a Time to Digital Converter (TDC). The laser pulse time, detected by a photodiode (Thorlabs PDA10CF-EC) is the start of the TDC. The photons arrival time from the PMT (Hamamatsu H7422P-40) is the stop of the TDC. The pulses of the PMT are detected by a fast discriminator (Hamamatsu C9744 photon counting unit). The random amplification mechanism and the transit time spread of the detector induce a timing jitter. Since we measure a jitter after the discriminator of 400 ps, which is smaller than the temporal window of 500 ps, we do not add a Constant Fraction Discriminator (CFD). Calibration of the system is performed by measuring the lifetime of the SHG (0 ns) and lifetime of fluorescein at pH9 with a single exponential of 4.04 ns (see Fig. S2a). Typically, the acquisition time of FLIM images is on the order of 4 minutes for a 320 × 320 pixels image at a pixel dwell time of 160 μs/pixel (eight images with 20 μs/pixel are accumulated).Data analysis and processing.
All intensity data were analyzed and treated with ImageJ (NIH, Bethesda, MD, USA). All FLIM data were processed and analyzed with a Matlab (Mathworks, Natick, MA, USA) custom written software. Every pixel of the FLIM image was transformed in one pixel in the phasor plot as previously described9, 35 and reported in detail in the Supplementary information. The coordinates g and s in the phasor plotwere calculated from the fluorescence intensity decay of each pixel of the image (Fig. 1d) by using the transfor-mations defined in the Supplementary material. We applied a median filter on the g and s images to reduce the variance of the phasor location without decreasing the spatial resolution of the image50. For every pixel of the
image, we calculated the value of τϕ (equation 5 in Supplementary material) starting from the g and s images. We
represented the FLIM data with the τϕ map.
Reconstructed human skin.
Reconstructed human skin samples (T-Skin™
model) were purchased from Episkin™
(Lyon, France) at day 11. T-Skin™
is a full thickness skin model containing both living dermis and epidermis covered by a well-structured stratum corneum. The dermal layer contains normal human fibroblasts embedded in a collagenous substrate supporting successive keratinocyte layers: the basal layer, located right above the dermal substrate, contains proliferating undifferentiated cells, while the uppermost layer, the stratumcor-neum, contains fully differentiated keratinocytes, i.e. corneocytes. This model is histologically similar to the in
vivo human skin. The T-Skin
™
samples, reconstructed at day 11, were placed between two glass coverslips witha few µl of culture medium (Episkin Assay Medium, Episkin
™
, Lyon, France) and imaged immediately after preparation.C. Elegans Germ line.
The C. Elegans strain used in this study was the Bristol wild-type N2 variety. Nematodes were grown at 20 °C on NGM plates seeded with E. coli strain OP50. To mount the nematodes, a 10% agarose pad was extemporaneously prepared on a coverslip. Young adults or L4 larvae were transferred in a drop of 0.1 µm polystyrene beads (Polyscience Inc. cat 00876, Warrington, PA, USA) without any anesthetic drug. A coverslip was added and animals were immediately imaged.Zebrafish embryo.
Embryos were obtained from a wild type fish line (TU) and provided by Amagen facility at Paris Saclay University. Embryos were imaged at 3 and 48 hpf. Imaging of zebrafish early embryonic develop-ment was performed by embedding the embryos in 1% Low Melting Point agarose (Invitrogen, cat 15517–014, Carlsbad, CA, USA). Embryos were kept inside their chorions. Imaging of 48hpf embryos was performed by embedding them in 1.5–2% Low Melting Point agarose and adding tricaine (MS-222 Sigma, cat E10521, St. Louis, MO, USA) to a final concentration of 0.02%.Solution preparation.
A solution of 250 μM NADH (Sigma Aldrich n. N8129, St. Louis, MO, USA) was pre-pared in 100 mM Mops buffer at pH 7. FAD solution (Sigma Aldrich n. F6625, St. Louis, MO, USA) was diluted at 2 mg/ml in water.NIH 3T3 mouse embryonic fibroblast cells.
NIH 3T3 cells were purchased from the American Type Culture Collection (ATCC, Manassas, VA, USA). NIH3T3 mouse fibroblast cells were cultured on 3.5-cm glass bottom petri dishes (MatTek, Ashland, MA, USA) in Dulbecco’s Modified Eagle’s Medium (DMEM) modified without phenol red and containing 10% FBS and 1% penicillin/streptomycin. Cells were plated at the initial density of 5,000 cells/cm2 and allowed to attach overnight in a humidified cell culture incubator at 37 °C in 5%CO2/95% air before proceeding with treatments.
References
1. Zipfel, W. R., Williams, R. M. & Webb, W. W. Nonlinear magic: multiphoton microscopy in the biosciences. Nature Biotechnology
21, 1368–1376, doi:10.1038/nbt899 (2003).
2. Zipfel, W. R. et al. Live tissue intrinsic emission microscopy using multiphoton-excited native fluorescence and second harmonic generation. Proc Natl Acad Sci USA 100, 7075–7080, doi:10.1073/pnas.0832308100 (2003).
3. Campagnola, P. J. & L., L. Second-harmonic imaging microscopy for visualizing biomolecular arrays in cells, tissues and organisms.
4. Débarre, D. et al. Imaging lipid bodies in cells and tissues using third-harmonic generation microscopy. Nat Methods. 3, 47–53, doi:10.1038/nmeth813 (2006).
5. Heikal, A. A. Intracellular coenzymes as natural biomarkers for metabolic activities and mitochondrial anomalies. Biomark Med. 4, 241–263, doi:10.2217/bmm.10.1 (2010).
6. Chance, B., Jobsis, F., Schoener, B. & Cohen, P. Intracellular oxidation-reduction states in vivo. Science 137, 499–508, doi:10.1126/ science.137.3529.499 (1962).
7. Kasischke, K. A., Vishwasrao, H. D., Fisher, P. J., Zipfel, W. R. & Webb, W. W. Neural activity triggers neuronal oxidative metabolism followed by astrocytic glycolysis. Science 305, 99–103, doi:10.1126/science.1096485 (2004).
8. Uchugonova, A. & Konig, K. Two-photon autofluorescence and second-harmonic imaging of adult stem cells. J Biomed Opt. 13, 054068, doi:10.1117/1.3002370 (2008).
9. Stringari, C. et al. Phasor approach to fluorescence lifetime microscopy distinguishes different metabolic states of germ cells in a live tissue. Proc Natl Acad Sci USA 108, 13582–13587, doi:10.1073/pnas.1108161108 (2011).
10. Quinn, K. P. et al. Quantitative metabolic imaging using endogenous fluorescence to detect stem cell differentiation. Sci Rep 3, 3432, doi:10.1038/srep03432 (2013).
11. Plotegher, N. et al. NADH fluorescence lifetime is an endogenous reporter of α-synuclein aggregation in live cells. FASEB J. 29, 2484–2494, doi:10.1096/fj.14-260281 (2015).
12. Skala, M. C. et al. In vivo multiphoton microscopy of NADH and FAD redox states, fluorescence lifetimes, and cellular morphology in precancerous epithelia. Proc Natl Acad Sci U S A 104, 19494–19499, doi:10.1073/pnas.0708425104 (2007).
13. Lakowicz, J. R., Szmacinski, H., Nowaczyk, K. & Johnson, M. L. Fluorescence lifetime imaging of free and protein-bound NADH.
Proc Natl Acad Sci USA 89, 1271–1275, doi:10.1073/pnas.89.4.1271 (1992).
14. Becker, W. et al. Fluorescence lifetime imaging by time-correlated single-photon counting. Microsc Res Tech 63, 58–66, doi:10.1002/ jemt.v63:1 (2004).
15. Bird, D. K. et al. Metabolic mapping of MCF10A human breast cells via multiphoton fluorescence lifetime imaging of the coenzyme NADH. Cancer Res. 65, 8766–8773, doi:10.1158/0008-5472.CAN-04-3922 (2005).
16. Becker, W. Fluorescence lifetime imaging - techniques and applications. J Microsc 247, 119–136, doi:10.1111/jmi.2012.247.issue-2
(2012).
17. Stringari, C. et al. Metabolic trajectory of cellular differentiation in small intestine by Phasor Fluorescence Lifetime Microscopy of NADH. Sci Rep. 2, doi:10.1038/srep00568 (2012).
18. Bowles, J. et al. Retinoid signaling determines germ cell fate in mice. Science 312, 596–600, doi:10.1126/science.1125691 (2006). 19. Schilling, T. F., Nie, Q. & Lander, A. D. Dynamics and precision in retinoic acid morphogen gradients. Curr Opin Genet Dev 22,
562–569, doi:10.1016/j.gde.2012.11.012 (2012).
20. Sosnik, J. et al. Noise modulation in retinoic acid signaling sharpens segmental boundaries of gene expression in the embryonic zebrafish hindbrain. Elife 2, e14034, doi:10.7554/eLife.14034 (2016).
21. Krasieva, T. B. et al. Two-photon excited fluorescence lifetime imaging and spectroscopy of melanins in vitro and in vivo. J Biomed
Opt. 18 (2013).
22. Varone, A. et al. Endogenous Two-Photon Fluorescence Imaging Elucidates Metabolic Changes Related to Enhanced Glycolysis and Glutamine Consumption in Precancerous Epithelial Tissues. Cancer Res. 74, 3067–3075, doi:10.1158/0008-5472.CAN-13-2713
(2014).
23. Fereidouni, F., Bader, A. N., Colonna, A. & Gerritsen, H. C. Phasor analysis of multiphoton spectral images distinguishes autofluorescence components of in vivo human skin. J Biophotonics. 7, 589–596, doi:10.1002/jbio.v7.8 (2014).
24. Ranjit, S. et al. E. Imaging Fibrosis and Separating Collagens using Second Harmonic Generation and Phasor Approach to Fluorescence Lifetime Imaging. Sci Rep 21, 13378, doi:10.1038/srep13378 (2015).
25. Fereidouni, F., Bader, A. N. & Gerritsen, H. C. Spectral phasor analysis allows rapid and reliable unmixing of fluorescence microscopy spectral images. Opt Express. 20, 12729–12741, doi:10.1364/OE.20.012729 (2012).
26. Nie, Z. J., An, R., Hayward, J. E., Farrell, T. J. & Fang, Q. Y. Hyperspectral fluorescence lifetime imaging for optical biopsy. J Biomed
Opt. 18 (2013).
27. Ruck, A., Hauser, C., Mosch, S. & Kalinina, S. Spectrally resolved fluorescence lifetime imaging to investigate cell metabolism in malignant and nonmalignant oral mucosa cells. J Biomed Opt. 19 (2014).
28. Fereidouni, F., Reitsma, K. & Gerritsen, H. C. High speed multispectral fluorescence lifetime imaging. Opt Express. 21, 11769–11782, doi:10.1364/OE.21.011769 (2013).
29. Georgakoudi, I. & Quinn, K. P. In Annu Rev Biomed Eng. Vol. 14 Annual Review of Biomedical Engineering (ed. M. L. Yarmush) 351–367 (2012).
30. Chang, T. et al. Non-invasive monitoring of cell metabolism and lipid production in 3D engineered human adipose tissues using label-free multiphoton microscopy. Biomaterials 34, 8607–8616, doi:10.1016/j.biomaterials.2013.07.066 (2013).
31. Hou, J. et al. Correlating two-photon excited fluorescence imaging of breast cancer cellular redox state with seahorse flux analysis of normalized cellular oxygen consumption. J Biomed Opt. 21, 10.1117/1.JBO.21.6.060503 (2016).
32. Huang, S. H., Heikal, A. A. & Webb, W. W. Two-photon fluorescence spectroscopy and microscopy of NAD(P)H and flavoprotein.
Biophys J. 82, 2811–2825, doi:10.1016/S0006-3495(02)75621-X (2002).
33. Mahou, P. et al. Multicolor two-photon tissue imaging by wavelength mixing. Nat Methods. 9, 815–818, doi:10.1038/nmeth.2098
(2012).
34. Mahou, P., Vermot, J., Beaurepaire, E. & Supatto, W. Multicolor two-photon light-sheet microscopy. Nat Methods. 11, 600–601, doi:10.1038/nmeth.2963 (2014).
35. Digman, M. A., Caiolfa, V. R., Zamai, M. & Gratton, E. The phasor approach to fluorescence lifetime imaging analysis. Biophys J. 94, L14–L16, doi:10.1529/biophysj.107.120154 (2008).
36. Vander Heiden, M. G., Cantley, L. C. & Thompson, C. B. Understanding the Warburg effect: the metabolic requirements of cell proliferation. Science 324, 1029–1033, doi:10.1126/science.1160809 (2009).
37. Smith, J., Ladi, E., Mayer-Proschel, M. & Noble, M. Redox state is a central modulator of the balance between self-renewal and differentiation in a dividing glial precursor cell. Proc Natl Acad Sci USA 97, 10032–10037, doi:10.1073/pnas.170209797 (2000). 38. DeBerardinis, R. J., Lum, J. J., Hatzivassiliou, G. & Thompson, C. B. The Biology of Cancer: Metabolic Reprogramming Fuels Cell
Growth and Proliferation. Cell Metab. 7, 11–20, doi:10.1016/j.cmet.2007.10.002 (2008).
39. Cinquin, O., Crittenden, S. L., Morgan, D. E. & Kimble, J. Progression from a stem cell-like state to early differentiation in the C.
Elegans germ line. Proc Natl Acad Sci USA 107, 2048–2053, doi:10.1073/pnas.0912704107 (2010).
40. Kimmel, C. B., Ballard, W. W., Kimmel, S. R., Ullmann, B. & Schilling, T. F. Stages of embryonic development of the zebrafish. Dev.
Dyn. 203, 253–310, doi:10.1002/aja.1002030302 (1995).
41. Olivier, N. et al. Cell lineage reconstruction of early zebrafish embryos using label-free nonlinear microscopy. Science 329, 967–971, doi:10.1126/science.1189428 (2010).
42. Fernandez, J., Valladares, M., Fuentes, R. & Ubilla, A. Reorganization of cytoplasm in the zebrafish oocyte and egg during early steps of ooplasmic segregation. Dev. Dyn. 235, 656–671, doi:10.1002/dvdy.20682 (2006).
43. Fuentes, R. & Fernandez, J. Ooplasmic Segregation in the Zebrafish Zygote and Early Embryo: Pattern of Ooplasmic Movements and Transport Pathways. Dev. Dyn. 239, 2172–2189, doi:10.1002/dvdy.22349 (2010).
www.nature.com/scientificreports/
44. Nucciotti, V. et al. Probing myosin structural conformation in vivo by second-harmonic generation microscopy. Proc Natl Acad Sci
USA 107, 7763–7768, doi:10.1073/pnas.0914782107 (2010).
45. Konig, K. & R., I. High-resolution multiphoton tomography of human skin with subcellular spatial resolution and picosecond time resolution. J Biomed Opt. 8, 432–439, doi:10.1117/1.1577349 (2003).
46. Walsh, A. J. et al. Optical metabolic imaging identifies glycolytic levels, subtypes, and early-treatment response in breast cancer.
Cancer Res 73, 6164–6174, doi:10.1158/0008-5472.CAN-13-0527 (2013).
47. Walsh, A. J. & Skala, M. C. Optical metabolic imaging quantifies heterogeneous cell populations. Biomedical optics express 6, 559–573, doi:10.1364/BOE.6.000559 (2015).
48. Harvey, A. J., K. L., K. & T., aJ. G. Redox regulation of early embryo developement. Reproduction 123, 479–486, doi:10.1530/ rep.0.1230479 (2002).
49. Dumollard, R., W., Z., Carroll, J. & Duchen, M. R. Regulation of redox metabolism in the mouse oocyte and embryo. Development
134, 455–465, doi:10.1242/dev.02744 (2007).
50. Fluorescence Lifetime Spectroscopy and Imaging Principles and Applications in Biomedical Diagnostics. CRC Press (2014).
Acknowledgements
We thank Marie-Claire Schanne-Klein and Emilie Menant for scientific discussions and technical help. This work was supported in part by Marie Curie European Grant PIIF-GA-2013-629418 and by Agence Nationale de la Recherche under contracts ANR-10-INBS-04 France BioImaging, ANR-11-EQPX-0029 Morphoscope2 and ANR-15-CE11-0012-01 NLOMMIT.
Author Contributions
C.S., E.B., W.S., R.L., J.B.G. and A.M.P. conceived the experiments. C.S., L.A., P.M., X.S. and E.B. implemented the microscopy setup. C.S., G.M., I.L., S.B., J.B.G. and R.L. prepared samples and performed experiments. C.S. and E.B. coordinated the study and analyzed the data. All authors contributed to the manuscript.
Additional Information
Supplementary information accompanies this paper at doi:10.1038/s41598-017-03359-8
Competing Interests: The authors declare that they have no competing interests.
Publisher's note: Springer Nature remains neutral with regard to jurisdictional claims in published maps and
institutional affiliations.
Open Access This article is licensed under a Creative Commons Attribution 4.0 International
License, which permits use, sharing, adaptation, distribution and reproduction in any medium or format, as long as you give appropriate credit to the original author(s) and the source, provide a link to the Cre-ative Commons license, and indicate if changes were made. The images or other third party material in this article are included in the article’s Creative Commons license, unless indicated otherwise in a credit line to the material. If material is not included in the article’s Creative Commons license and your intended use is not per-mitted by statutory regulation or exceeds the perper-mitted use, you will need to obtain permission directly from the copyright holder. To view a copy of this license, visit http://creativecommons.org/licenses/by/4.0/.